Building Decision Tree and Visualize in Exploratory
The Decision Tree is one of the popular algorithms used in Data Science. We introduced the Decision Tree Analytics view in Exploratory release 5.0. In this article, I’m going to explain how to build a decision tree model and visualize the rules.
Preparing Data
Here I’m going to use a decision tree to examine the condition of people with high survival rate by using passenger data of the Titanic. I prepared the data in CSV format. You can download it from here.
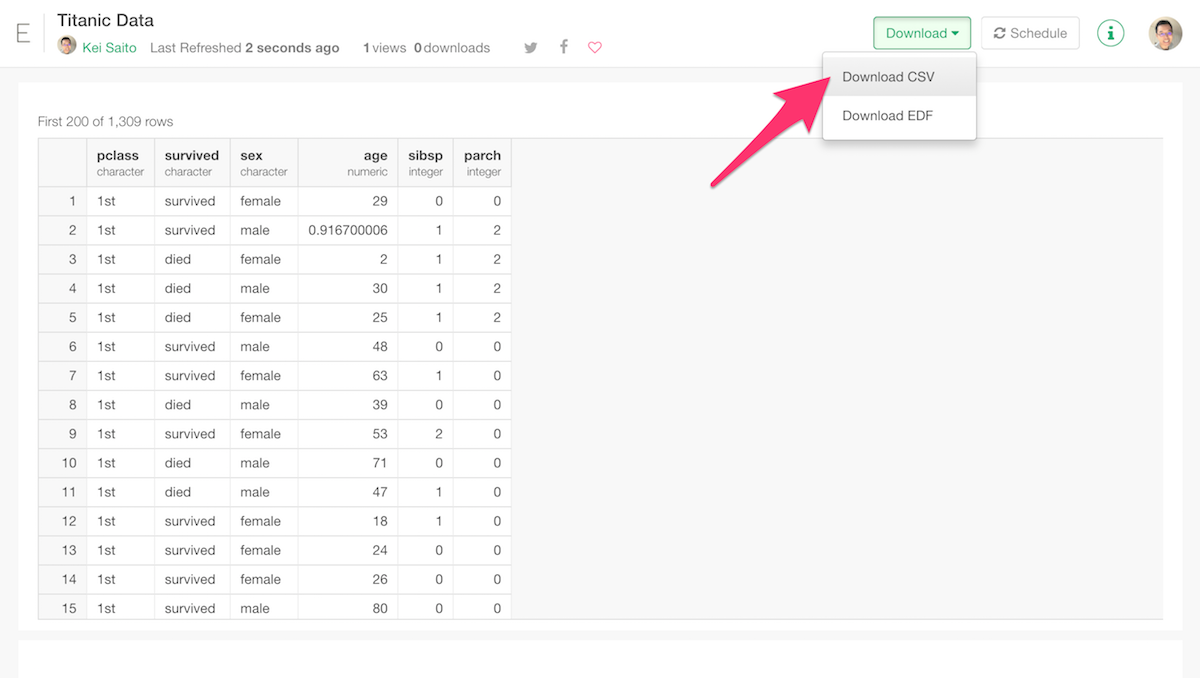
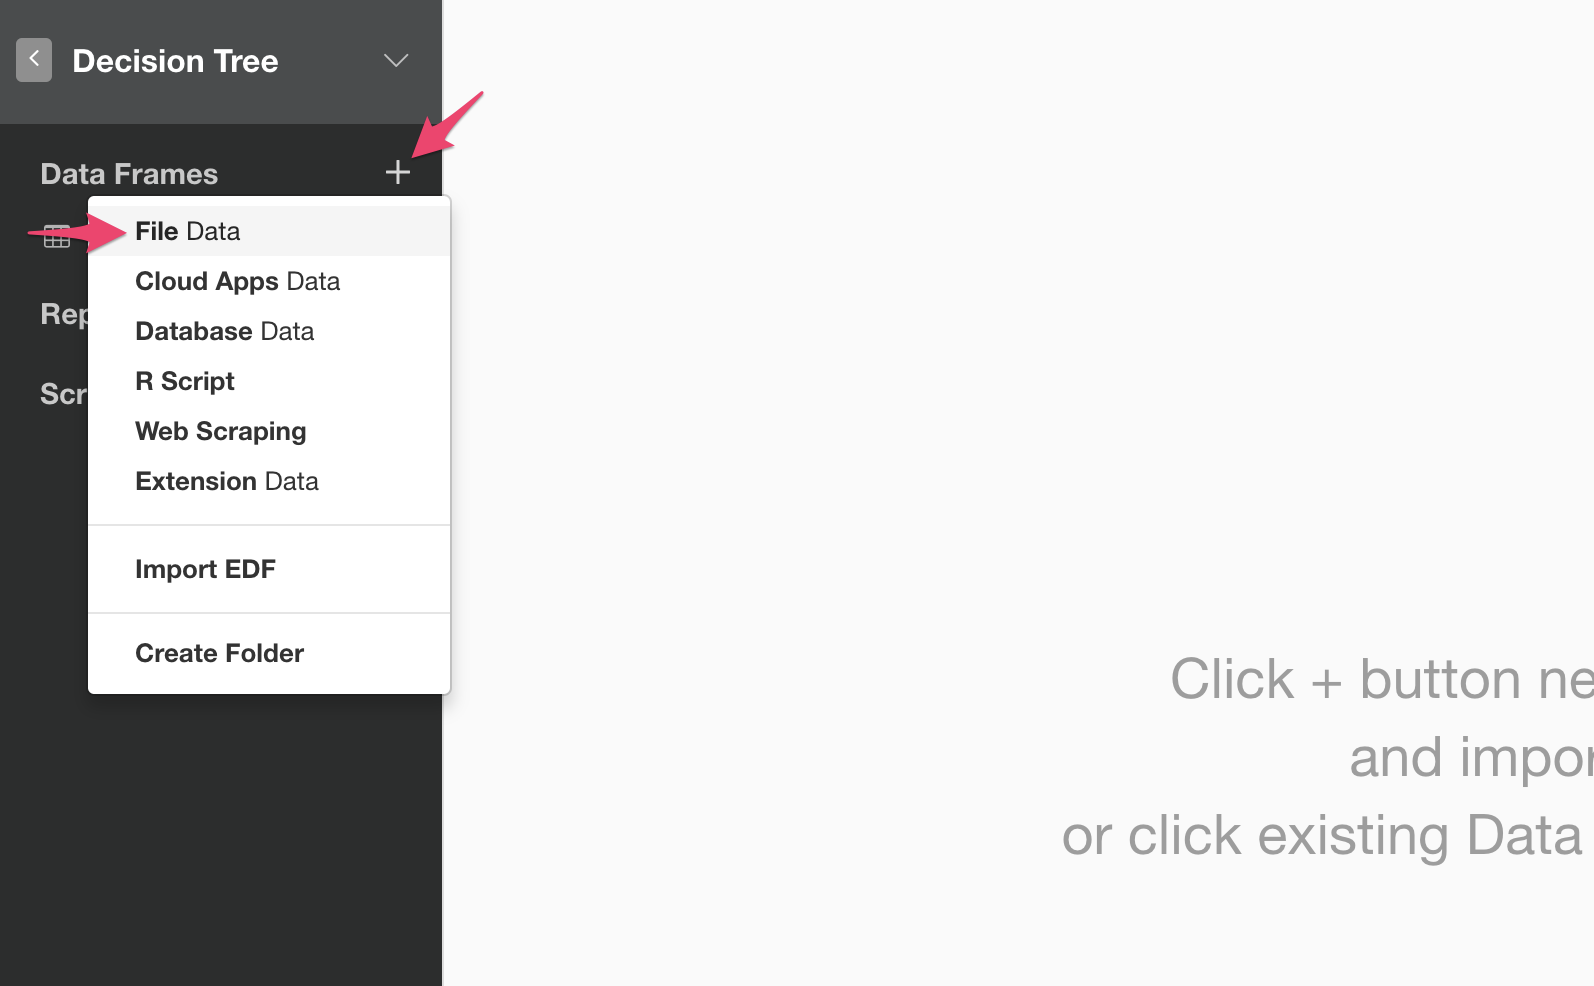
Once you download the data file, import it into Exploratory. Click the + button to the right of “Data Frames” in the left tree and select “File Data”.
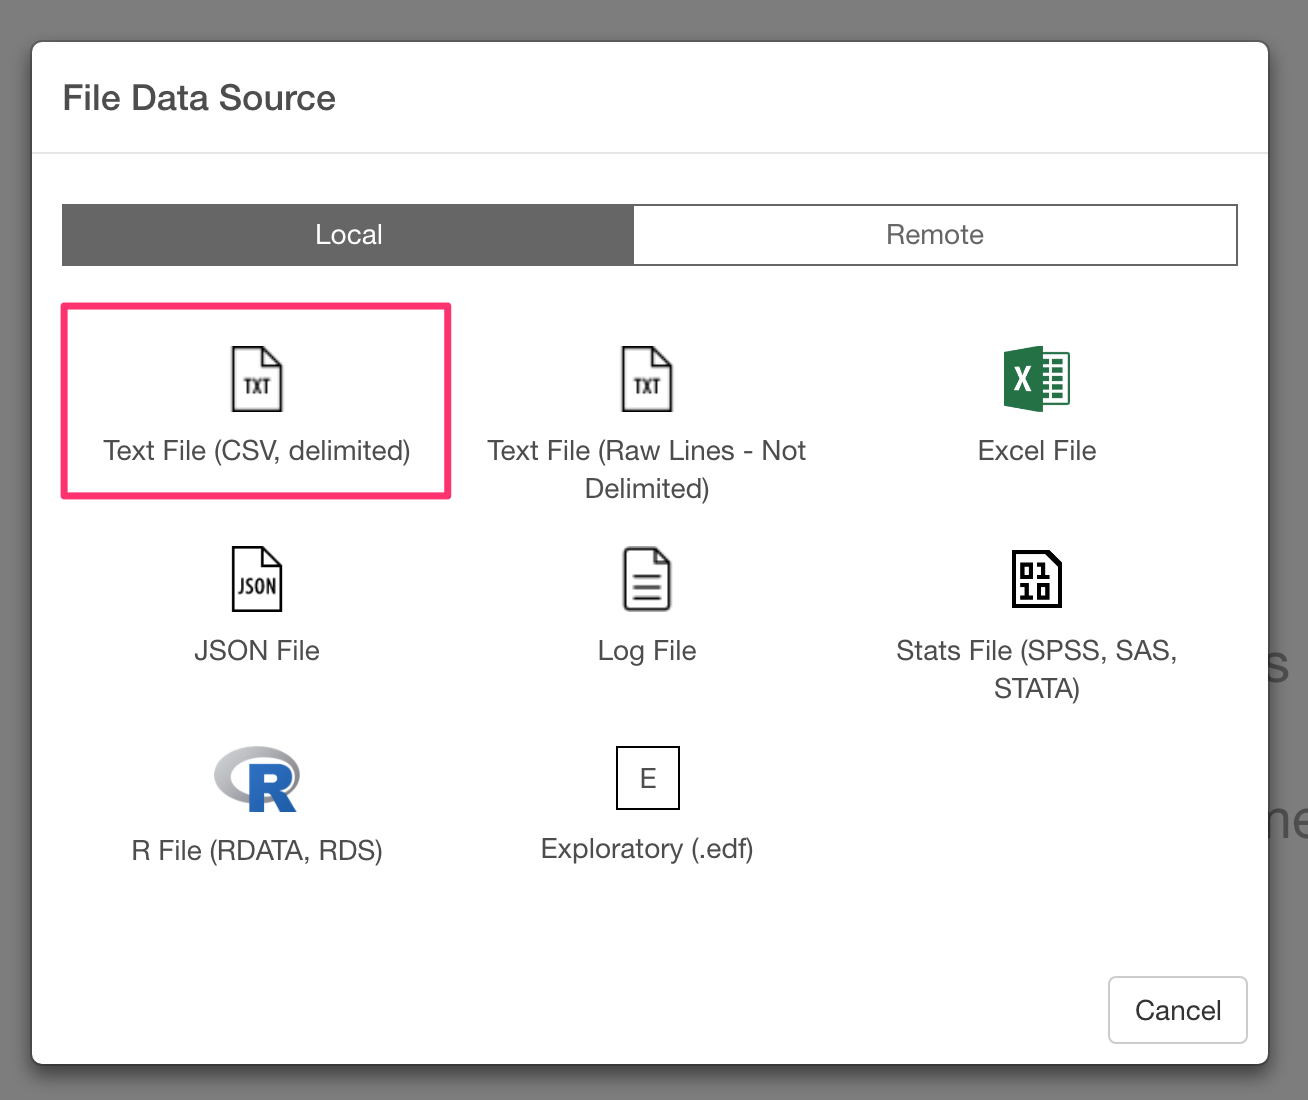
A dialog to select the data type appears. Select “Text File”.
Then, the import dialog comes up. Select the downloaded file, and you will see the preview of the data. Confirm the data and press “Save” button.
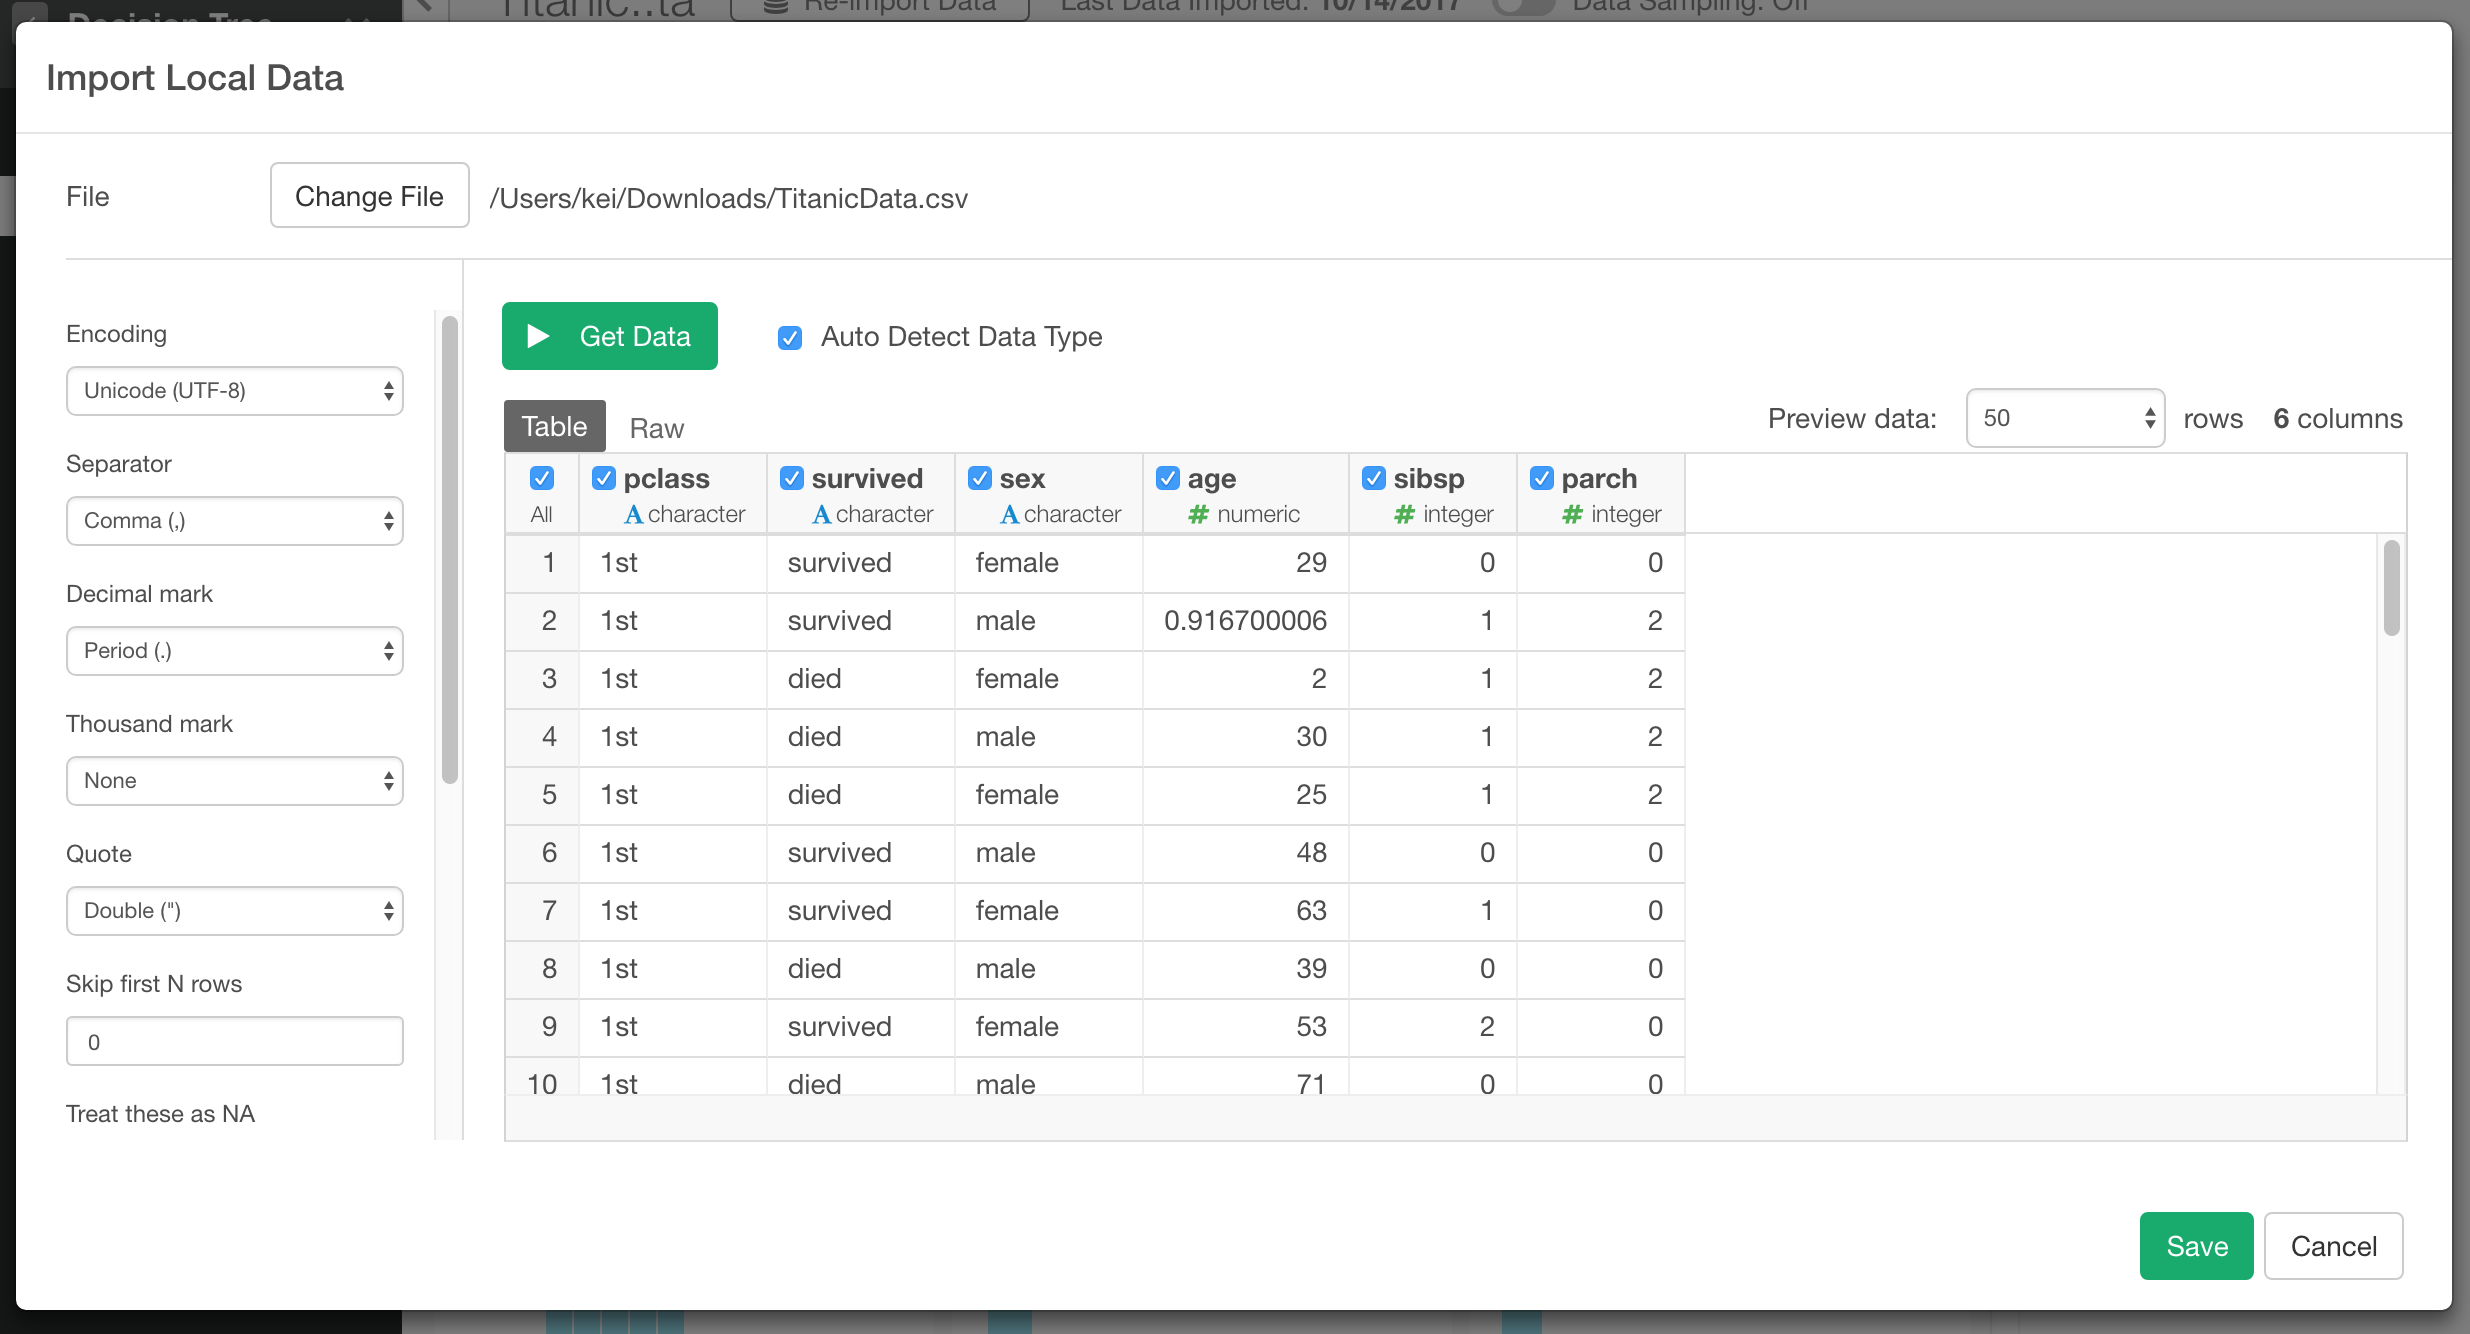
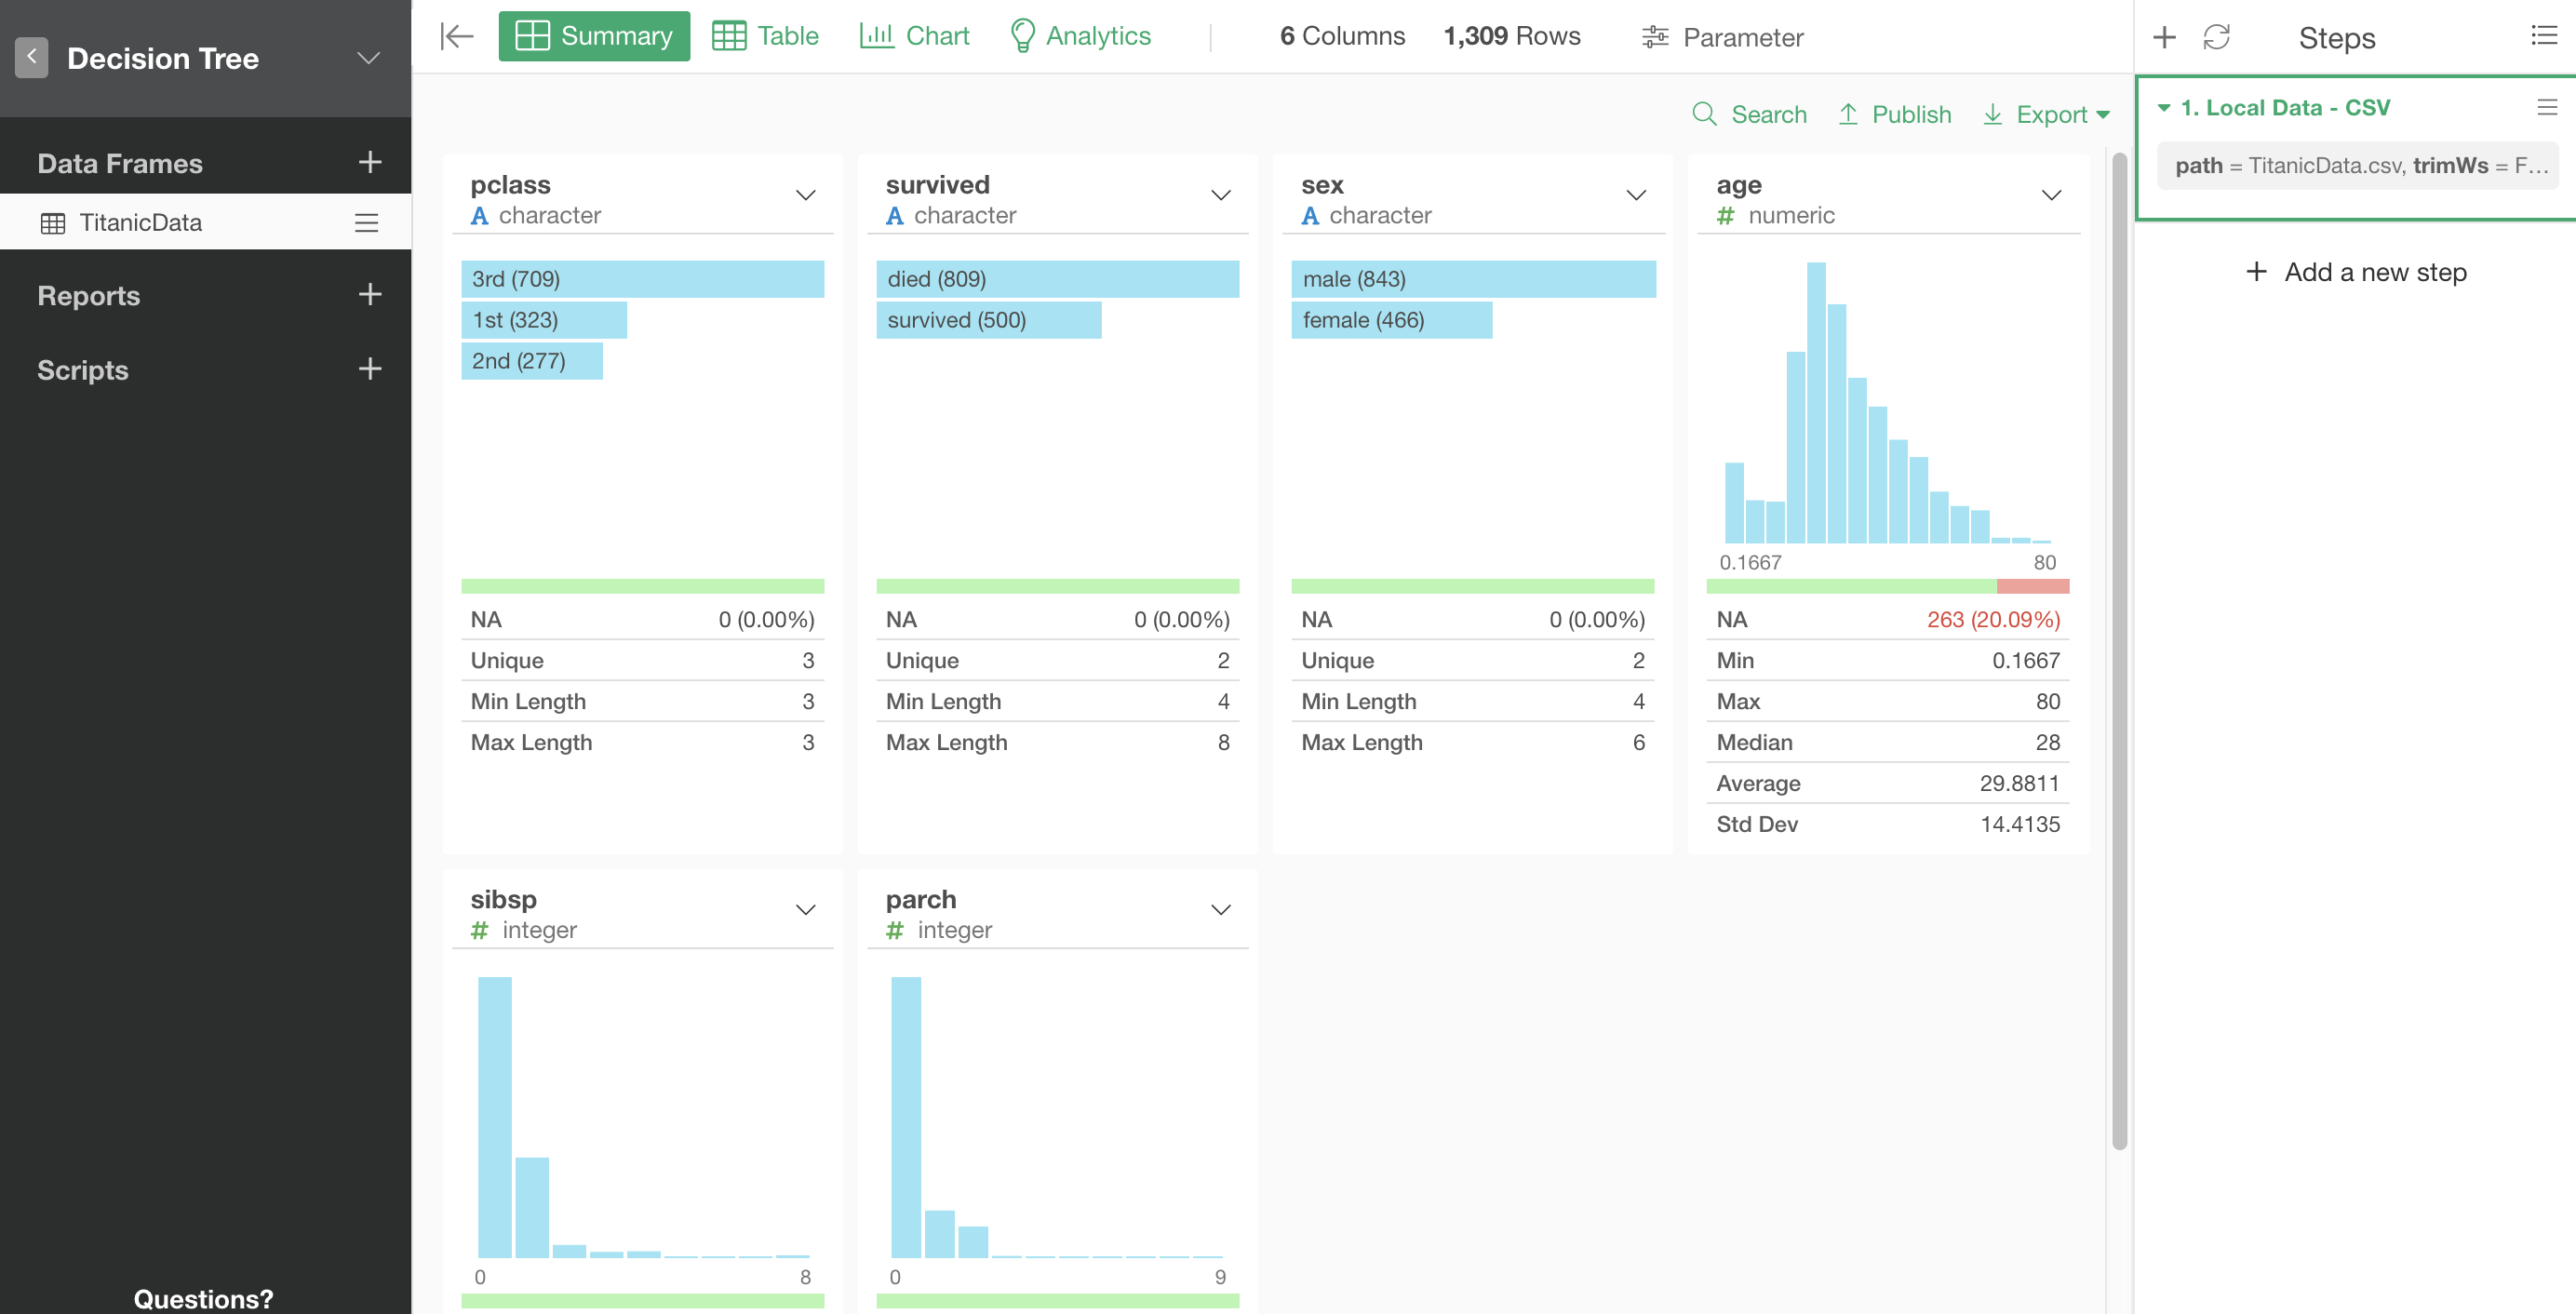
Once you are done with importing the data, you will see the data frame “TitanicData” is added to the project, and you see the summary of the data on the center of the screen.
Building a Decision Tree
Now the data is ready. Let’s create a Decision Tree with this data. Click the “Analytics” tab at the top of the screen to open the Analytics view. Select “Decision Tree” for Type, Choose “survived” column for “Target Variable”, and choose all the other columns for “Predictor Variable(s)”.
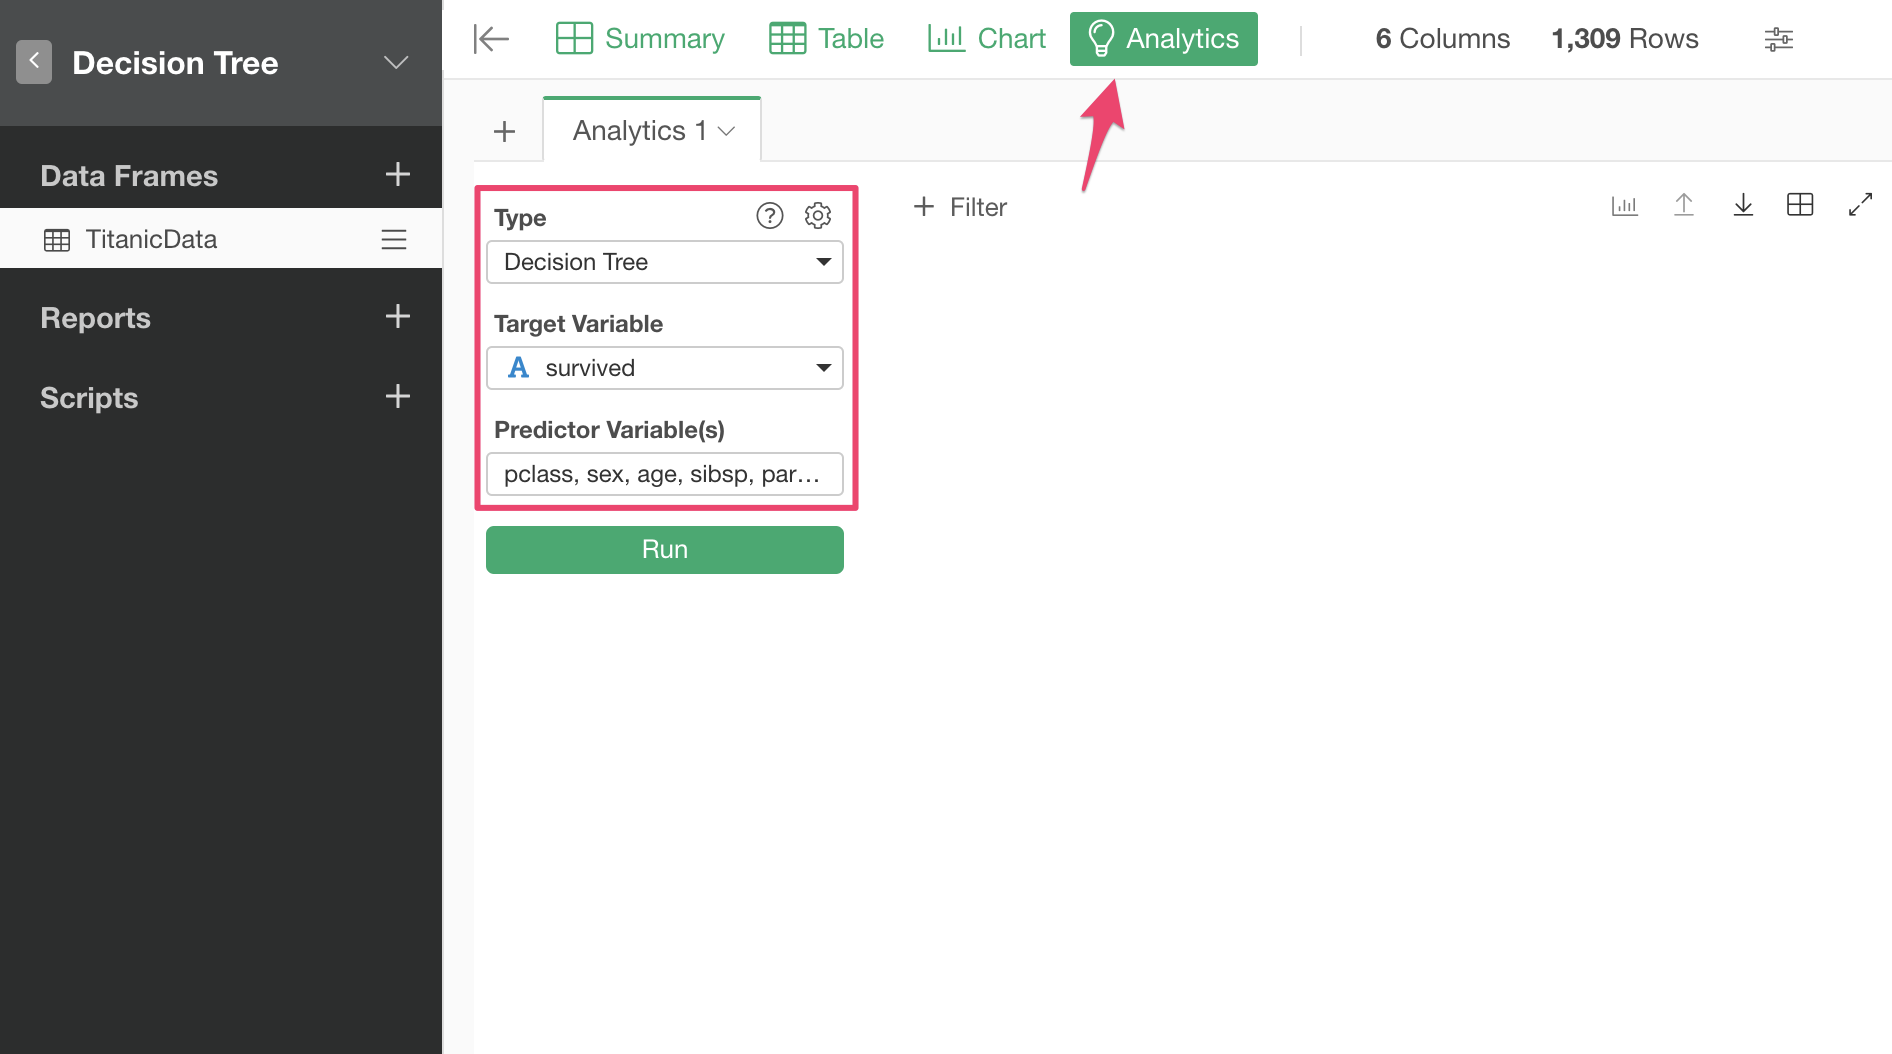
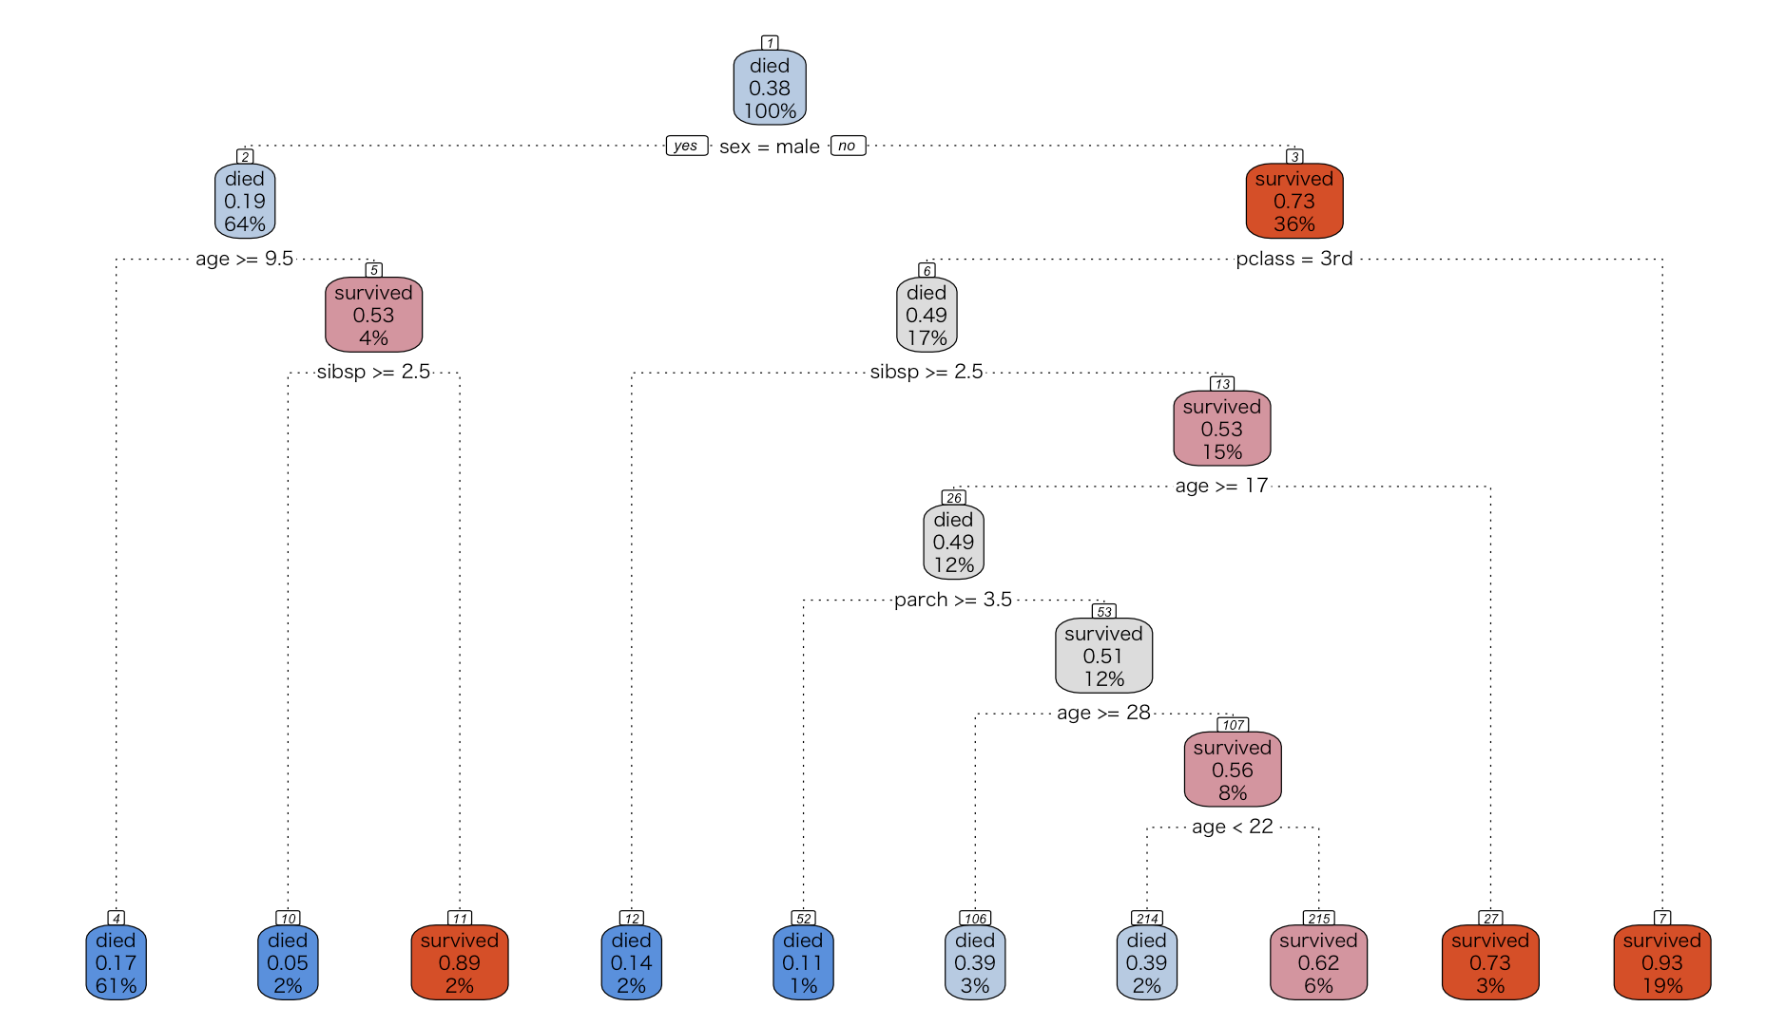
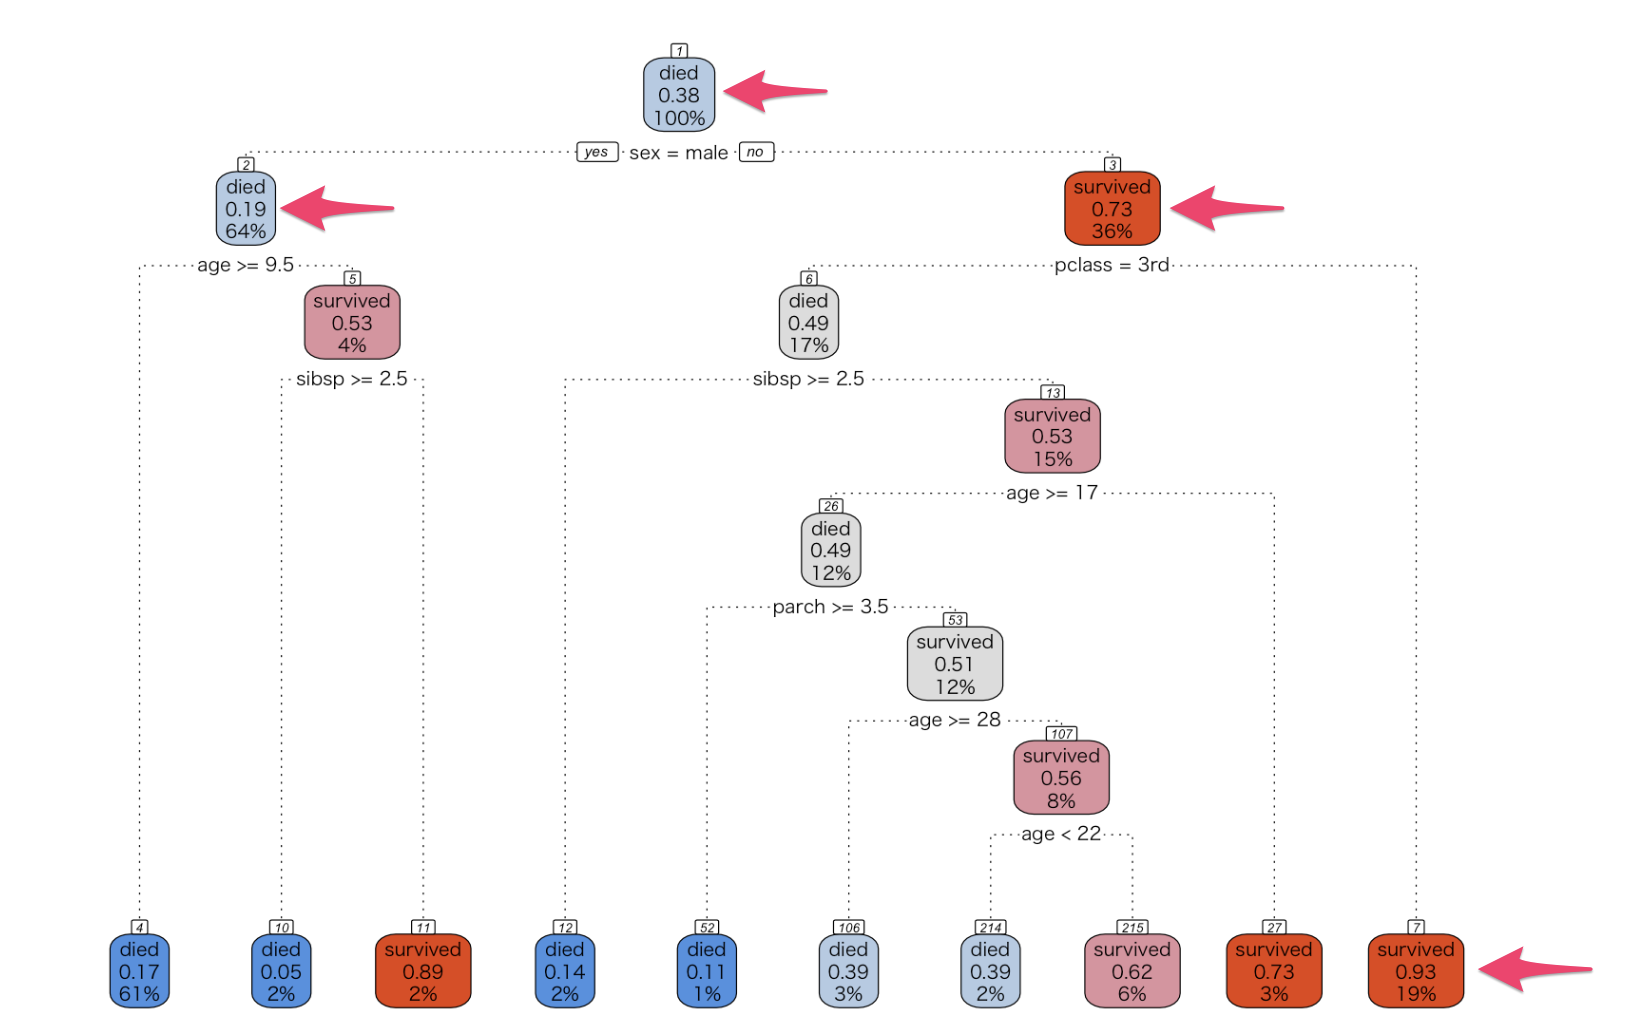
Click “Run” button to run the Decision Tree analytics. Once it’s done, you see the Decision Tree visualized.
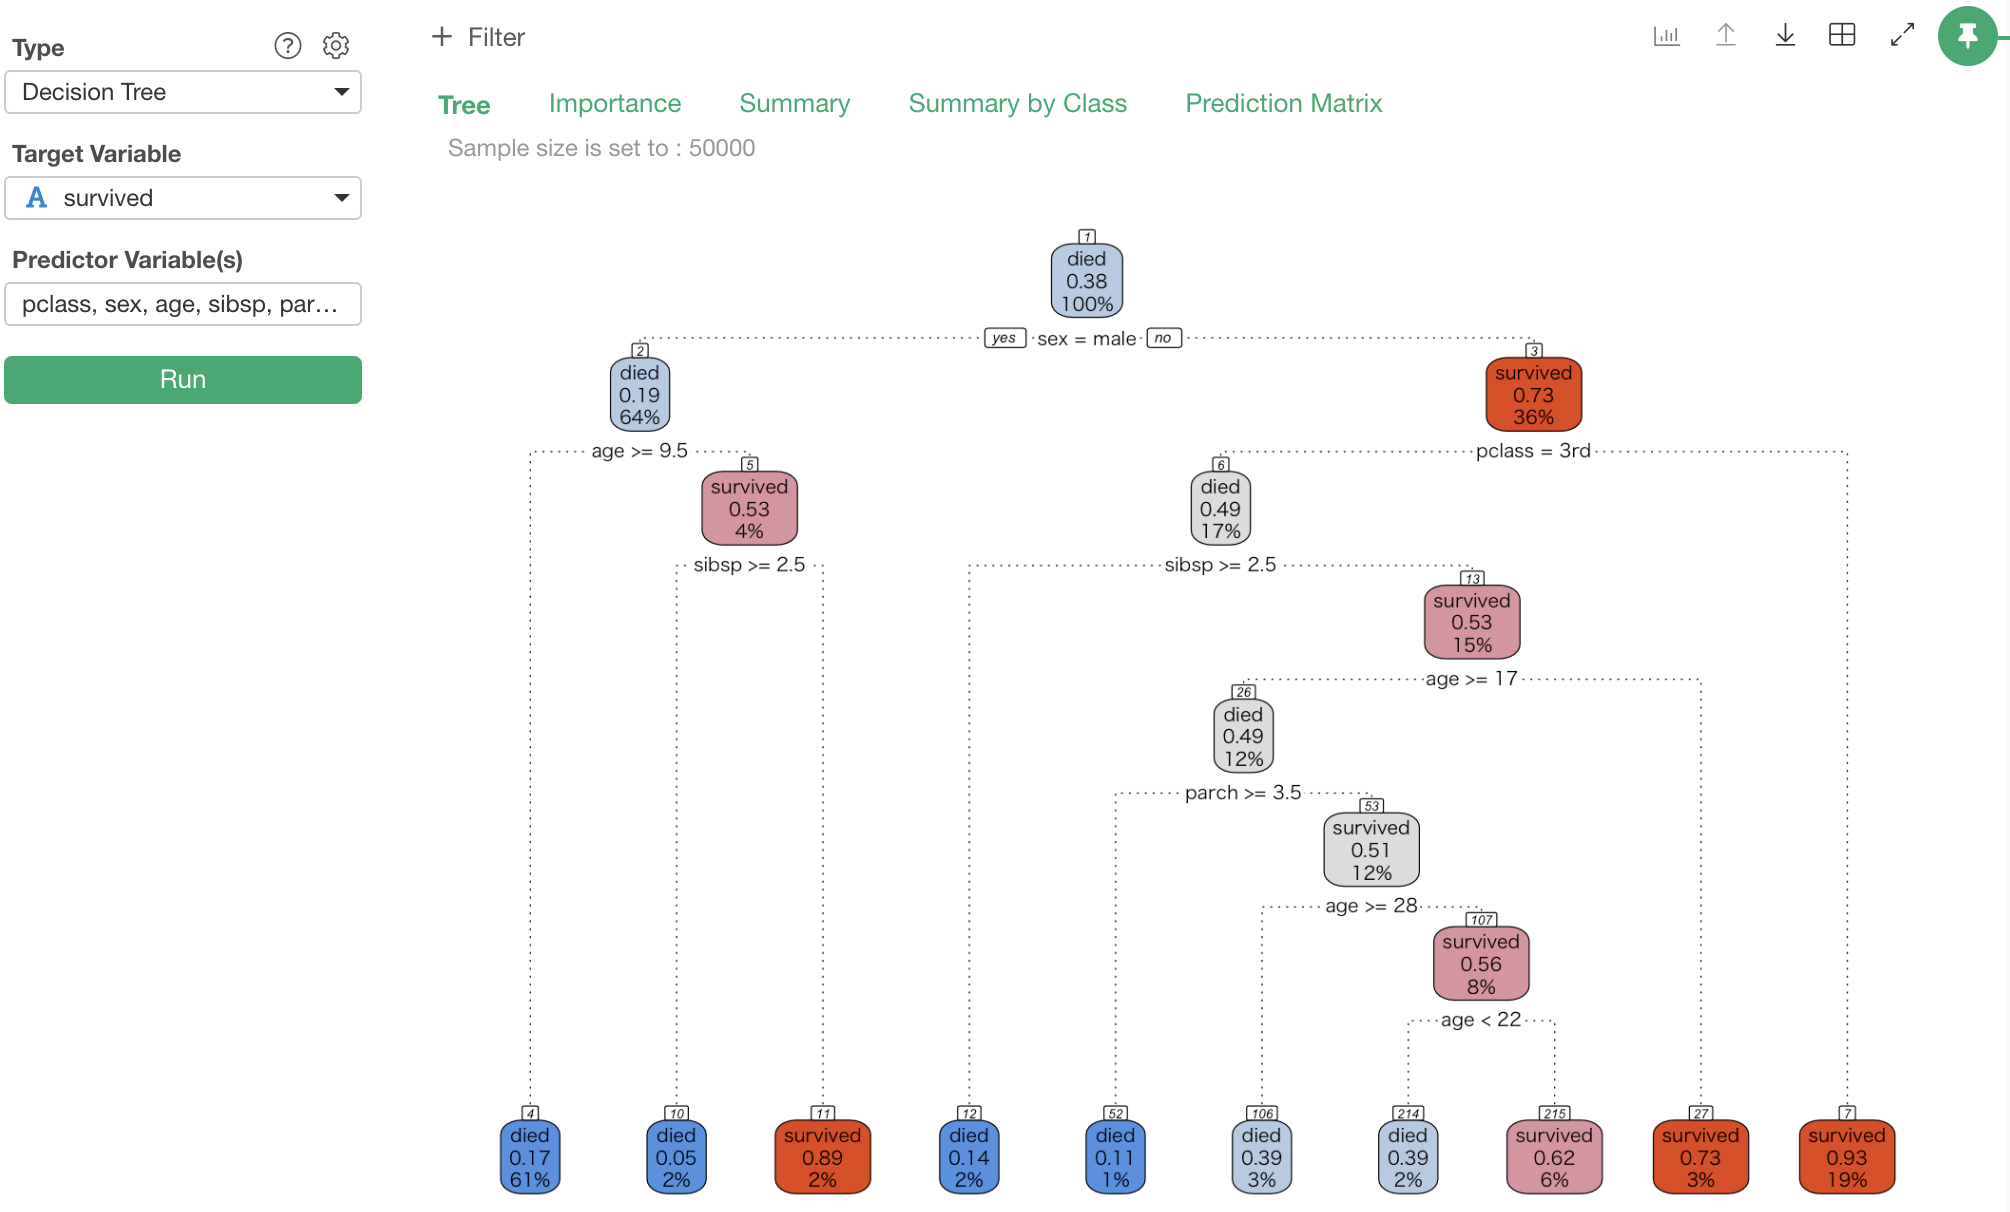
The Decision Tree rules run from the top to the bottom. If you look at the top of the tree, the 1st rule is “Sex is male or not”. “Yes” goes to the left hand side, and “No” goes to the right. If you look at the right box at the 2nd level, you can tell that the 36% of passengers were female, and if you are female, your survival rate is 73% (0.73). If you are male, chances are only 19%.
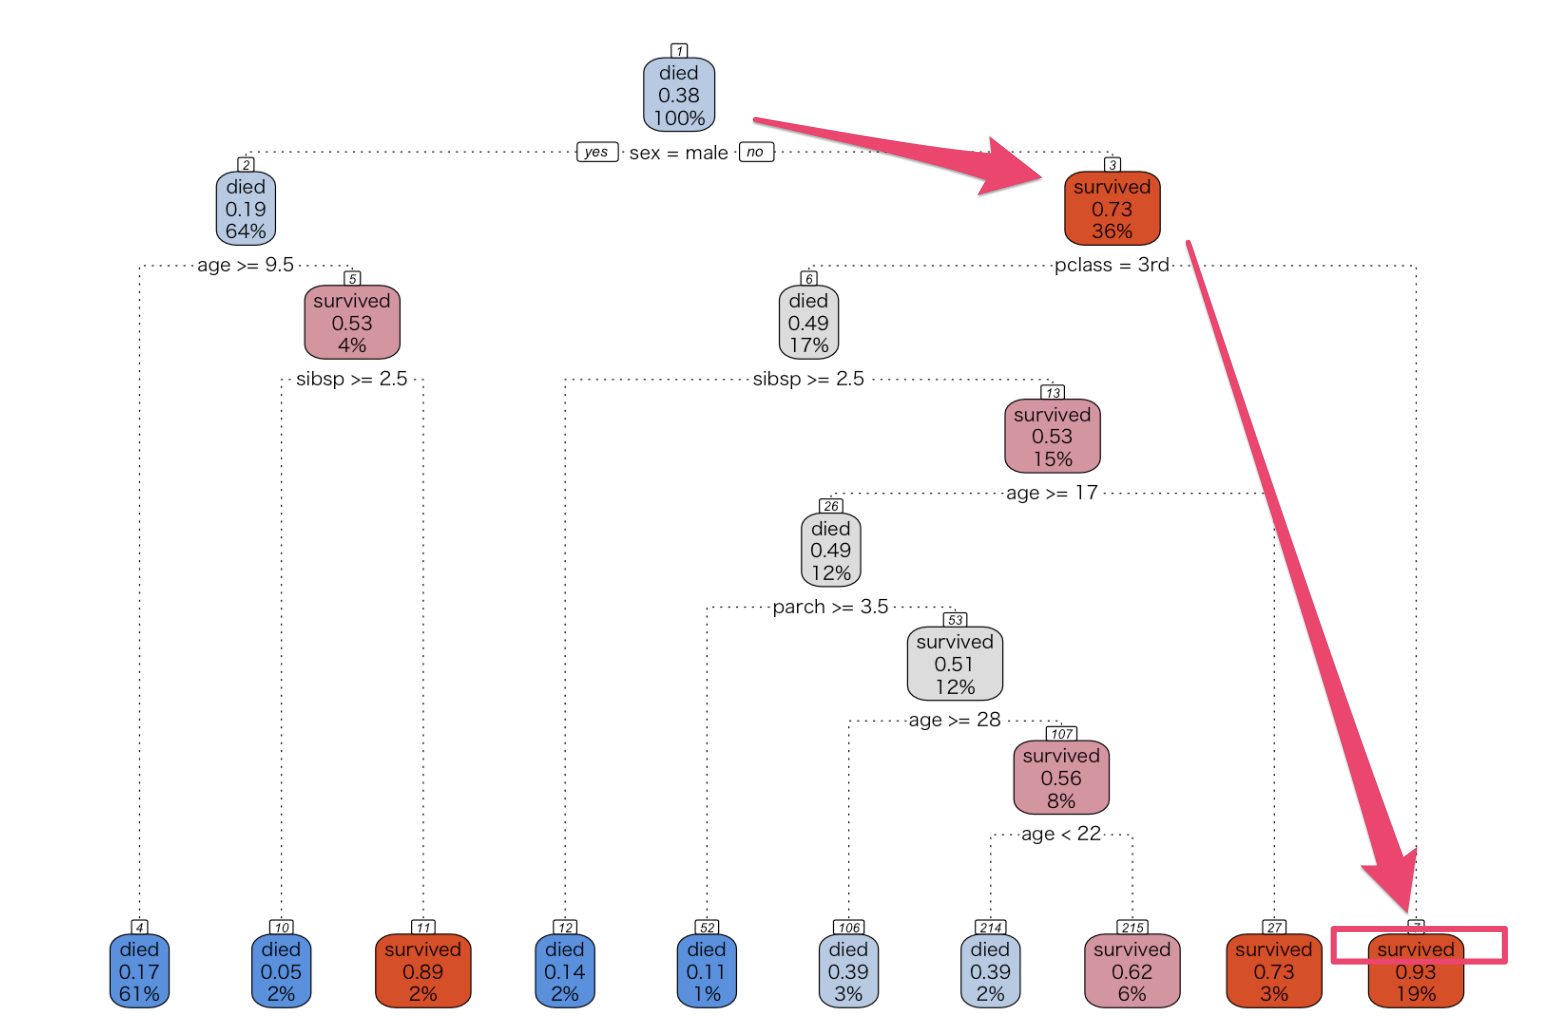
The next rule on the female box is “pclass is 3rd or not”. As we see, “No” goes to the right hand side, so if it is “No”, it comes down to the very bottom right box. If you are female and you are not in 3rd class seat (most likely you are in upper class seat such as 1st or 2nd class), your survival rate jumps to 93% (0.93).
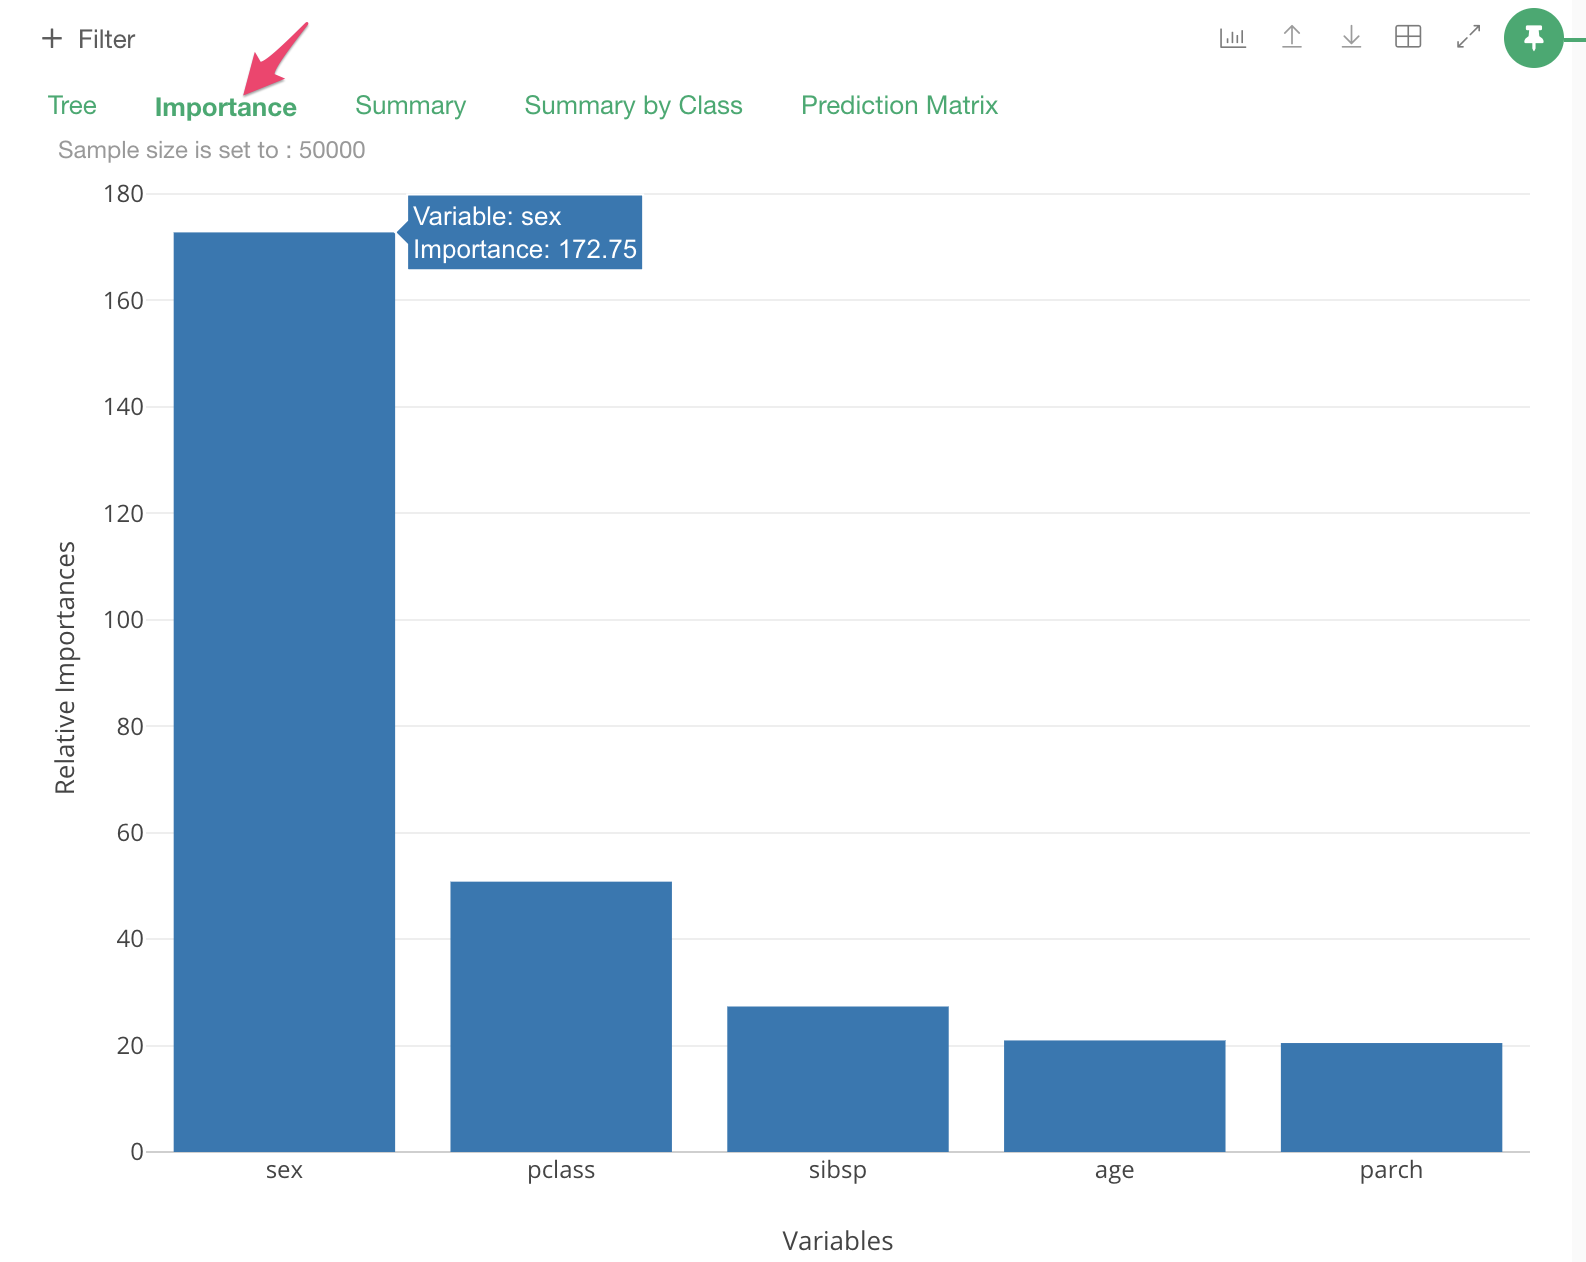
You can also get other various information about this Decision Tree model. For example, if you click “Importance”, how each variable affects the rules. In this case, “sex” variable affects the rules most.
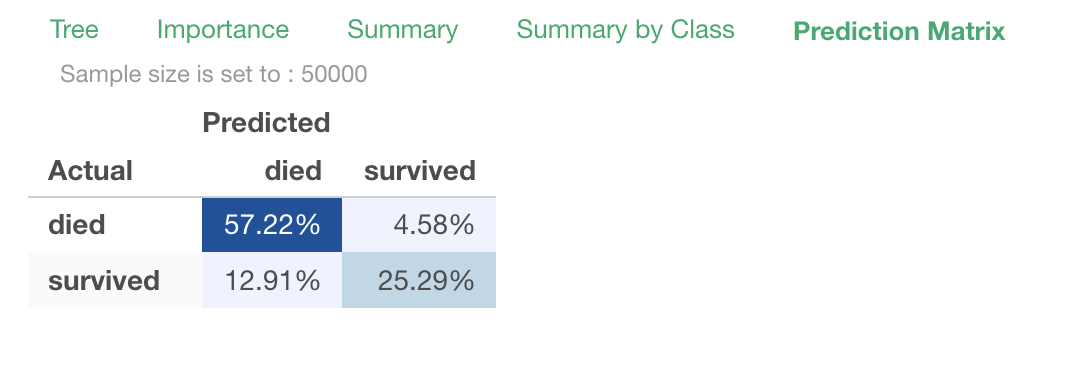
If you go to the “Prediction Matrix” view, you can see the quality of the model.
For example, if you apply the rules against a record “Female, 1st class seat, survived”, it comes to the bottom right box as we have seen above. And if you look at the box, it says “survived”. This is the prediction of the model. So, in this case, both the prediction and actual values are both “survived”.
The Prediction Matrix view is the result of this calculation against the entire data. If you sum up the ratios of correct predictions (cells where the prediction matches the actual value), this will be the quality of the model. In this case, it is 57.22 + 25.29 = 82.51%. This model can predict with more than 80% of the accuracy rate.
Summary
In Exploratory, you can build prediction models with more advanced machine learning algorithms like Random Forest etc. However, even though the Decision Tree algorithm is relatively simple and basic, it still provides a great explainability. Without any background in statistics or machine learning, you can understand what are the conditions to have the target outcomes by just looking at the tree diagram.
By using Analytics view in Exploratory, you can easily bring the power of Decision Tree to understand your data better.
Try It for Yourself!
If you want to try this out quickly, you can download the data from here, import it in Exploratory Desktop, and follow the steps.
If you don’t have Exploratory Desktop yet, you can sign up from here for 30 days free trial.
Learn Data Science without Programming

If you are interested in learning various powerful Data Science methods ranging from Machine Learning, Statistics, Data Visualization, and Data Wrangling without programming, go visit our Booster Training home page and enroll today!
If you are a current student, click here to get the student discount.