Assignment Networks
In this assigment you will analyze the conversation patterns in Perusall readings and videos.
Data
The data will be extracted from one reading (
Herodotou et al., 2019) and one video (Network Webinar). The CSV files are attached to the Assignment.
The CSV files have the following columns:
- Comment ID: Identifier for each comment
- Last name: of the author of the comment
- First name: of the author of the comment
- Student ID: Id of the student
- Submission: Text of the comment
- Type: Comment or Question
- Score: Perusall automatic score for the comment
- Created: Date of creation of the comment
- Last edited: Date of last modification of the comment
- Replies: How many replies the comment received
- Upvoters: How many upvotes the comment received
- Status: If it was before (on-time) of after (late) the deadline
- Document: document where the comment was made
- Part: Part of the document (usually 1) where the comment was made
- Page number: page where the comment was made (N/A for video)
- Range: Specific description of where the comment was made
Loading the Data in Exploratory
We will first load the data in Exploratory
- Import the CSVs into a new project in Exploratory (separator is a comma)
Data Wrangling
The only manipulation that we should do to the data is creating a column with the full name of the author of the comment.
For EACH ONE of the two datasets do:
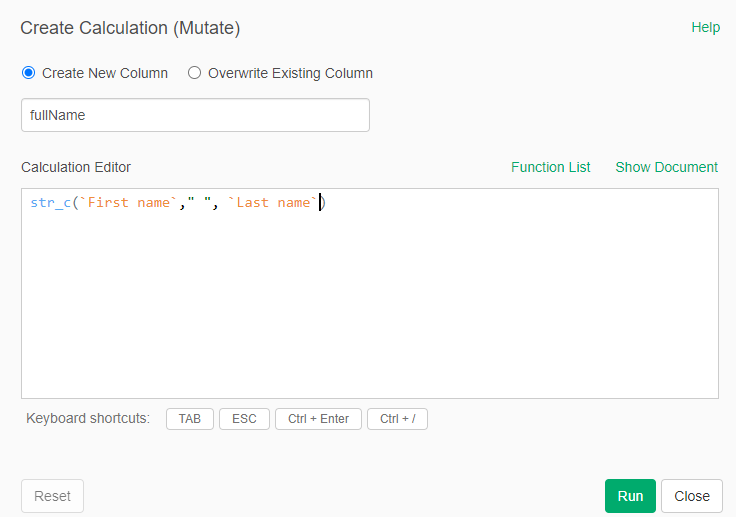
- Go to First Name and select the actions for the column. Select "Work with Text Data" -> "Conactenate (Add) Text"
- Select "Create a New Column" with name "fullName"
- In the Calculation write "str_c("First name", " ", "Last name"). That will join the first and last name with a space in between.
Creating the Nodes File
We know that we need to create a nodes file to create our network. In this files we want to have the id of the author (its full name), the total number of messages that the author posted, the total number of replies received, and the total number of upvotes received.
For EACH ONE of the two datasets do:
- Branch the dataset after the creation of the fullName column into a new dataset called "nodes_reading" for the reading and "nodes_videos" for the video
- Go to the new "nodes_xxxxx" dataset
- Summarize grouping by fullName. The values should be Number of Rows, Replies, and Upvoters
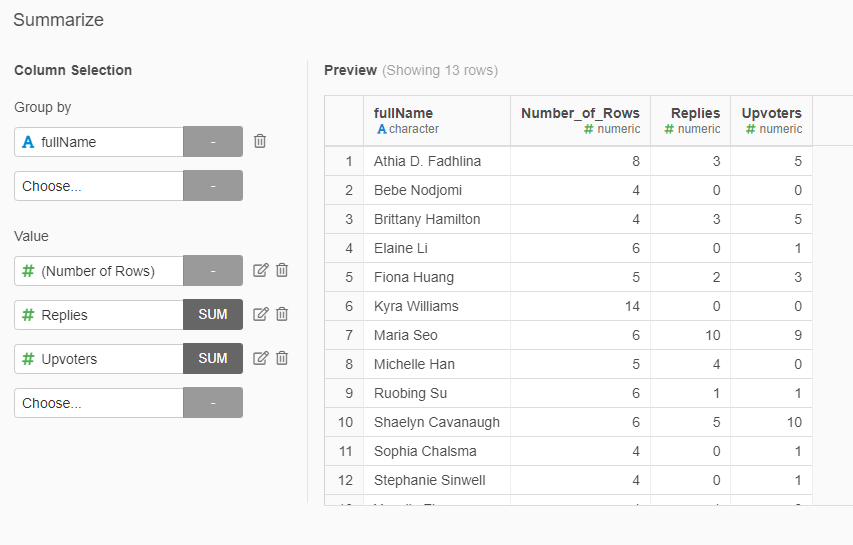
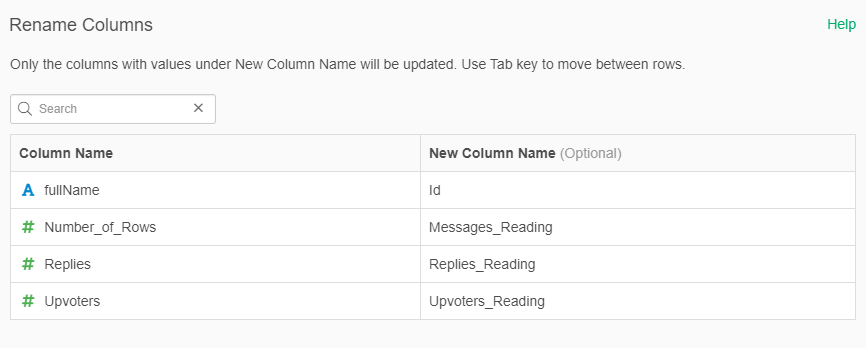
- Rename the columns to "Id", "Messages_Xxxx", "Replies_Xxxx", "Upvotes_Xxxx". Xxxx should be "Reading" or "Video" depending on which dataset are you working.
Create Links files
We want to create a link between all the authors that created a comment in the same section of the reading. For this we can use a trick with the Join function.
For EACH ONE of the two datasets do:
- Branch the dataset after the creation of the fullName column into a new dataset called "links_reading" for the reading and "links_videos" for the video
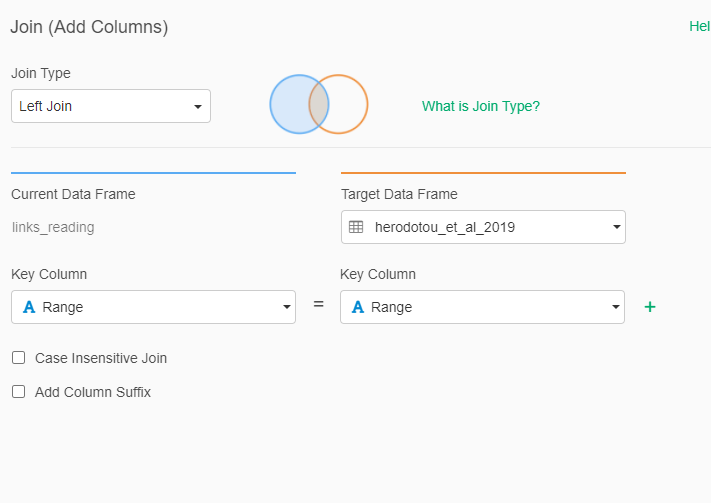
- Do a left join with the original dataset merging by the "Range" variable (the place where the comment was made)
Select only the columns fullName.x and fullName.y
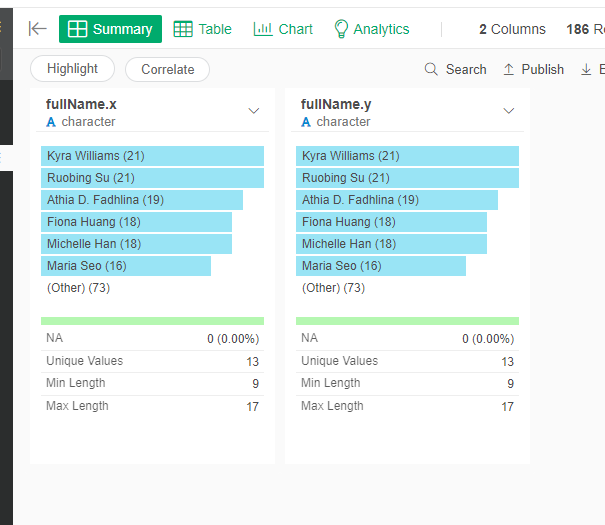
Rename the columns fullName.x to "Source" and the fullName.y to "Target"
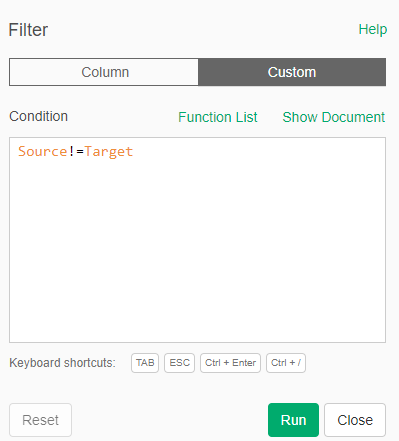
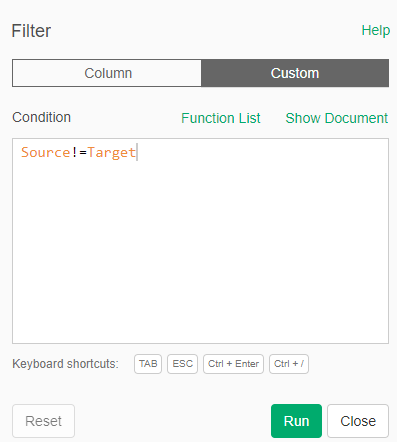
- Filter the rows in which Source is equalt to Target (self-loops). For this, Filter, go to Custum and put "Source != Target", meaning where Source is different from Target.
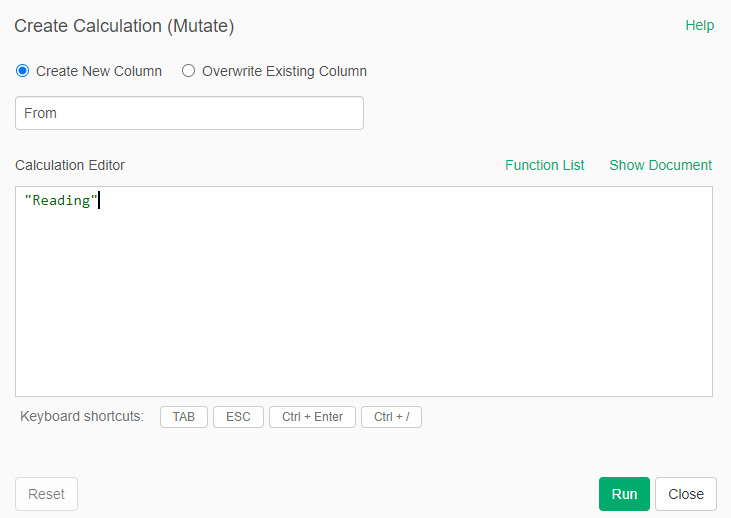
- Create a new column (Create Calculation (Mutate)) with the value "Reading" for the reading dataset, and "Video" for the video dataset
Exporting the Data to Gephi
To be able to open the data in Gephi, we need to export our nodes and links files to CSV again
For EACH ONE of the FOUR new datasets (nodes_reading, links_readings, nodes_video, and links_video) do:
- Go to the last step in the dataset and click on "Export"
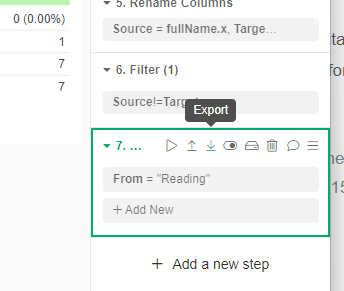
- Select "Export Data as CSV" and select "Comma (,)"
- Save the file with the same name as the dataset (for example, "nodes_reading.csv"
Loading the Data in Gephi
Now we want to load the data in Gephi to analyze the difference between the networks of comments created during the reading and during the video.
- Open Gephi and create a new project
- Go to the Data Laboratory
For EACH ONE of the nodes files:
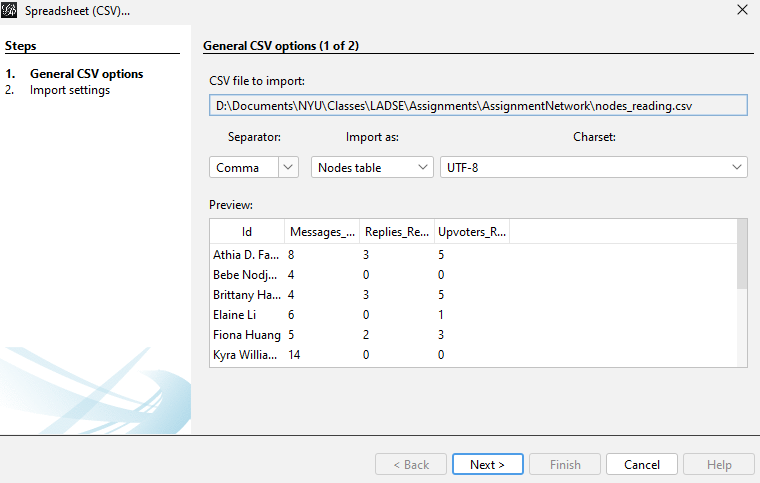
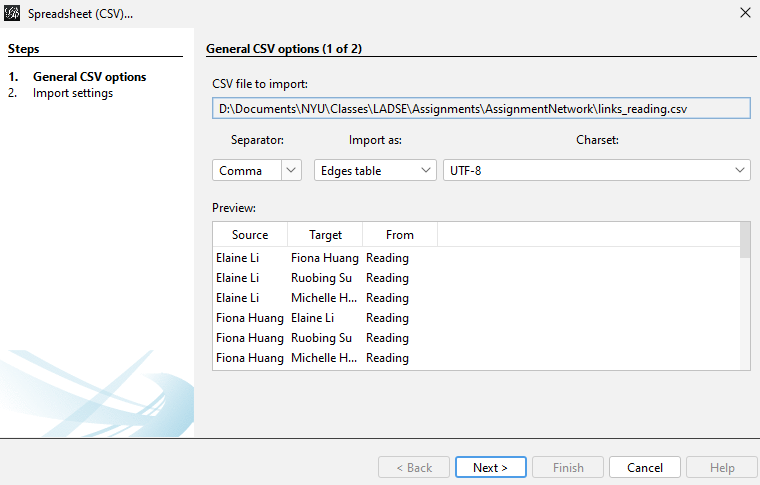
- Click on Import Spreedshet, click on your "nodes_xxx.csv" file
- Check that the data is correct and click "Next"
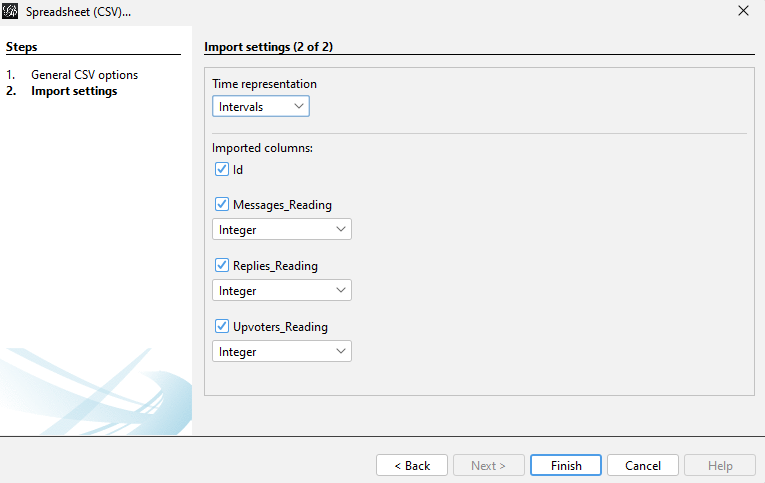
- Check that the type of the data is ok and click on "Finish"
- In the next window, you have to make sure that Graph Type is set to "Undirected" and that "Append to existing workspace" is selected. Click OK
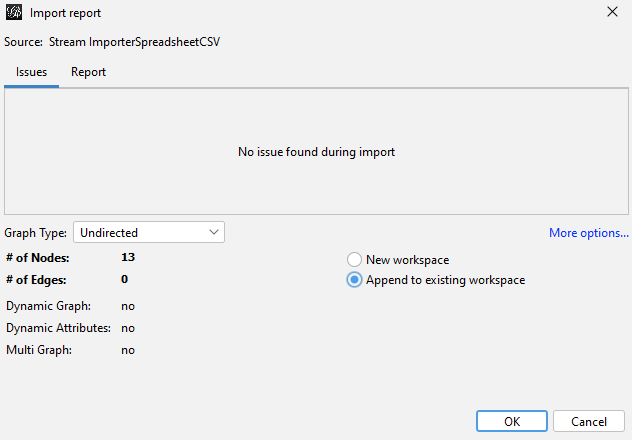
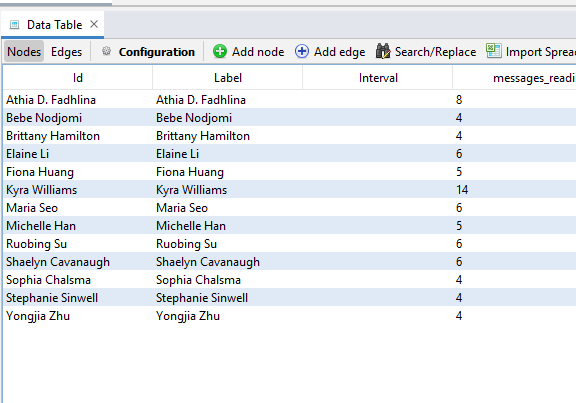
If you do this to both datasets, you have now a list of 13 nodes with the names of the participants in those discussions.
Let's convert add the label column by copying the Id Column to the Label
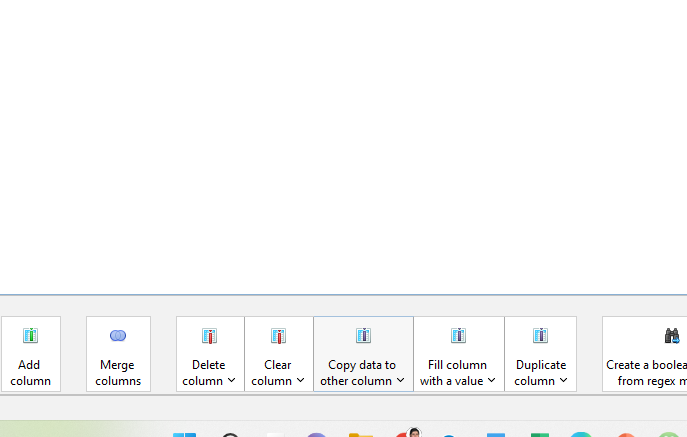
- Click on the "Copy data to other column" button at the bottom of the Data Laboratory
- Select "Id" and then Copy to: "Label"
Now we will calculate the total number of Messages, Replies and Upvotes from both reading and video.
For EACH ONE of the columns (Messages, Replies, Upvotes) do:
- Click on the button "Merge columns" on the bottom of the Data Laboratory
- Select the two corresponding columns (for example: messages_reading and messages video.
- In "Merge strategy" select "Sum number values"
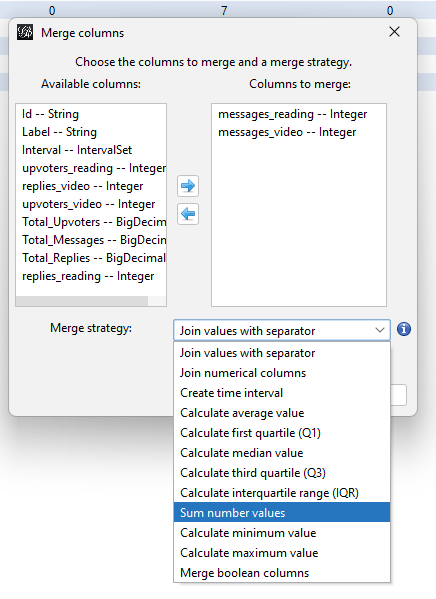
- Click Ok and Set the name of the new column to "Total_XXX", for example "Total_Messages"
Now we will import the link tables
- Click on Import Spreedshet, click on your "files_xxx.csv" file
- Check that the data is correct and click "Next"
- Check that the types are right and click "Finish"
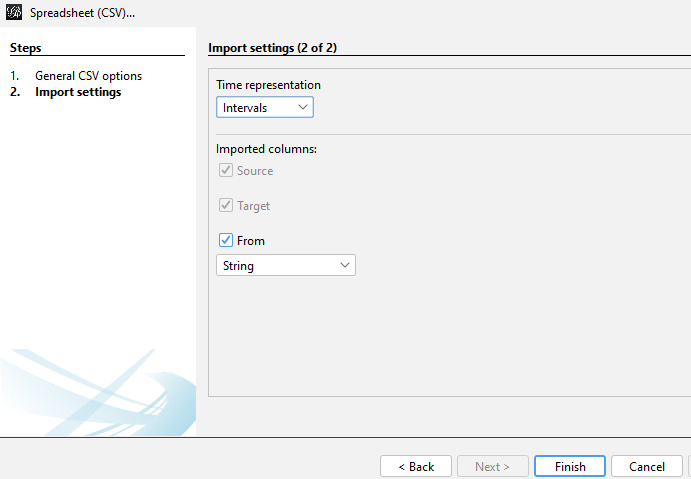
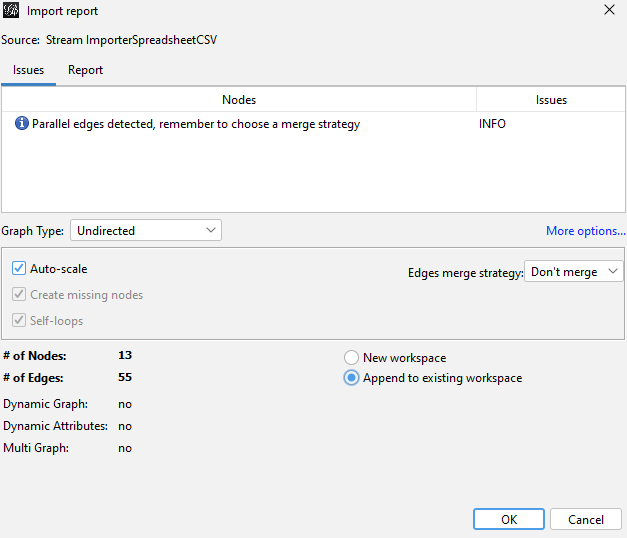
- In the following screen click on More options...
- Make sure that the Graph type is set to "Undirected" the Edge merge strategy is set to "Don't merge" and the "Append to existing workspace" is selected.
- Click Ok
Visualizing your Network
Use Gephi to create the following representations:
Reading network: A network where only the Reading links are visible. The size of the nodes is determined by the number of messages in the reading and the color of the nodes is given by the number of replies received.
Video network: A network where only the Video links are visible. The size of the nodes is determined by the number of messages in the video and the color of the nodes is given by the number of replies received.
Total network: A network where all the links are visible and The size of the nodes is determined by the total number of messages and the color of the nodes is given by the total number of replies received.
Notes:
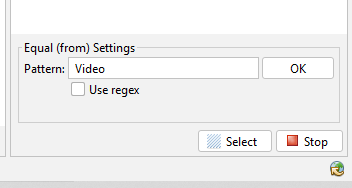
- To only show one type of links you need to filter. You do that going to the right hand side of Gephi in the Overview window and selecting the Fitler tab. Then you select Attributes -> Equal -> from String(Edge). You drag this to the Queries panel below.
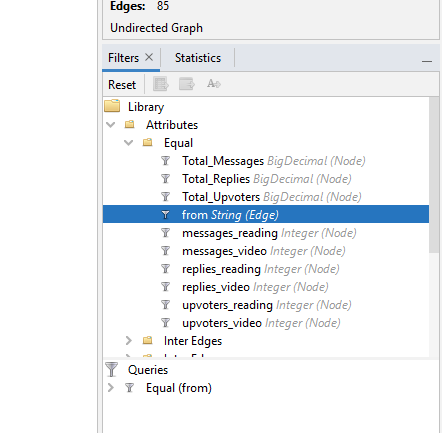
Then you set the pattern that you want to see (Recordings or Video). You click Ok and make sure that it is running.
Analysis and Report
Based on the visualizations that you have created of the network, you need to create a report that explain the differences (or lack of differences) between the conversation patterns in the reading vs. the video week. You should post the link to the report as answer to the assignment.
Notes:
You can include graphs that are not part of Exploratory by copying them and pasting them into the report text.
You can use wathever layout for the network that you think is better to explain your points.