Market Basket Analysis
Top 40 best selling items
Loading...
Interactive Scatter Plot
Loading...
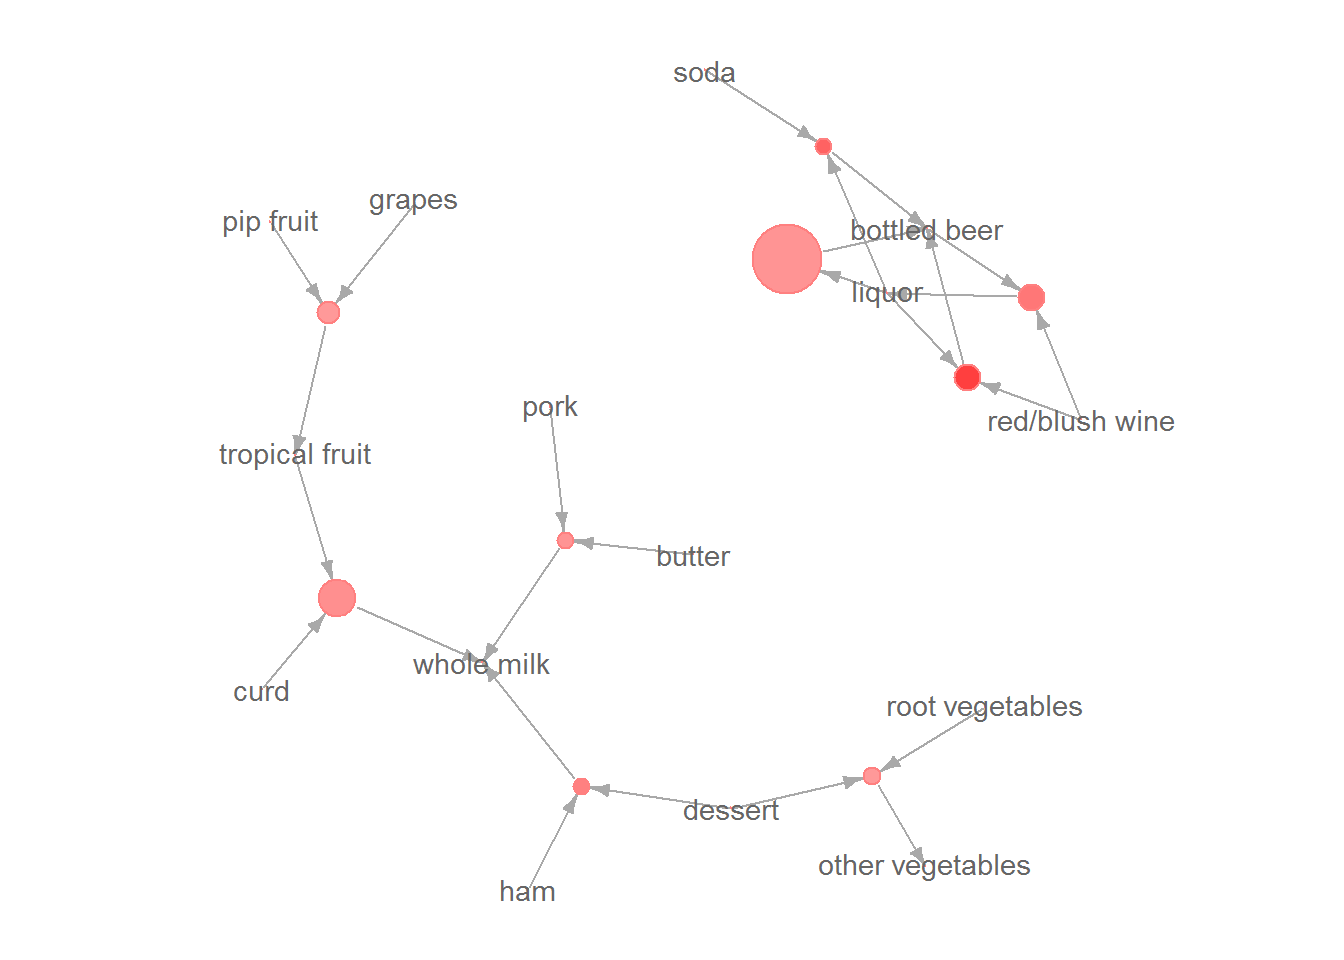
Network Diagram
# Give names to the rules. groceries is the dataframe that is the result of the Market Basket Analysis.
rules <- Data_for_Market_Basket_Analysis %>% mutate(rule = row_number(), rule = str_c("Rule ",parse_character(rule)))

# Create a dataframe for the relationships from rules to right-hand side products.
rule_rhs_edges <- rules %>%
  select(rule, rhs) %>%
  rename(from = rule, to = rhs)

# Create a dataframe for the relationships from left-hand side products to the Rules.
lhs_rule_edges <- rules %>%
  separate_rows(lhs, sep = "\\s*\\,\\s*") %>%
  select(lhs, rule) %>%
  rename(from = lhs, to = rule)

# Create a dataframe for all the relationships in the graph by binding the above 2 dataframes.
edges <- lhs_rule_edges %>%
  bind_rows(rule_rhs_edges)

require(igraph)
# Set random seed for reproducibility of the chart.
set.seed(0)

# Create a graph object
g <- graph.data.frame(edges, directed=TRUE)

# Function to get support for circle in the graph.
v_to_support_map <- setNames(rules$support*4000, rules$rule)
v_to_support <- function(name) {
  if_else(name %in% names(v_to_support_map), v_to_support_map[name],0)
}

# Function to get lift for circle in the graph.
v_to_lift_map <- setNames(rules$lift, rules$rule)
v_to_lift <- function(name) {
  if_else(name %in% names(v_to_lift_map), v_to_lift_map[name],0)
}

# Function to get confidence for circle in the graph.
v_to_confidence_map <- setNames(rules$confidence, rules$rule)
v_to_confidence <- function(name) {
  if_else(name %in% names(v_to_confidence_map), v_to_confidence_map[name],0)
}

# Set color based on confidence
c_scale <- colorRamp(c('white','red'))
V(g)$color <- apply(c_scale(v_to_confidence(V(g)$name)), 1, function(x) rgb(x[1]/255,x[2]/255,x[3]/255, alpha=0.8) )

# Do not display name of rules
modify_label <- function(x) {if_else(str_detect(x,"^Rule "), "", x)}
labels <- modify_label(V(g)$name)

# Plot the graph
par(mar=c(0,0,0,0))
plot(g, edge.arrow.size=0.5, vertex.size=v_to_support(V(g)$name), vertex.label=labels, vertex.label.family="sans", vertex.label.color=rgb(0.4,0.4,0.4), vertex.label.cex=0.9, vertex.frame.color=rgb(1,0.5,0.5))