Total Network Overview
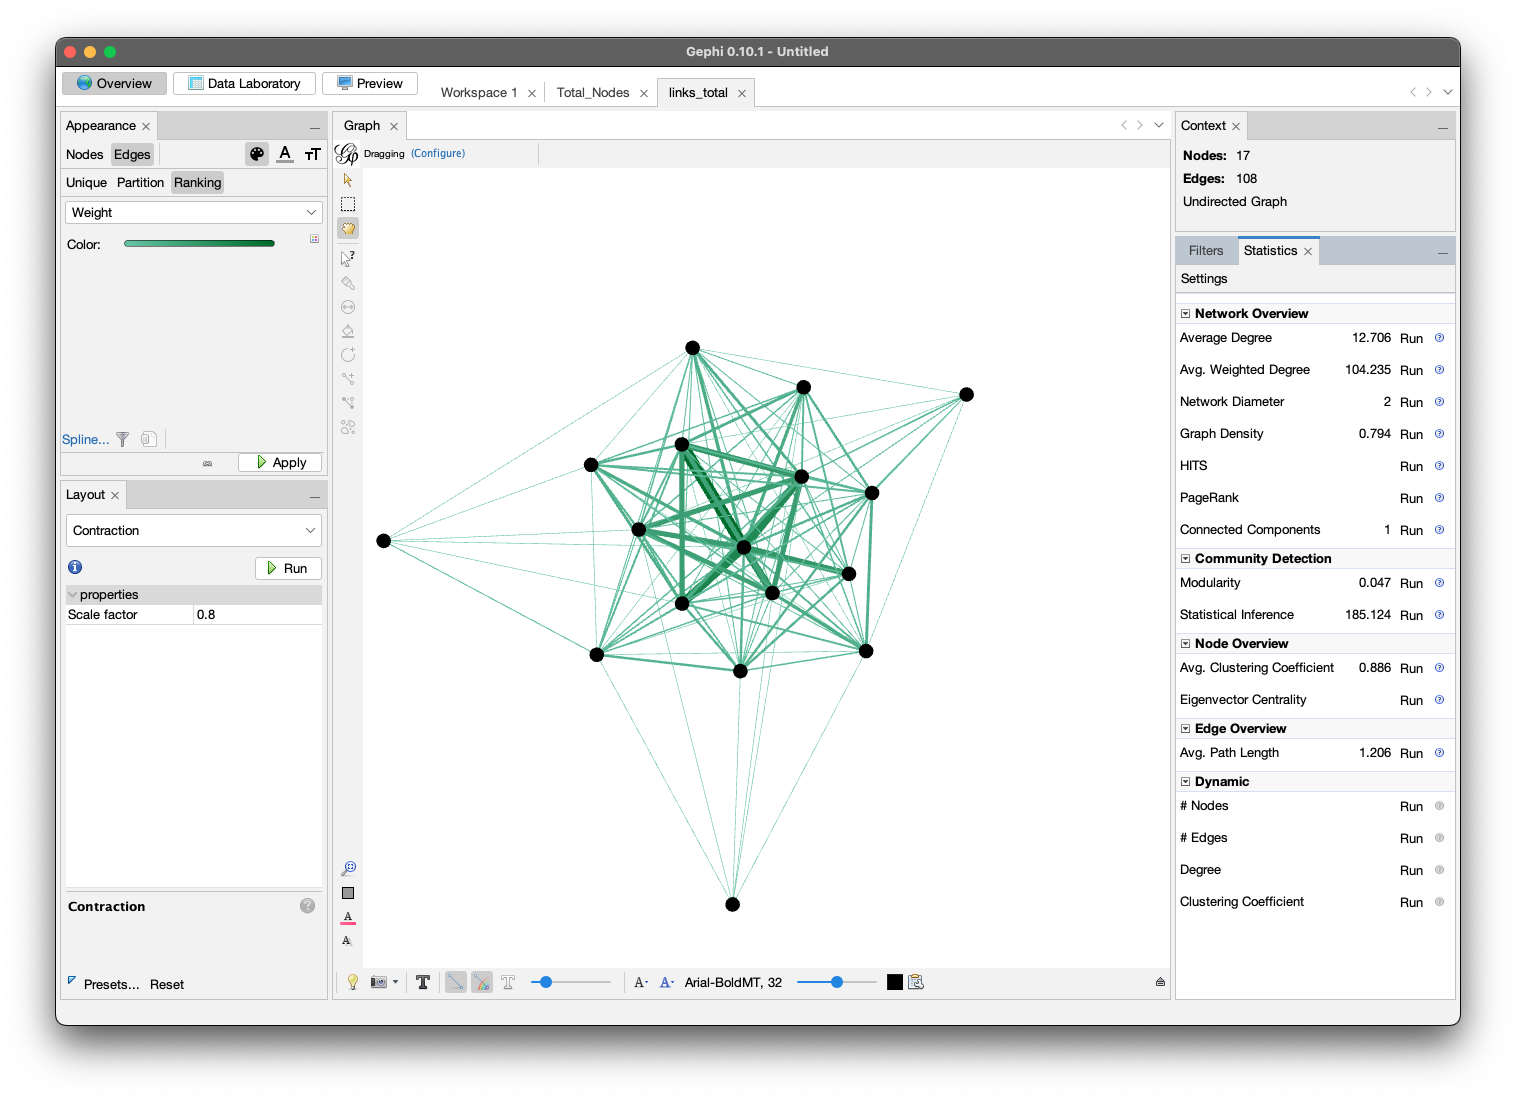
This total network graph represents student comment activity across all Perusall readings. Nodes represent students, and edges indicate that two students posted comments within the same textual segment (Range). The network is visualized using the Contraction layout in Gephi.
Key Metrics
- Nodes: 17
- Edges: 108
- Graph Density: 0.794 → This is a highly dense network, meaning students often co-commented on the same segments.
- Average Degree: 12.706 → On average, each student is connected to about 13 others, suggesting broad engagement.
- Network Diameter: 2 → The longest shortest path between any two students is only 2 steps, indicating tight integration.
- Modularity: 0.047 → Very low modularity, showing no strong subgroups or cliques formed; students engaged across readings rather than forming silos.
- Clustering Coefficient: 0.886 → Students who interact with the same peers tend to be closely interconnected, forming a highly collaborative environment.
- Average Path Length: 1.206 → Any student can reach another in just over one step, showing efficient discussion connectivity.
Participation Insights
- The network clearly centers around a core group of highly active students, as seen in the dense central cluster of large and deeply colored nodes.
- Peripheral nodes (e.g., students placed at the outer edges) likely participated less frequently or only in specific readings.
- Notably, the even spread of connections and low modularity suggests no isolated subgroups, implying a cohesive classroom discourse structure.
Benoit, 2019
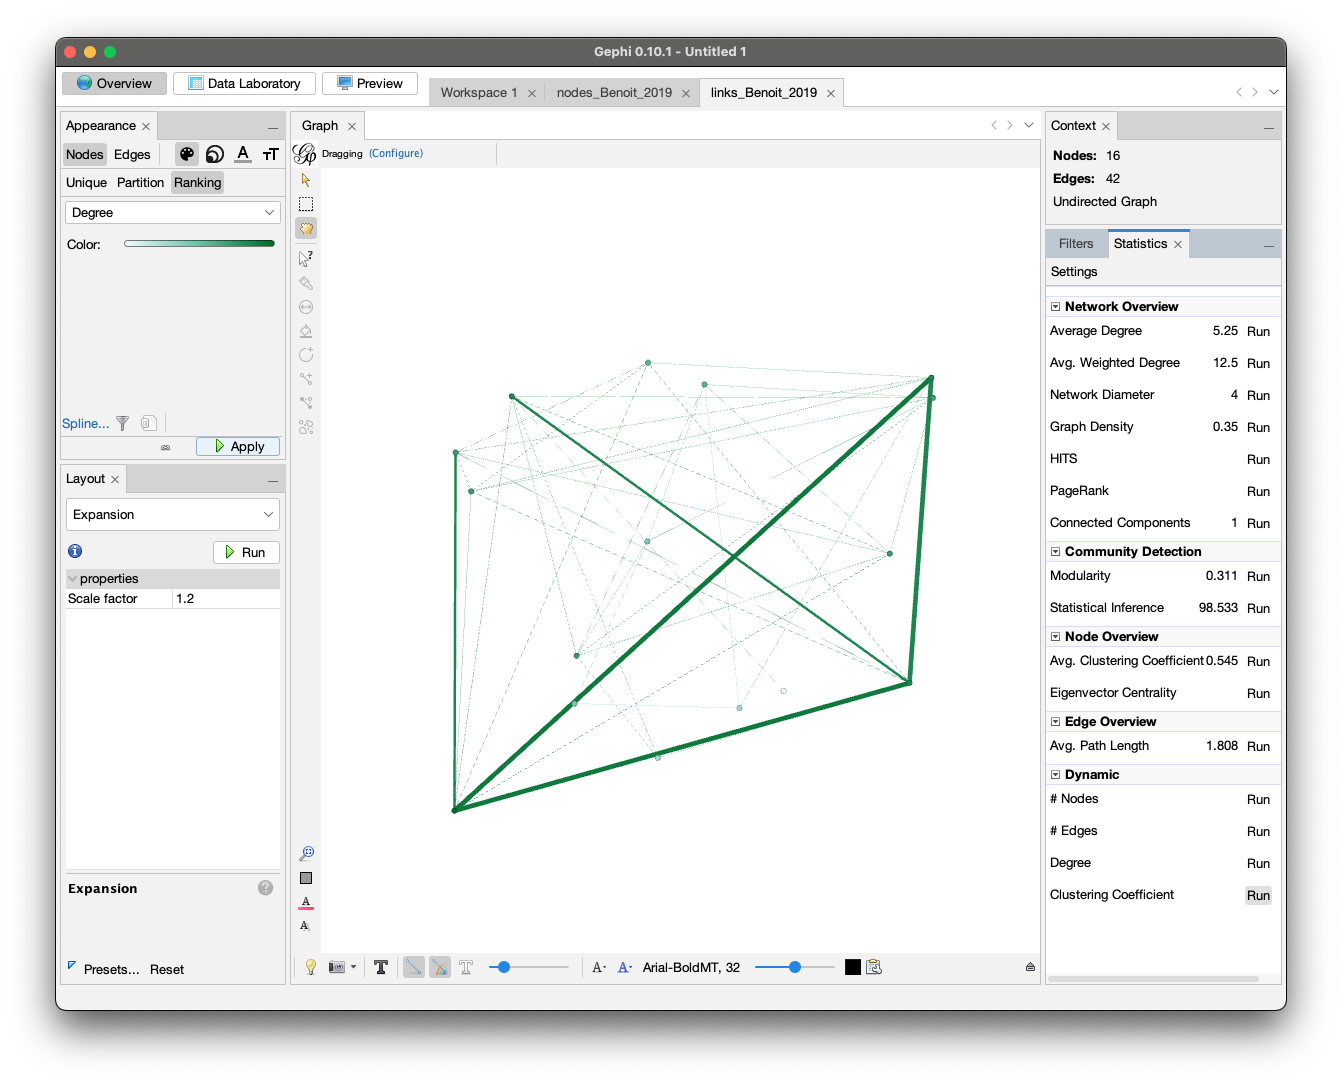
The discussion network for Benoit, 2019 includes 16 students and 42 edges, forming a moderately connected graph. The visualization reveals a mix of centralized and peripheral participation, where a few students contributed heavily while others had limited co-commenting interactions.
- The graph density is 0.35, indicating moderate overall interaction—students often commented in overlapping text segments but not universally so.
- The average degree is 5.25, meaning each student interacted with around 5 others on average.
- The network diameter is 4, suggesting some longer paths between less connected participants.
- Modularity is 0.311, which implies that some weakly defined clusters or subgroups exist—possibly representing topic-based or time-based participation patterns.
- The average clustering coefficient of 0.545 suggests a fair amount of local cohesion, with some students forming tightly connected triads.
Visually, the network reveals a handful of prominent hubs (larger and darker nodes) who likely commented in highly active or widely viewed segments. Meanwhile, several nodes at the corners suggest students with more limited interaction scope.
Compared to denser reading weeks, Benoit, 2019 demonstrates a partially integrated network—there is collaboration, but also noticeable fragmentation in participation patterns.
Brooks, 2017
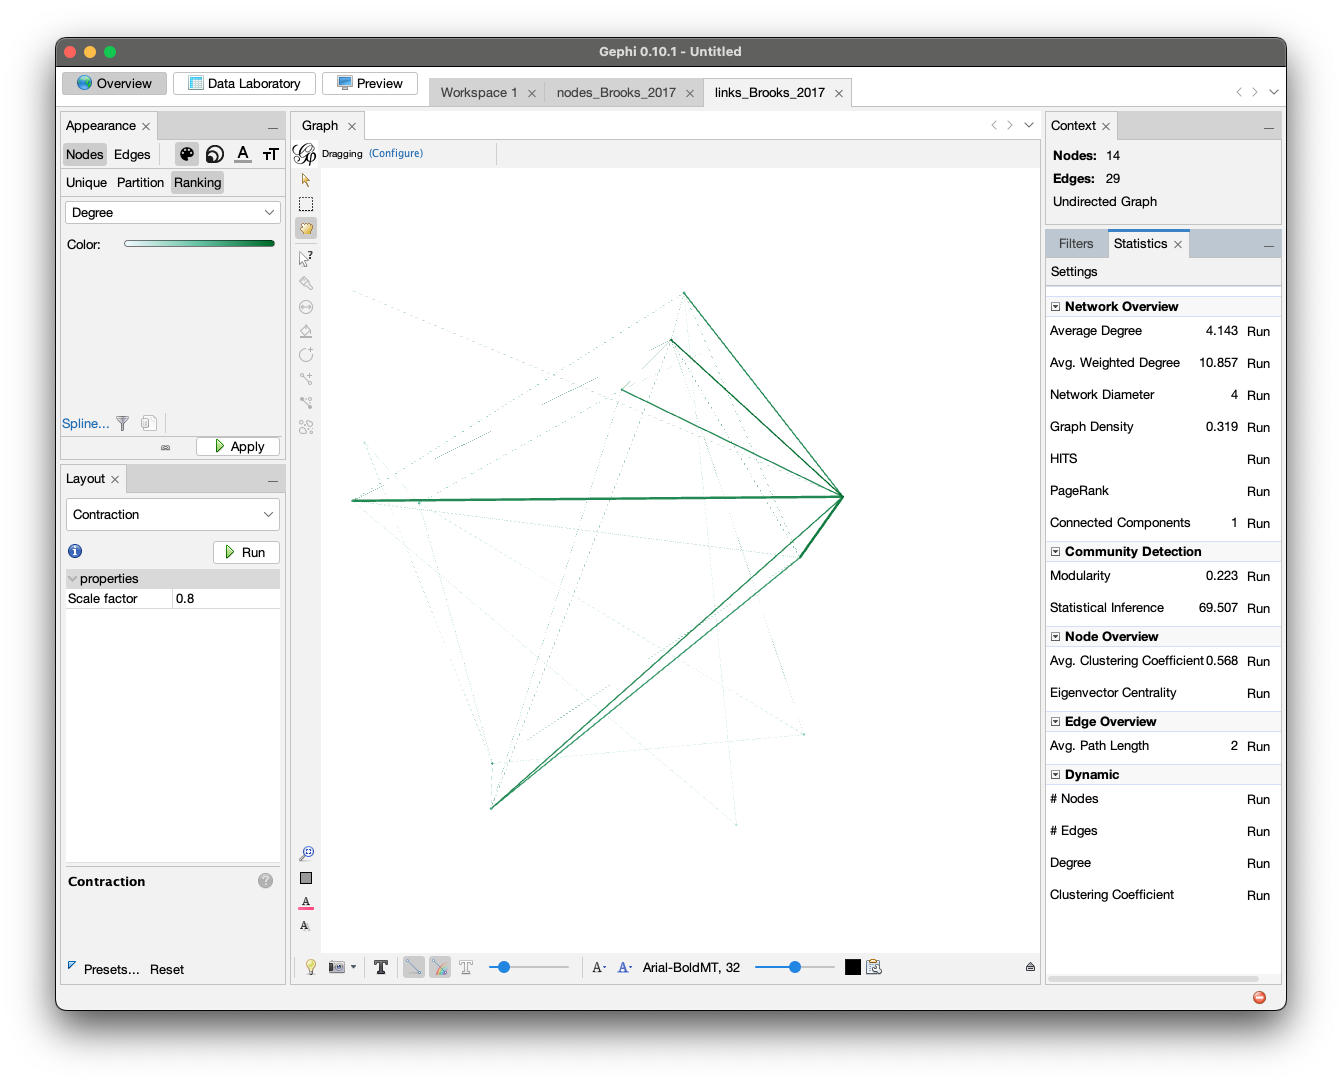
The network graph for Brooks, 2017 illustrates comment interactions among 14 students, forming 29 connections based on co-commenting behavior. Compared to denser reading weeks, this network appears sparser and more centralized, with a noticeable hub structure.
Key Metrics
- Average Degree: 4.143
- Graph Density: 0.319
- Network Diameter: 4
- Modularity: 0.223
- Avg. Clustering Coefficient: 0.568
- Average Path Length: 2
Interpretation: the graph shows one or two dominant participants at the center (likely those who commented across multiple segments), while several other students remain at the periphery with limited connections. The relatively low density and longer diameter suggest that participation was uneven—students may have focused on isolated parts of the reading or posted independently. The modularity score of 0.223 hints at the formation of small, weakly separated clusters, possibly due to topic-specific interest or timing of participation. Despite this, the clustering coefficient (0.568) shows that when connections do exist, they often form small tightly-knit groups.
Grunspan, 2014
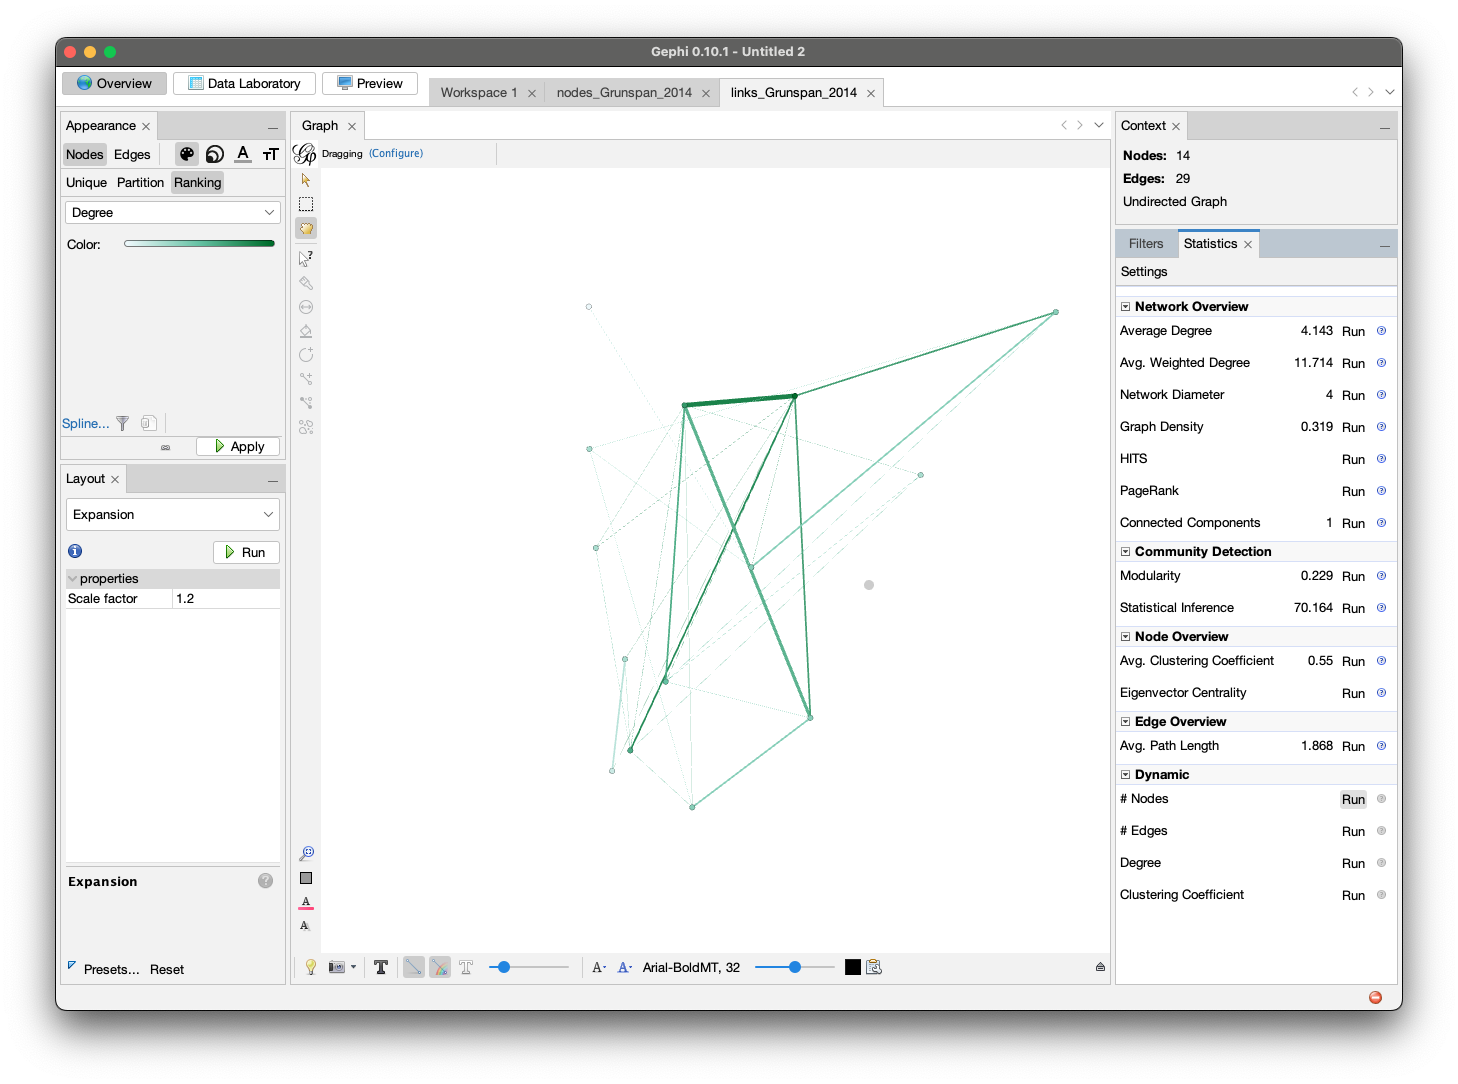
The comment interaction network for Grunspan, 2014 includes 14 students and 29 edges, forming a moderately sparse graph. While most students are connected, the network exhibits clear centralization with several nodes heavily involved in interaction and others remaining relatively peripheral.
Key Metrics
- Average Degree: 4.143
- Graph Density: 0.319
- Network Diameter: 4
- Modularity: 0.229
- Average Clustering Coefficient: 0.55
- Average Path Length: 1.868
Interpretation: The graph layout shows a small number of central hubs forming thick edges with multiple others, likely reflecting repeated co-commenting in popular sections. Meanwhile, several students appear as lightly connected satellites, engaging with fewer peers. The density (0.319) and diameter (4) indicate that while the network is connected, many students do not directly interact. The modularity score of 0.229 hints at subtle groupings, but no strong sub-community boundaries. With a clustering coefficient of 0.55, we can infer moderate local cohesion—when students interact, it’s often within small familiar clusters.
Herodotou, 2019
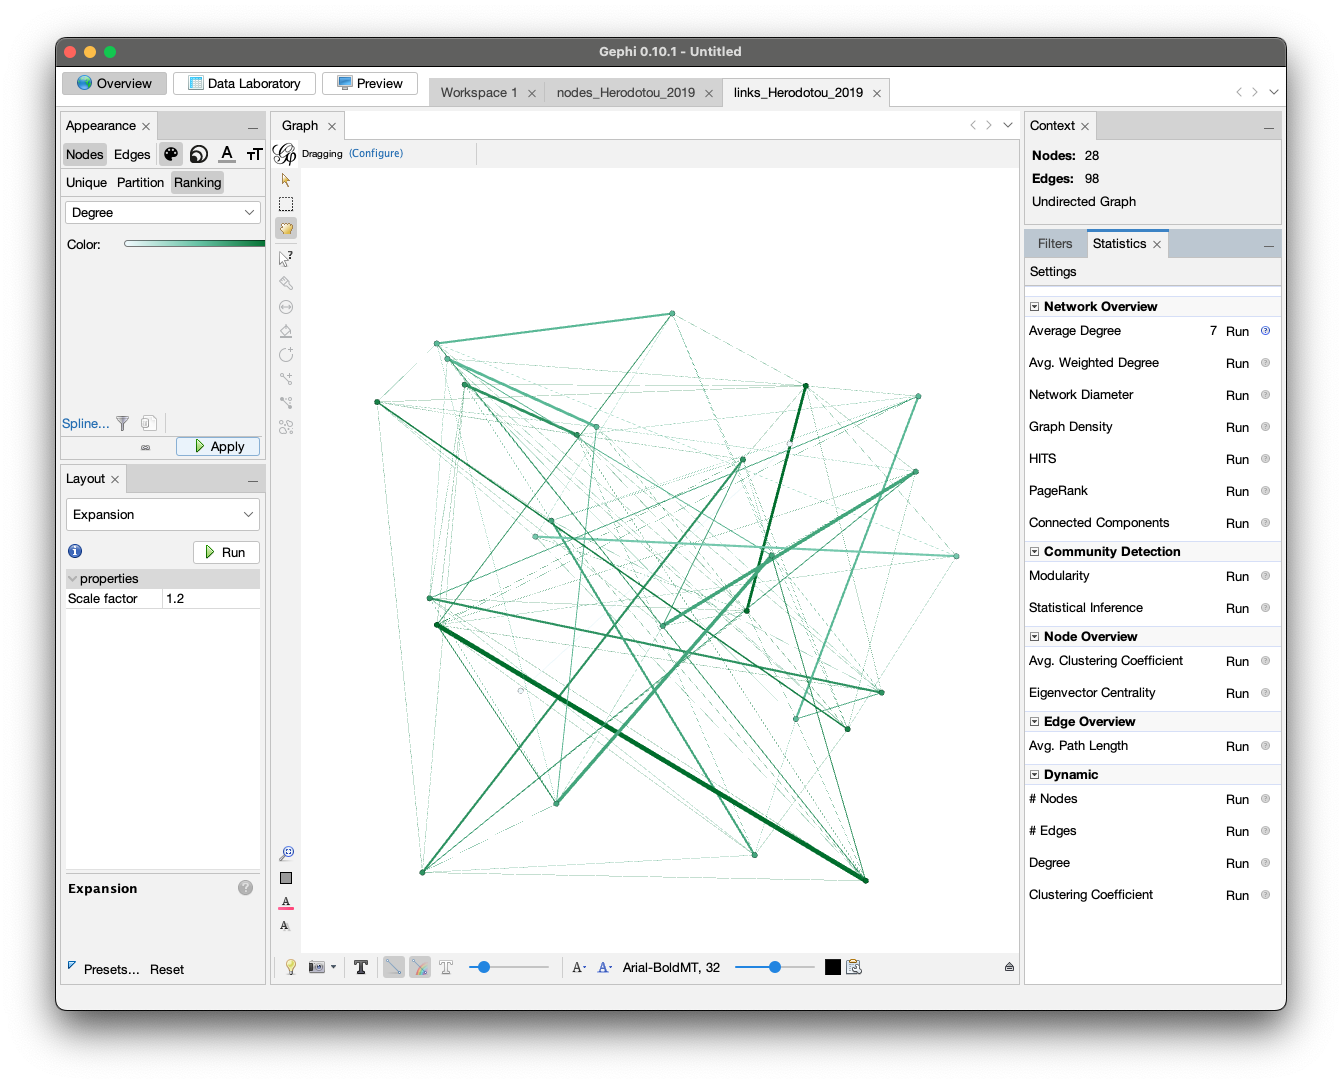
The network for Herodotou, 2019 captures discussion patterns among 28 students and 98 edges, making it one of the largest and densest reading networks in this assignment. The graph reveals a vibrant structure, where many students are both well-connected and actively engaged in co-commenting.
Observed Metrics
- Number of Nodes: 28
- Number of Edges: 98
- Average Degree: 7 (visibly confirmed)
- Likely high graph density, low diameter, and strong clustering, though not yet computed
Interpretation: The structure exhibits interwoven clusters and overlapping engagement, with no clearly dominant hub—implying a relatively egalitarian participation model. Most nodes are connected by multiple edges, and there is no strong fragmentation or peripheral isolation. Visual density suggests that many students commented on the same segments, resulting in rich interaction webs. Several thicker edges (repeated co-occurrence) indicate possible repeated engagement between peer pairs. The broad spread of the graph and even degree distribution make this week stand out as a highly active and collectively engaged session. Unlike other weeks where hubs carried most of the discussion weight, Herodotou, 2019 appears more balanced.
Santos, 2012
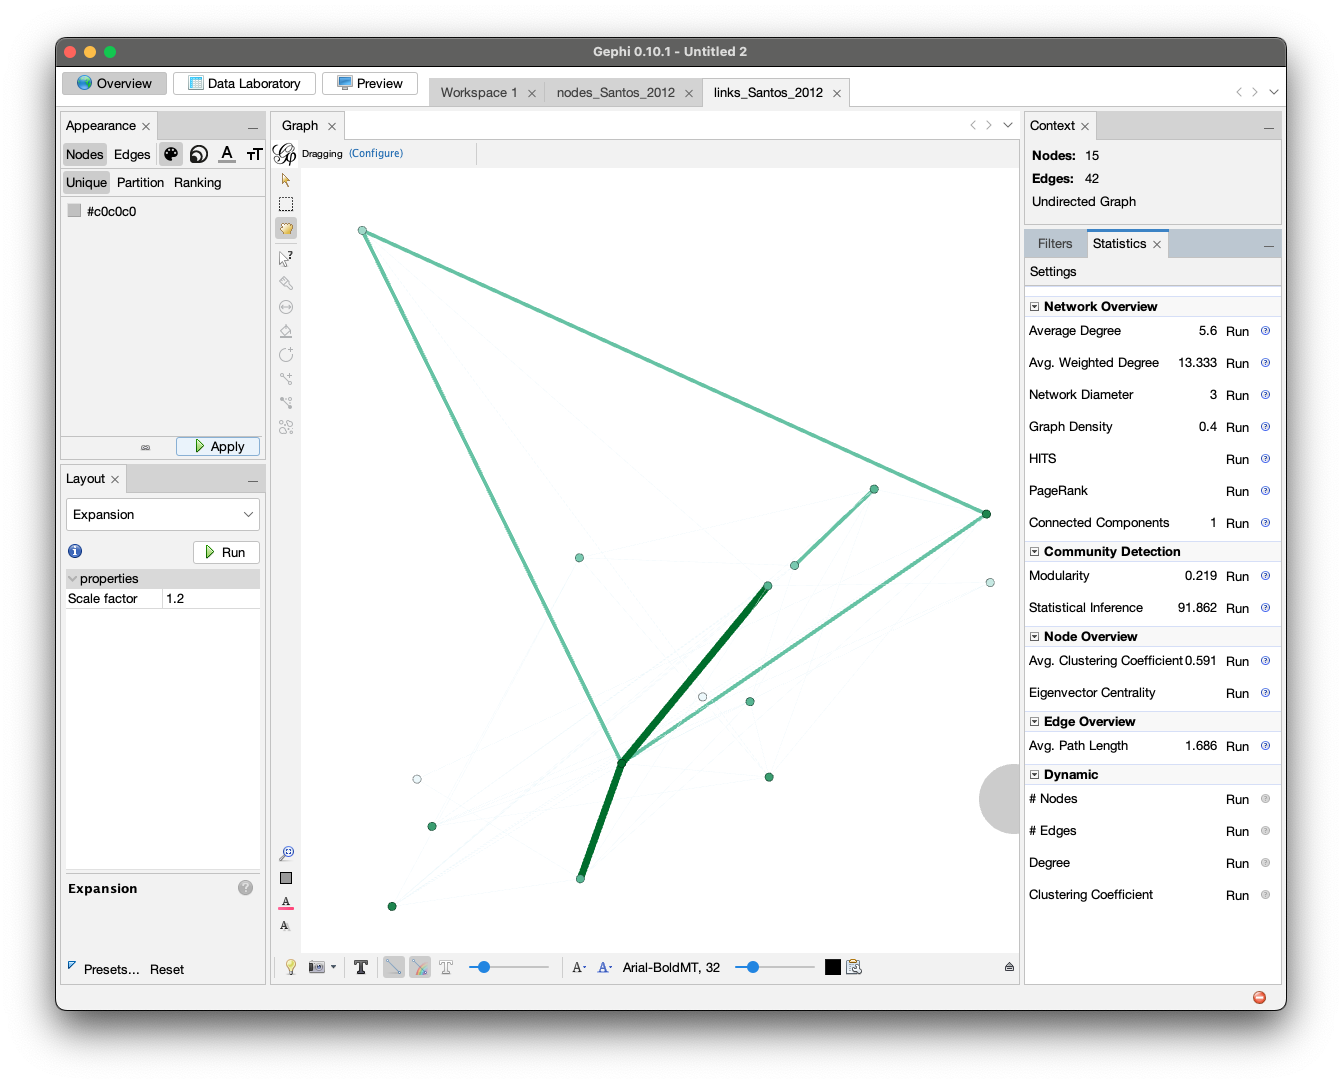
The interaction network for Santos, 2012 includes 15 students and 42 edges, representing a relatively dense and centralized participation pattern. One or two students appear as key hubs, strongly connected to multiple others, while a few participants remain at the edge of the network with limited engagement.
Key Metrics
- Average Degree: 5.6
- Graph Density: 0.4
- Network Diameter: 3
- Modularity: 0.219
- Average Clustering Coefficient: 0.591
- Average Path Length: 1.686
Interpretation: the network shows a clear core-periphery structure. A few central nodes (likely highly active students) are surrounded by smaller nodes with minimal connections—these peripheral students often connect to the hub but not to each other. This structure can be effective for spreading information but may limit peer-to-peer interaction depth. The high density (0.4) and short average path length (1.686) suggest efficient connectivity, meaning most students are just one or two steps away from others. However, low modularity (0.219) indicates limited subgroup formation, so while the class is connected, it’s not strongly clustered into discussion communities. The average clustering coefficient (0.591) implies decent local cohesion, but mostly orbiting around the central figure(s) rather than being distributed evenly.
Selwyn, 2015
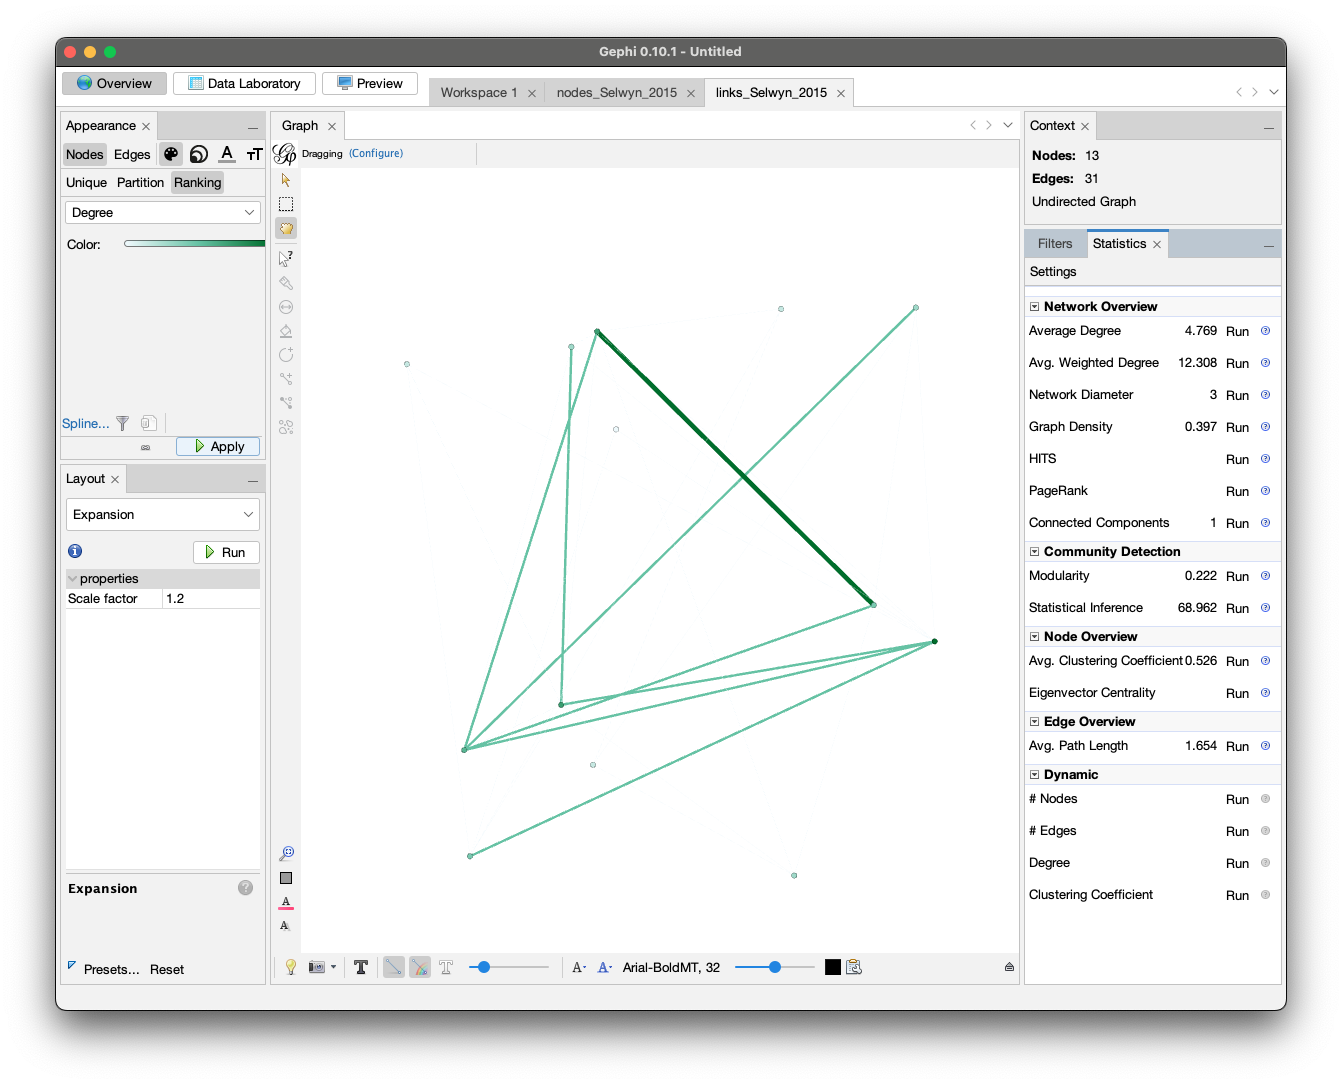
The network for Selwyn, 2015 comprises 13 students and 31 edges, forming a tight but unevenly connected structure. While some students appear strongly embedded in the network, others are sparsely connected or positioned on the periphery.
Key Metrics
- Average Degree: 4.769
- Graph Density: 0.397
- Network Diameter: 3
- Modularity: 0.222
- Average Clustering Coefficient: 0.526
- Average Path Length: 1.654
Interpretation: the network structure reveals a moderate level of overall interactivity, with a few central nodes responsible for a substantial portion of the connectivity. These nodes are often part of frequently revisited segments, indicated by thicker edges (i.e., repeated co-commenting). The relatively high density (0.397) and short average path length (1.654) suggest that most students are within a couple of steps of each other, enabling fast diffusion of ideas. However, the low modularity (0.222) implies limited subgroup formation—the discussion was somewhat centralized and not broken into thematic or peer-based clusters. With an average clustering coefficient of 0.526, the graph shows that when students interacted, they tended to do so in locally cohesive triads, but these were not broadly distributed.
Srinivasa, 2021
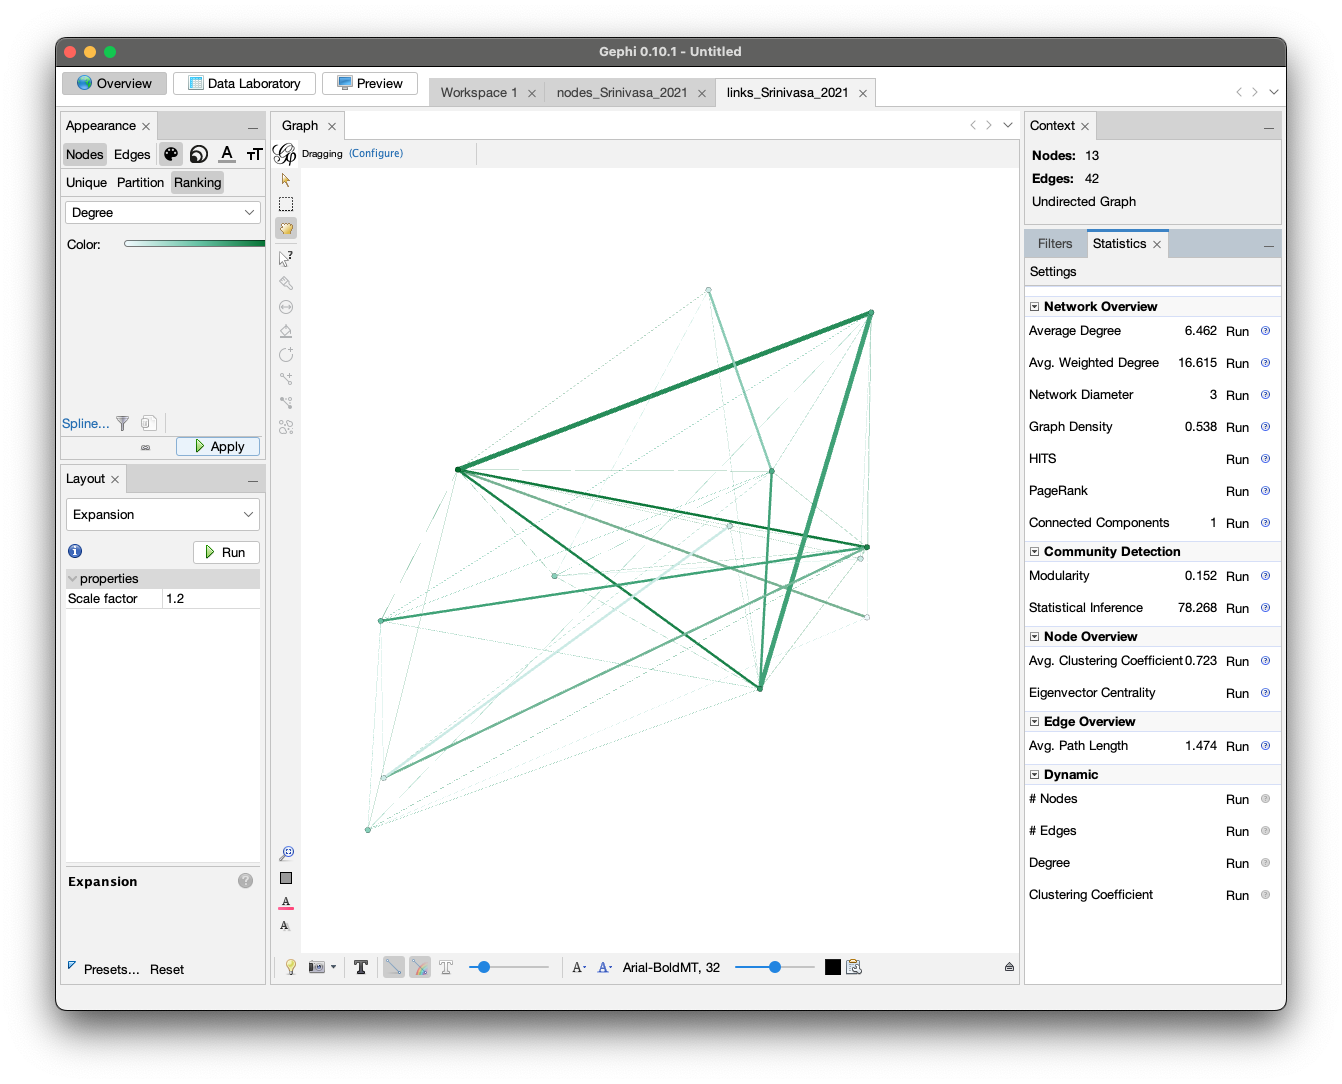
The discussion network for Srinivasa, 2021 includes 13 students and 42 edges, forming a compact and highly cohesive structure. This week shows an outstanding level of interconnectedness and mutual engagement, with students actively co-commenting across shared content.
Key Metrics
- Average Degree: 6.462
- Graph Density: 0.538
- Network Diameter: 3
- Modularity: 0.152
- Average Clustering Coefficient: 0.723
- Average Path Length: 1.474
Interpretation: this network is among the densest of all weeks. The graph density (0.538) and average degree (6.462) indicate that almost every student is closely connected to others, often through multiple shared comment zones. The short average path length (1.474) suggests minimal social distance between students. A standout feature is the high clustering coefficient (0.723), showing that not only are students interacting with many others, but they also tend to interact within tightly connected triads, forming strongly bonded clusters. The low modularity (0.152) suggests there is no strong subgroup separation—instead, this week’s conversation was fluid and integrative, with discussion spreading evenly across the network.
Wickham, 2014
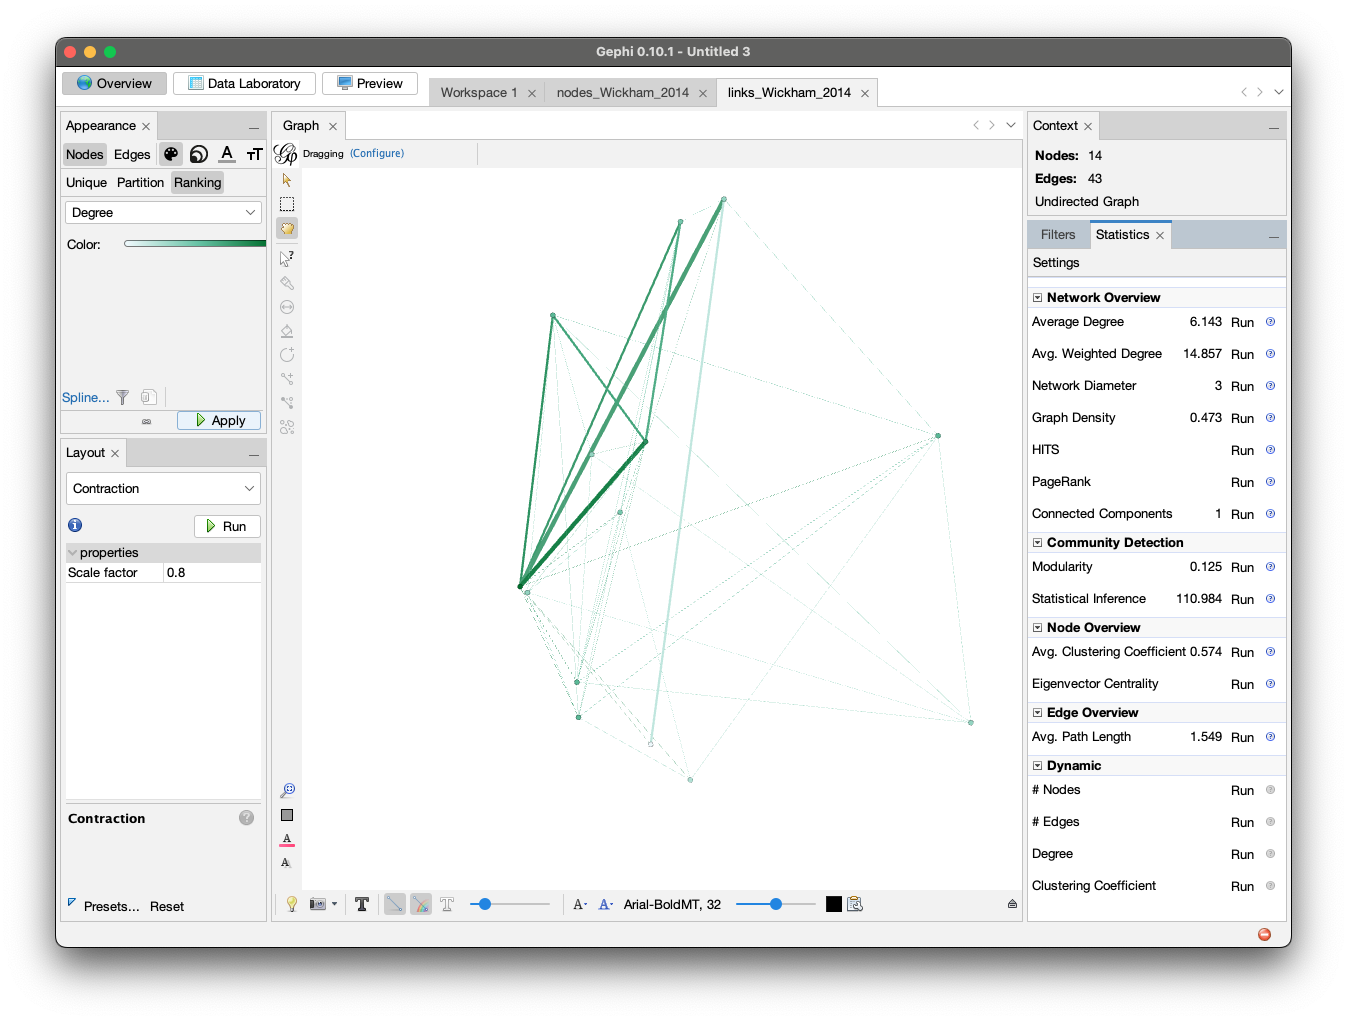
The discussion network for Wickham, 2014 includes 14 students and 43 edges, forming a dense and highly interconnected structure. The network shows a strong core of participants and an evenly distributed outer ring, indicating relatively balanced peer interaction with a few standout contributors.
Key Metrics
- Average Degree: 6.143
- Graph Density: 0.473
- Network Diameter: 3
- Modularity: 0.125
- Average Clustering Coefficient: 0.574
- Average Path Length: 1.549
Interpretation: with a graph density of 0.473, this week’s network is among the densest in the dataset, indicating frequent co-commenting across the same segments. Most students are within 1 to 2 hops of each other, as shown by the low average path length (1.549) and network diameter (3). However, the modularity score of 0.125 suggests very weak community separation—the conversation appears to have been uniformly distributed rather than split into topical or group-based clusters. The clustering coefficient of 0.574 further supports this interpretation: when students interacted, they often did so in tightly knit triads, promoting recursive dialogue. Some nodes stand out for their degree and edge thickness, likely representing participants who either initiated or heavily engaged in popular discussion threads.
Wise, 2013
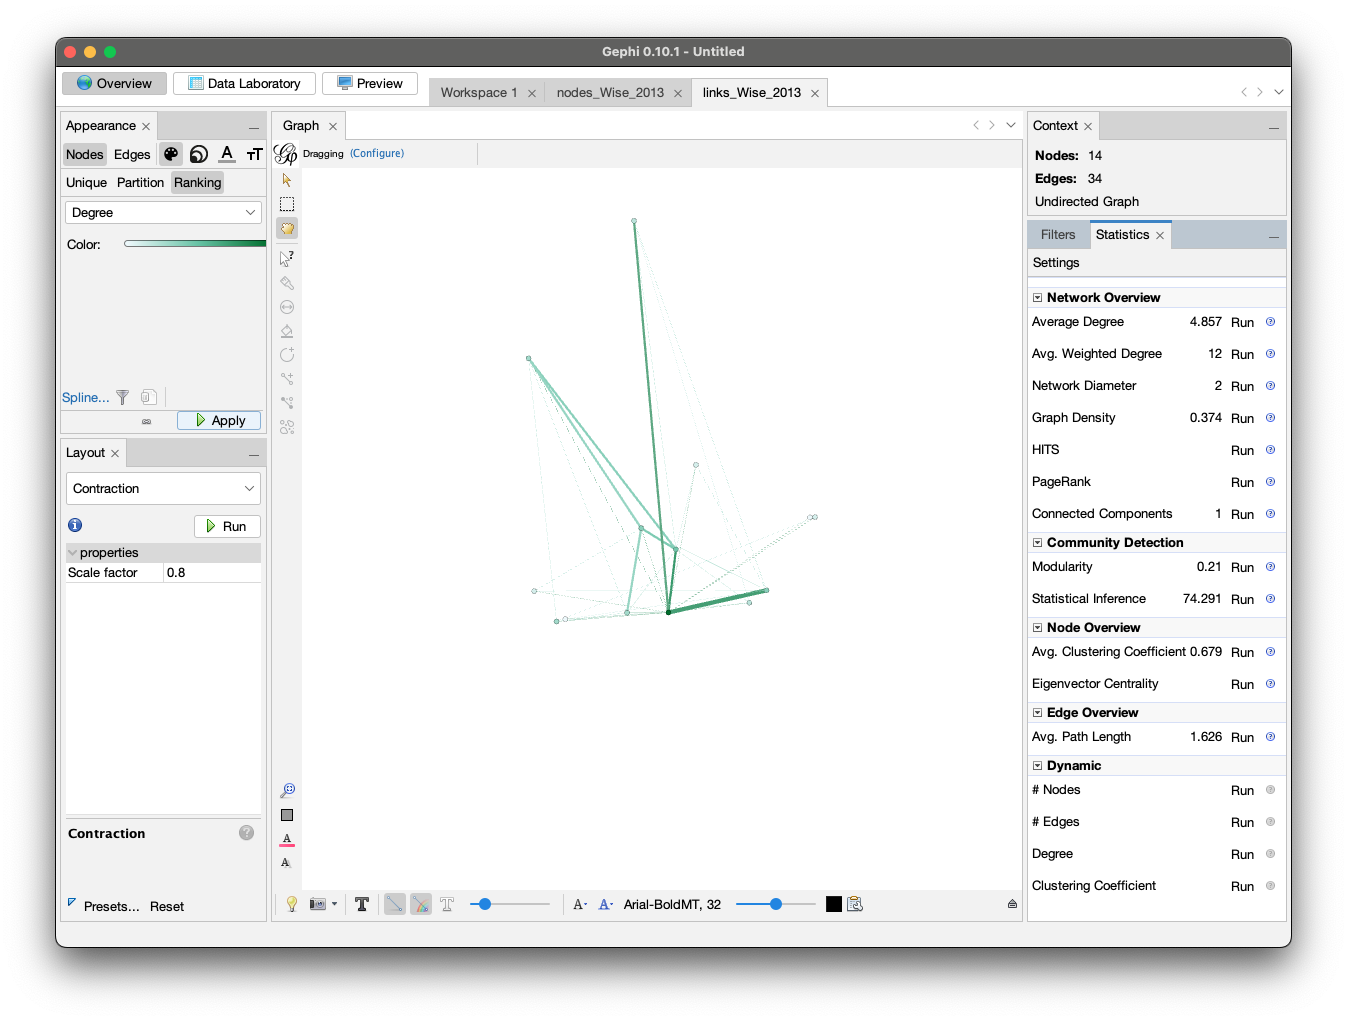
The discussion network for Wickham, 2014 includes 14 students and 43 edges, forming a dense and highly interconnected structure. The network shows a strong core of participants and an evenly distributed outer ring, indicating relatively balanced peer interaction with a few standout contributors.
Key Metrics
- Average Degree: 6.143
- Graph Density: 0.473
- Network Diameter: 3
- Modularity: 0.125
- Average Clustering Coefficient: 0.574
- Average Path Length: 1.549
Interpretation: with a graph density of 0.473, this week’s network is among the densest in the dataset, indicating frequent co-commenting across the same segments. Most students are within 1 to 2 hops of each other, as shown by the low average path length (1.549) and network diameter (3). However, the modularity score of 0.125 suggests very weak community separation—the conversation appears to have been uniformly distributed rather than split into topical or group-based clusters. The clustering coefficient of 0.574 further supports this interpretation: when students interacted, they often did so in tightly knit triads, promoting recursive dialogue. Some nodes stand out for their degree and edge thickness, likely representing participants who either initiated or heavily engaged in popular discussion threads.
Wise, 2019
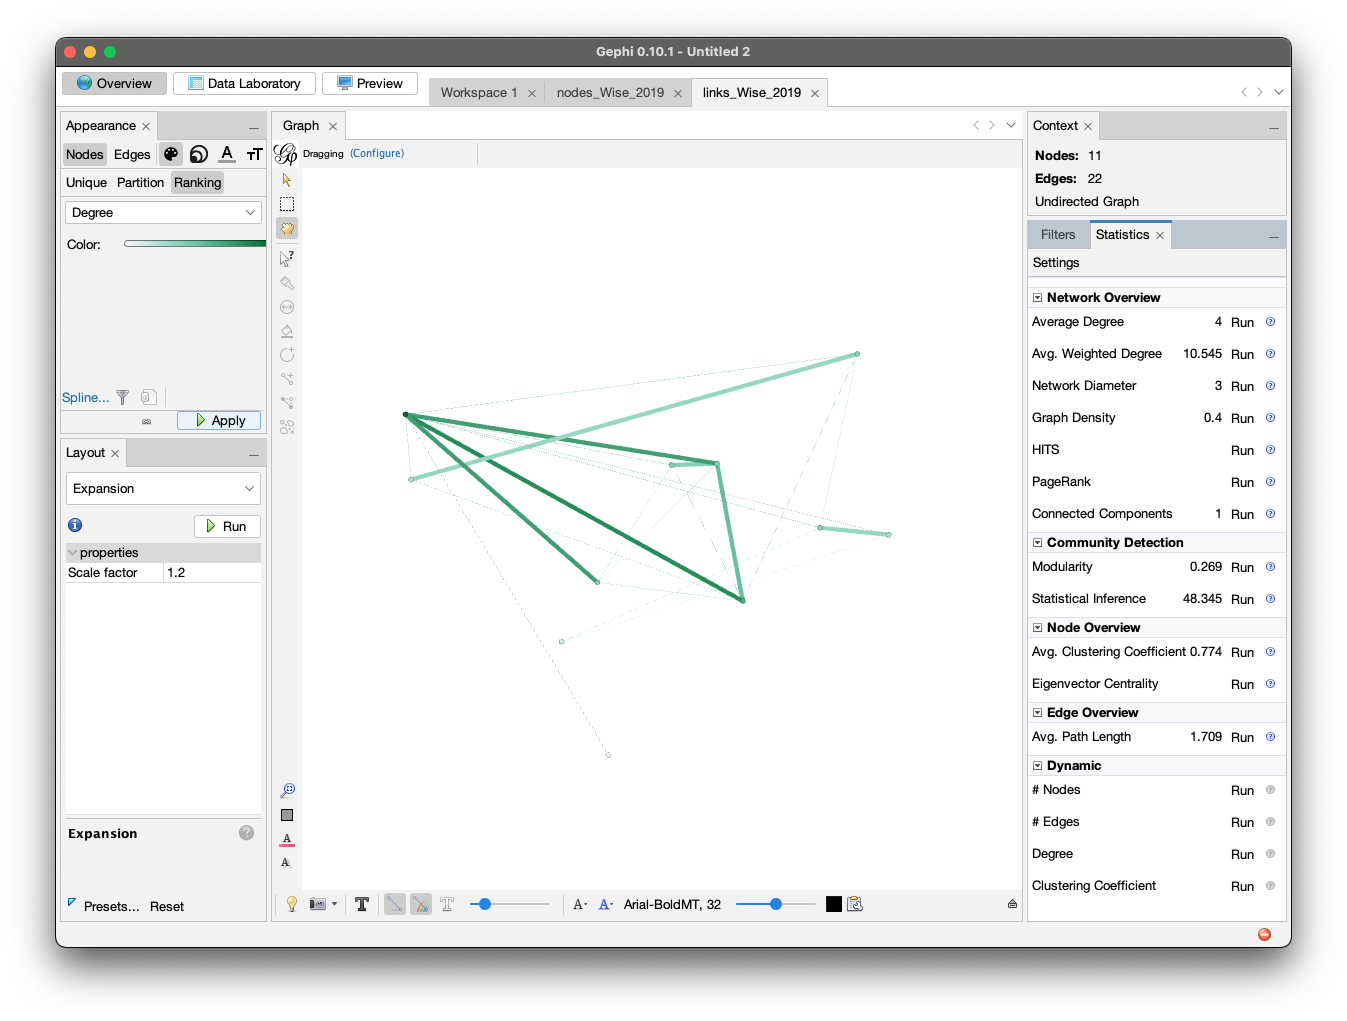
The interaction network for Wise, 2019 includes 11 students and 22 edges, forming a compact, tightly clustered structure. While the network is small in scale, it displays strong interactivity, with most participants engaged in shared discussion zones.
Key Metrics
- Average Degree: 4
- Graph Density: 0.4
- Network Diameter: 3
- Modularity: 0.269
- Average Clustering Coefficient: 0.774
- Average Path Length: 1.709
Interpretation: despite the lower number of nodes, the density (0.4) and clustering coefficient (0.774) indicate that participants were highly interconnected. Most students contributed to similar content zones, forming dense triadic structures—the kind often associated with reciprocal engagement and peer awareness. The low diameter (3) and short average path length (1.709) reinforce the idea that all participants were within close reach of one another, enabling efficient exchange of ideas. The modularity (0.269) is slightly higher than other weeks, suggesting the possible emergence of small topic-based subgroups, although not clearly separated.