Querying Spark Data with dplyr in Exploratory
Apache Spark is the most popular in-memory Big Data infrastructure today. In the previous post, I introduced a way to use SQL to extract data from Spark with sparklyr R package.
In this post, I’ll walk you through how to use dplyr, instead of SQL, to extract data directly from Spark.
Before you start
If you haven’t installed Java on your machine yet, you need to install it first. You can download it from here.
Install sparklyr package
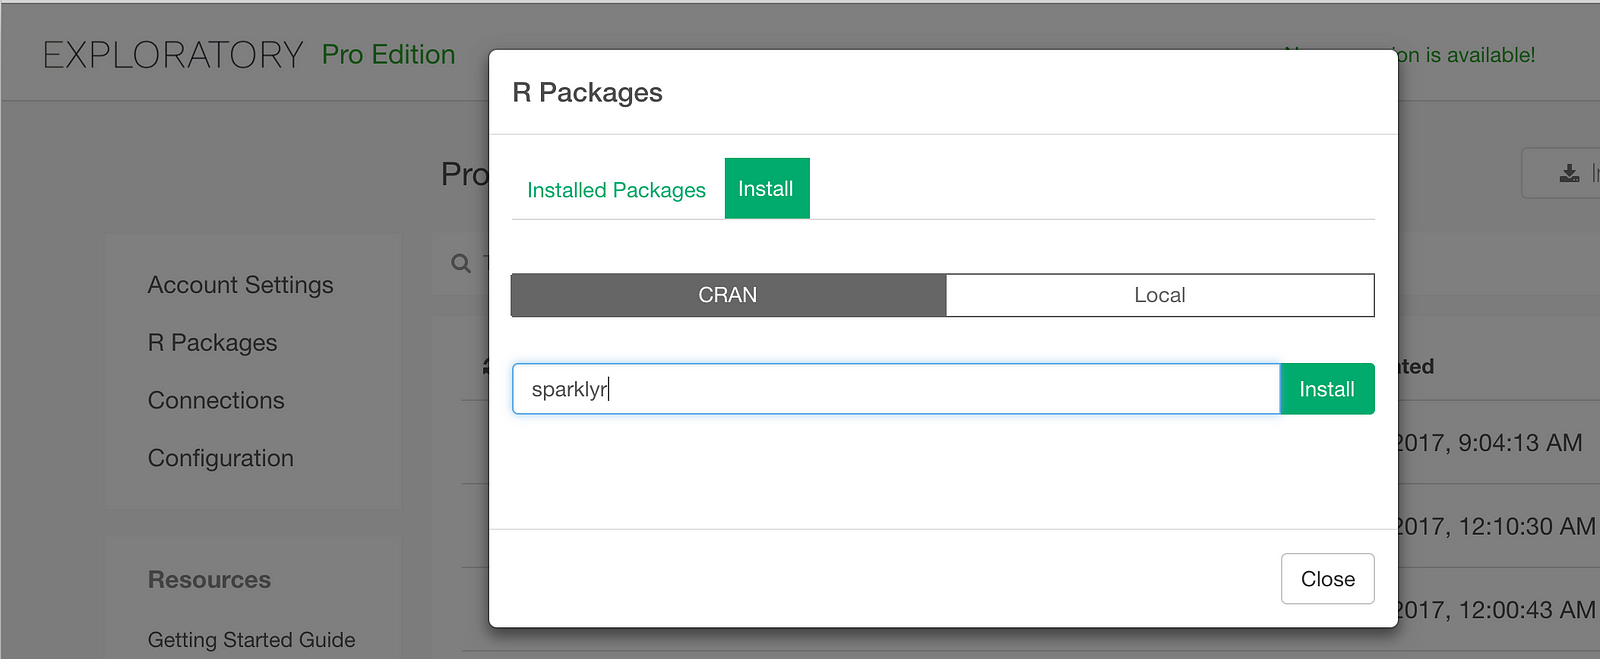
To access your Spark in Exploratory, you need to install the sparklyr package. You can install it inside Exploratory from CRAN as follows.
Query data from Spark with dplyr
The next step is to write R script to query data from Spark in Exploratory. 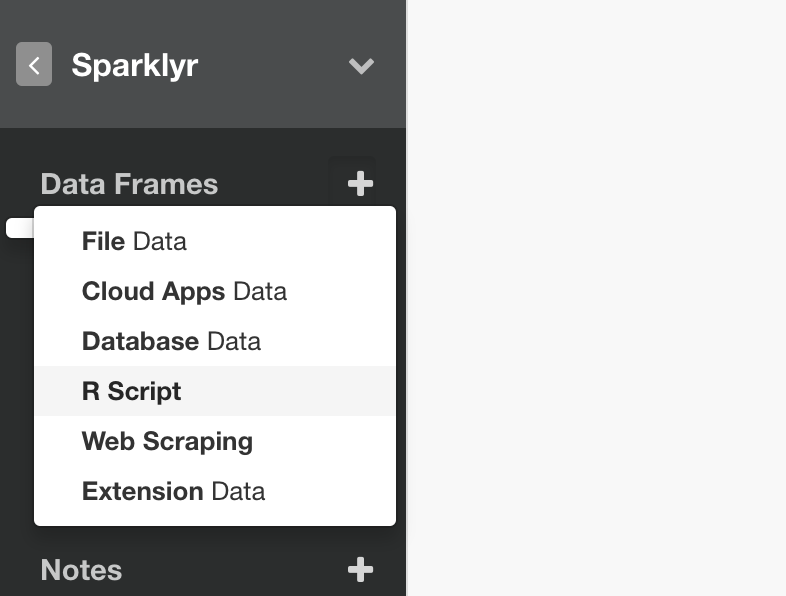
In the R Script, you can connect to your Spark as follows. (This example shows a way to access to your Spark deployed on your local machine)
# Access to Spark (local machine)
# Setup environment variable
Sys.setenv(SPARK_HOME = "/Users/hidekoji/spark/spark-2.2.0-bin-hadoop2.7")
# load sparklyr
library(sparklyr)
# Connect to Spark
sc <- spark_connect(master = "spark://Hidetakas-MacBook-Pro.local:7077")
First, let’s show the top 10 states for each carrier in terms of the average departure delay times. The dplyr query would like this.
flights <- tbl(sc, "flights") %>%
  group_by(CARRIER, ORIGIN_STATE_ABR) %>%
  summarize(DEP_DELAY_AVG = mean(DEP_DELAY)) %>%
  top_n(10, DEP_DELAY_AVG) %>%
  collect()
collect() is a function to submit the query. This will return the result as a data frame. At the end of this post, I consolidated these two steps in a single script so that you can copy and paste it to test inside Exploratory. Make sure you update the values for SPARK_HOME environment variable and the Spark access information inside ‘spark_connect’ function to fit your machine environment.
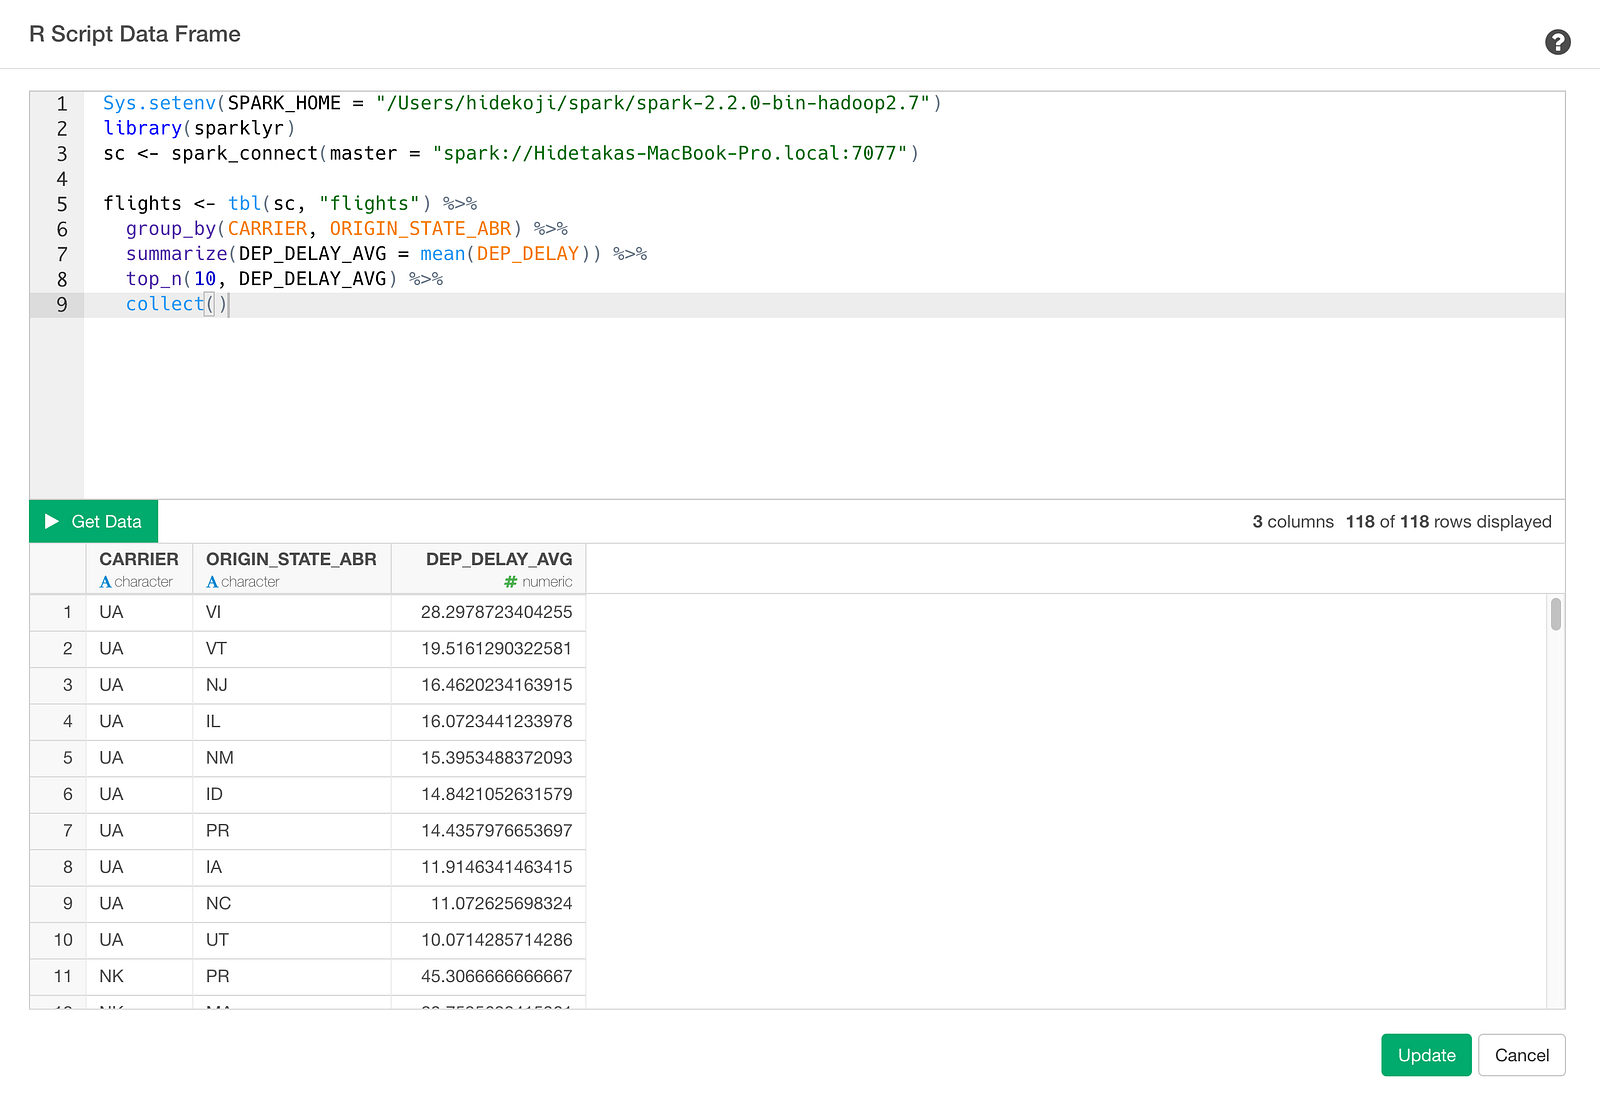
Click Get Data button and check result and click Save button and save as a data frame.
Once the data is imported, you can check your result in Table View as follows.
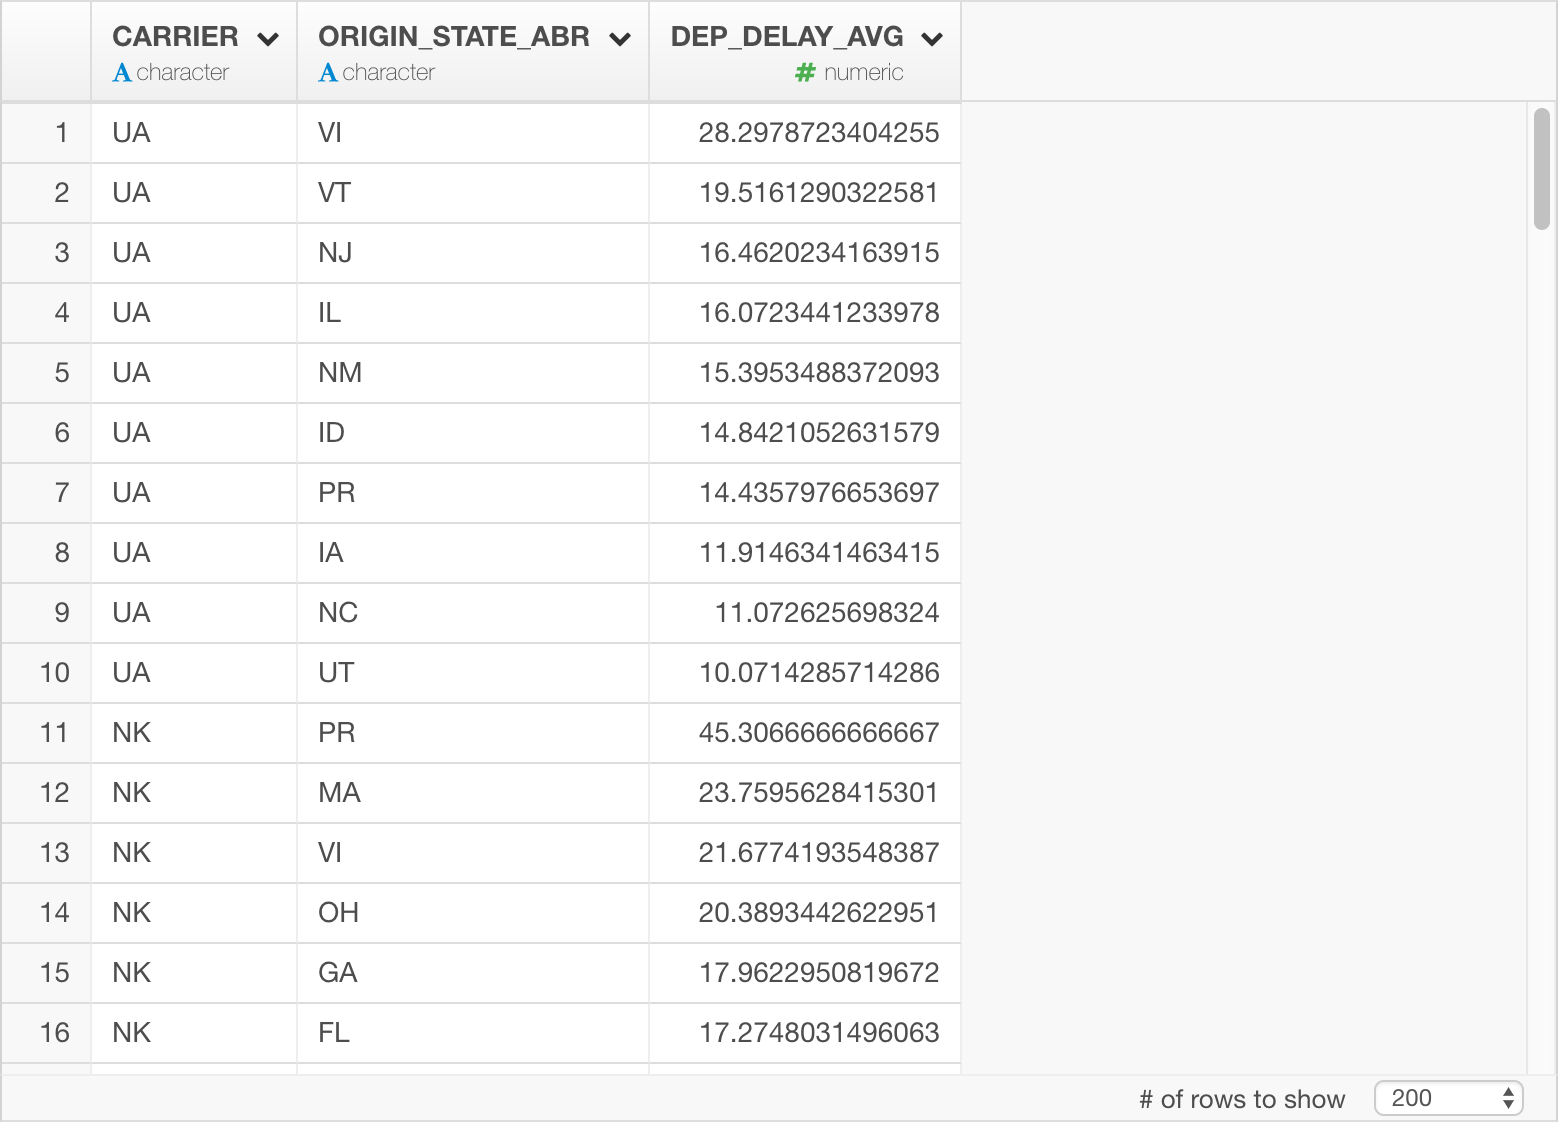
We can quickly visualize it as bar chart by assigning States to “X-Axis” and CARRIER to “Repeat By” so that we can see top 10 departure delayed states for each carrier.
Summary
With sparklyr, you can not only query and extract data from Spark directly inside Exploratory, but also you can use dplyr functions to construct the queries. Once the data is imported, you can quickly visualize it and analyze it with advanced algorithms just like any other data sources.
If you don’t have Exploratory Desktop yet, you can sign up from here for a 30 days free trial. If you are currently a student or teacher, then it’s free!