AI Note Editor: Automating Analysis Report Creation with AI
The process of summarizing data analysis results into reports is a time-consuming and labor-intensive task. In particular, verbalizing insights derived from charts and transcribing them into text poses a significant challenge for analysts.
The “AI Note Editor,” introduced in Exploratory version 14, is a feature that addresses these challenges and fundamentally transforms the way reports are created. This article focuses on the analysis report function of the AI Note Editor and introduces how to utilize it.
Benefits of AI Note Editor
Using the AI Note Editor significantly reduces the time spent on note creation. By simply providing a few lines of notes or just charts, the AI automatically generates a full-fledged report, including components such as background, objectives, analysis results, proposals, and conclusions.
Furthermore, charts embedded in notes can be explained by the AI, eliminating the need for users to write their own interpretations of the charts.
This eliminates the burden of starting a report from scratch, allowing users to complete high-quality reports simply by reviewing and revising the AI-generated draft.
Creating Analysis Reports with AI Note Editor
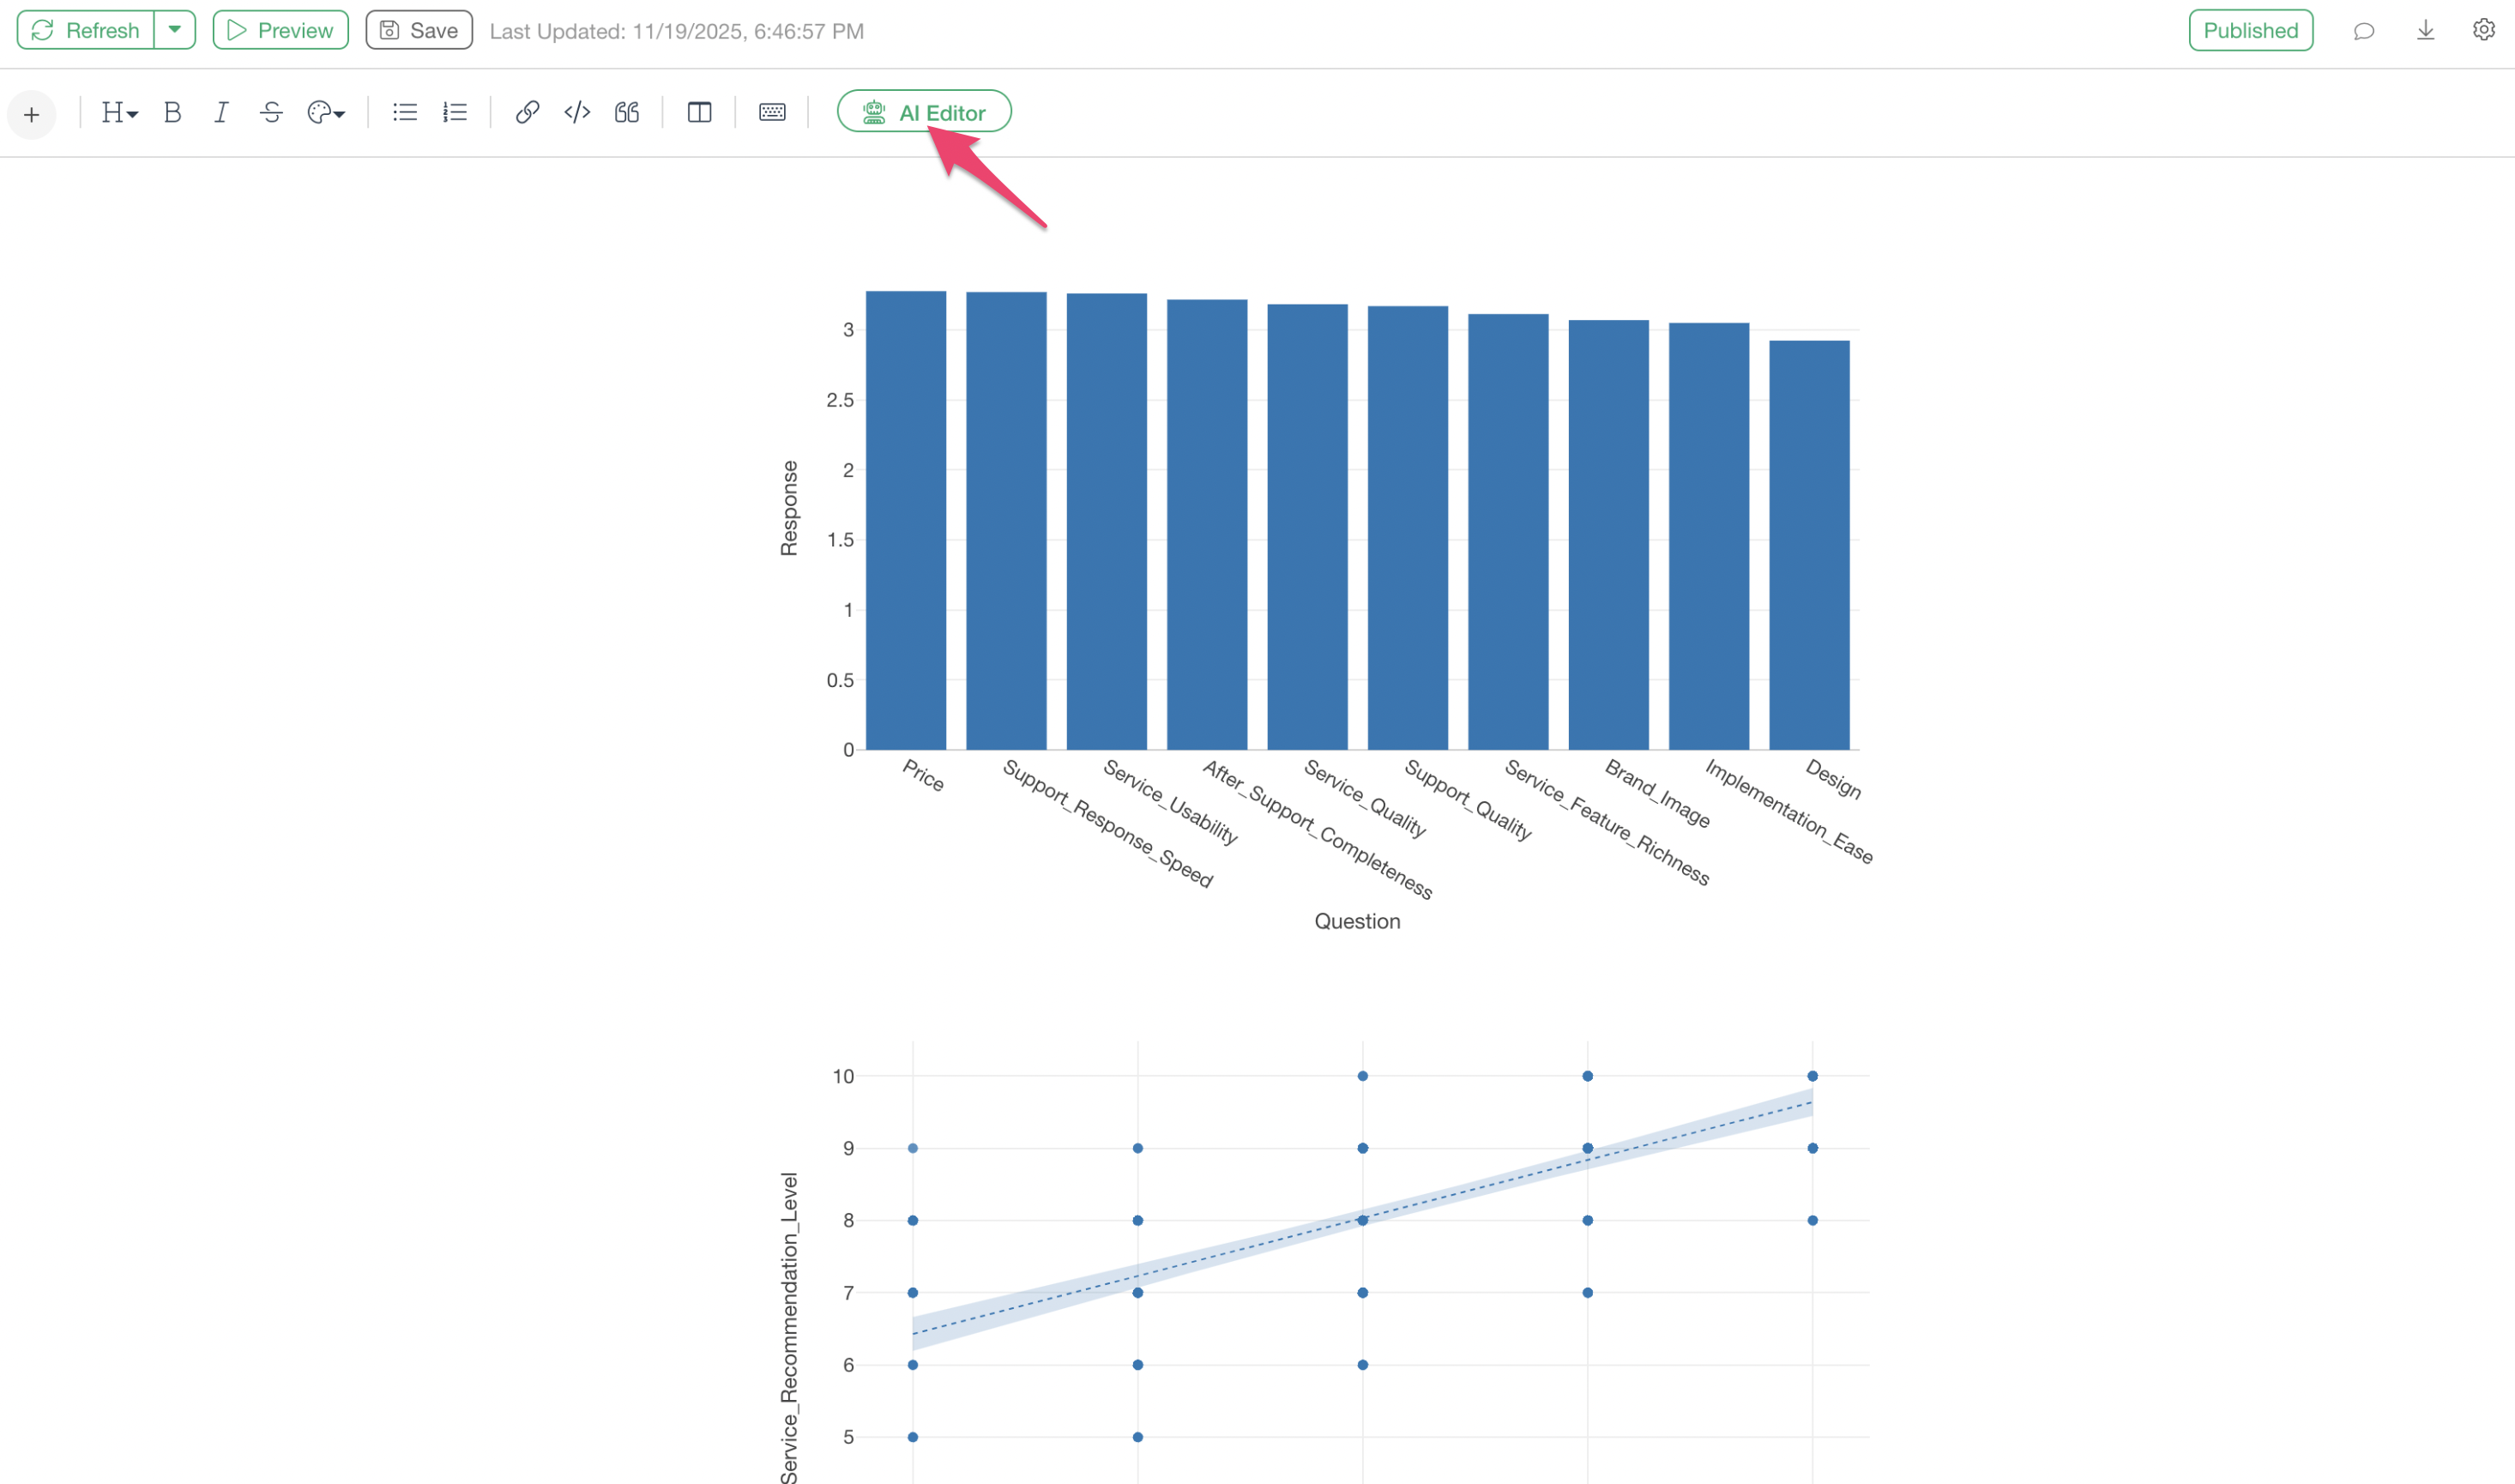
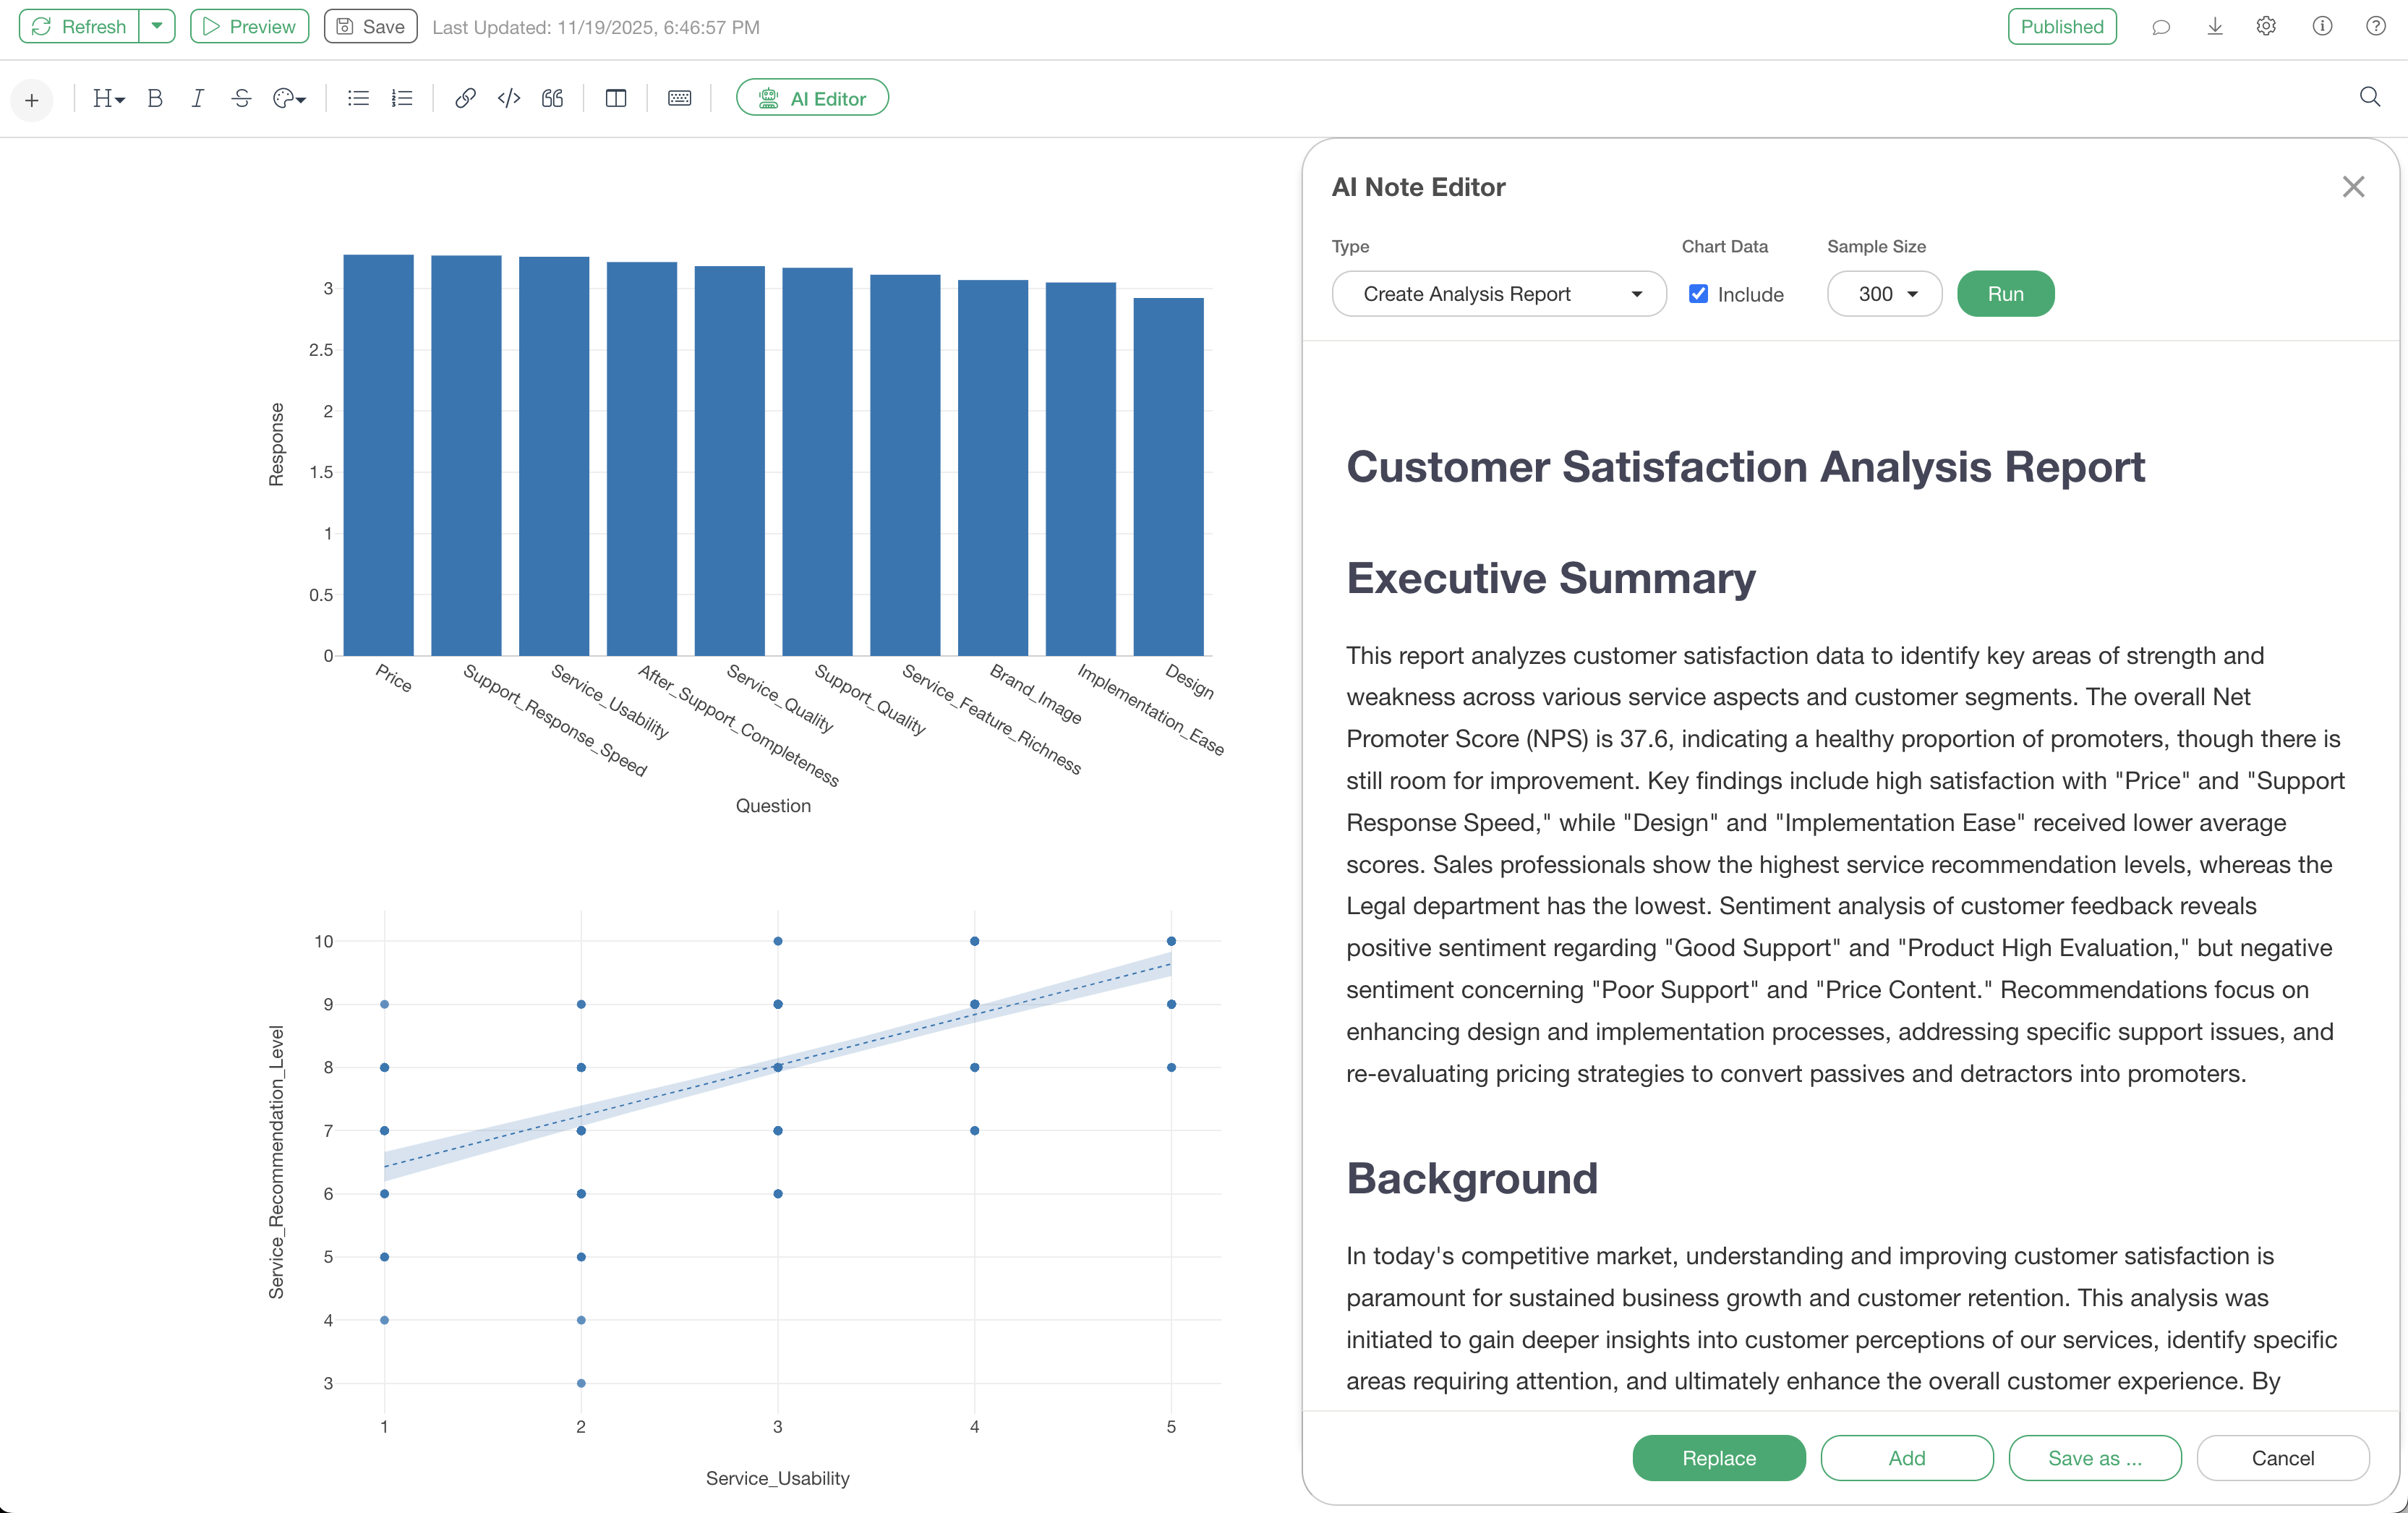
With only charts added to a note, select the “AI Editor” button in the note.
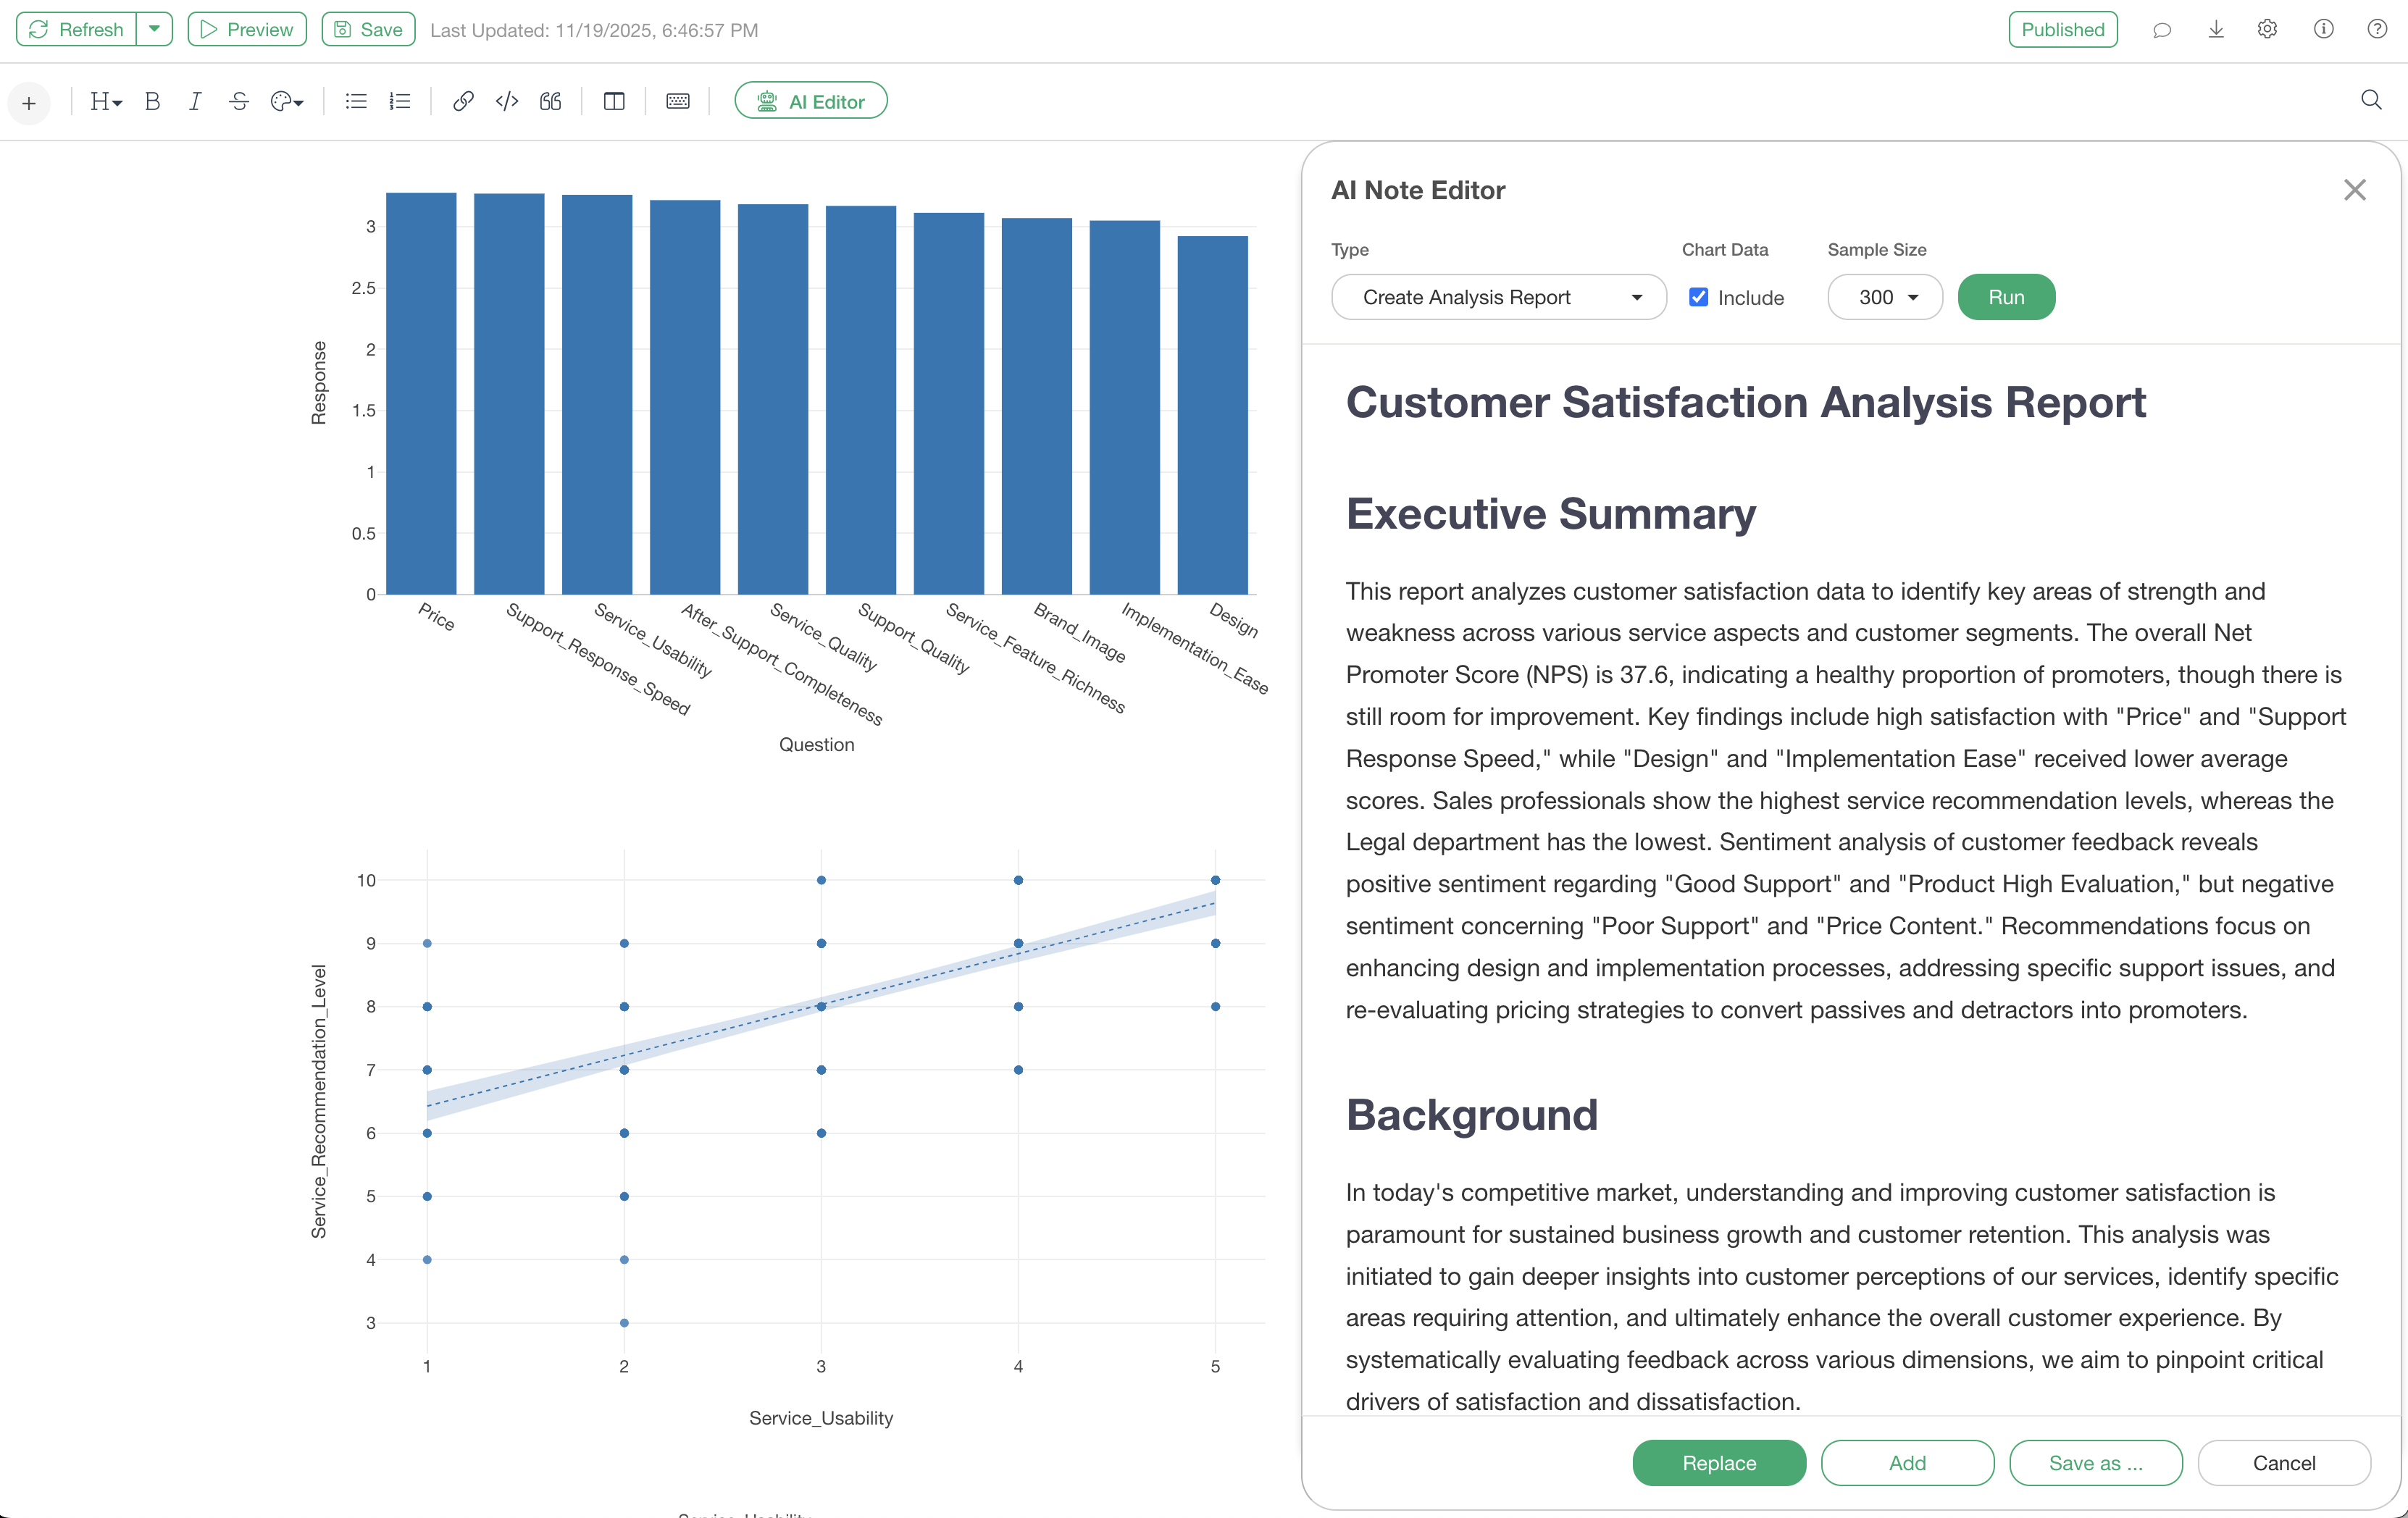
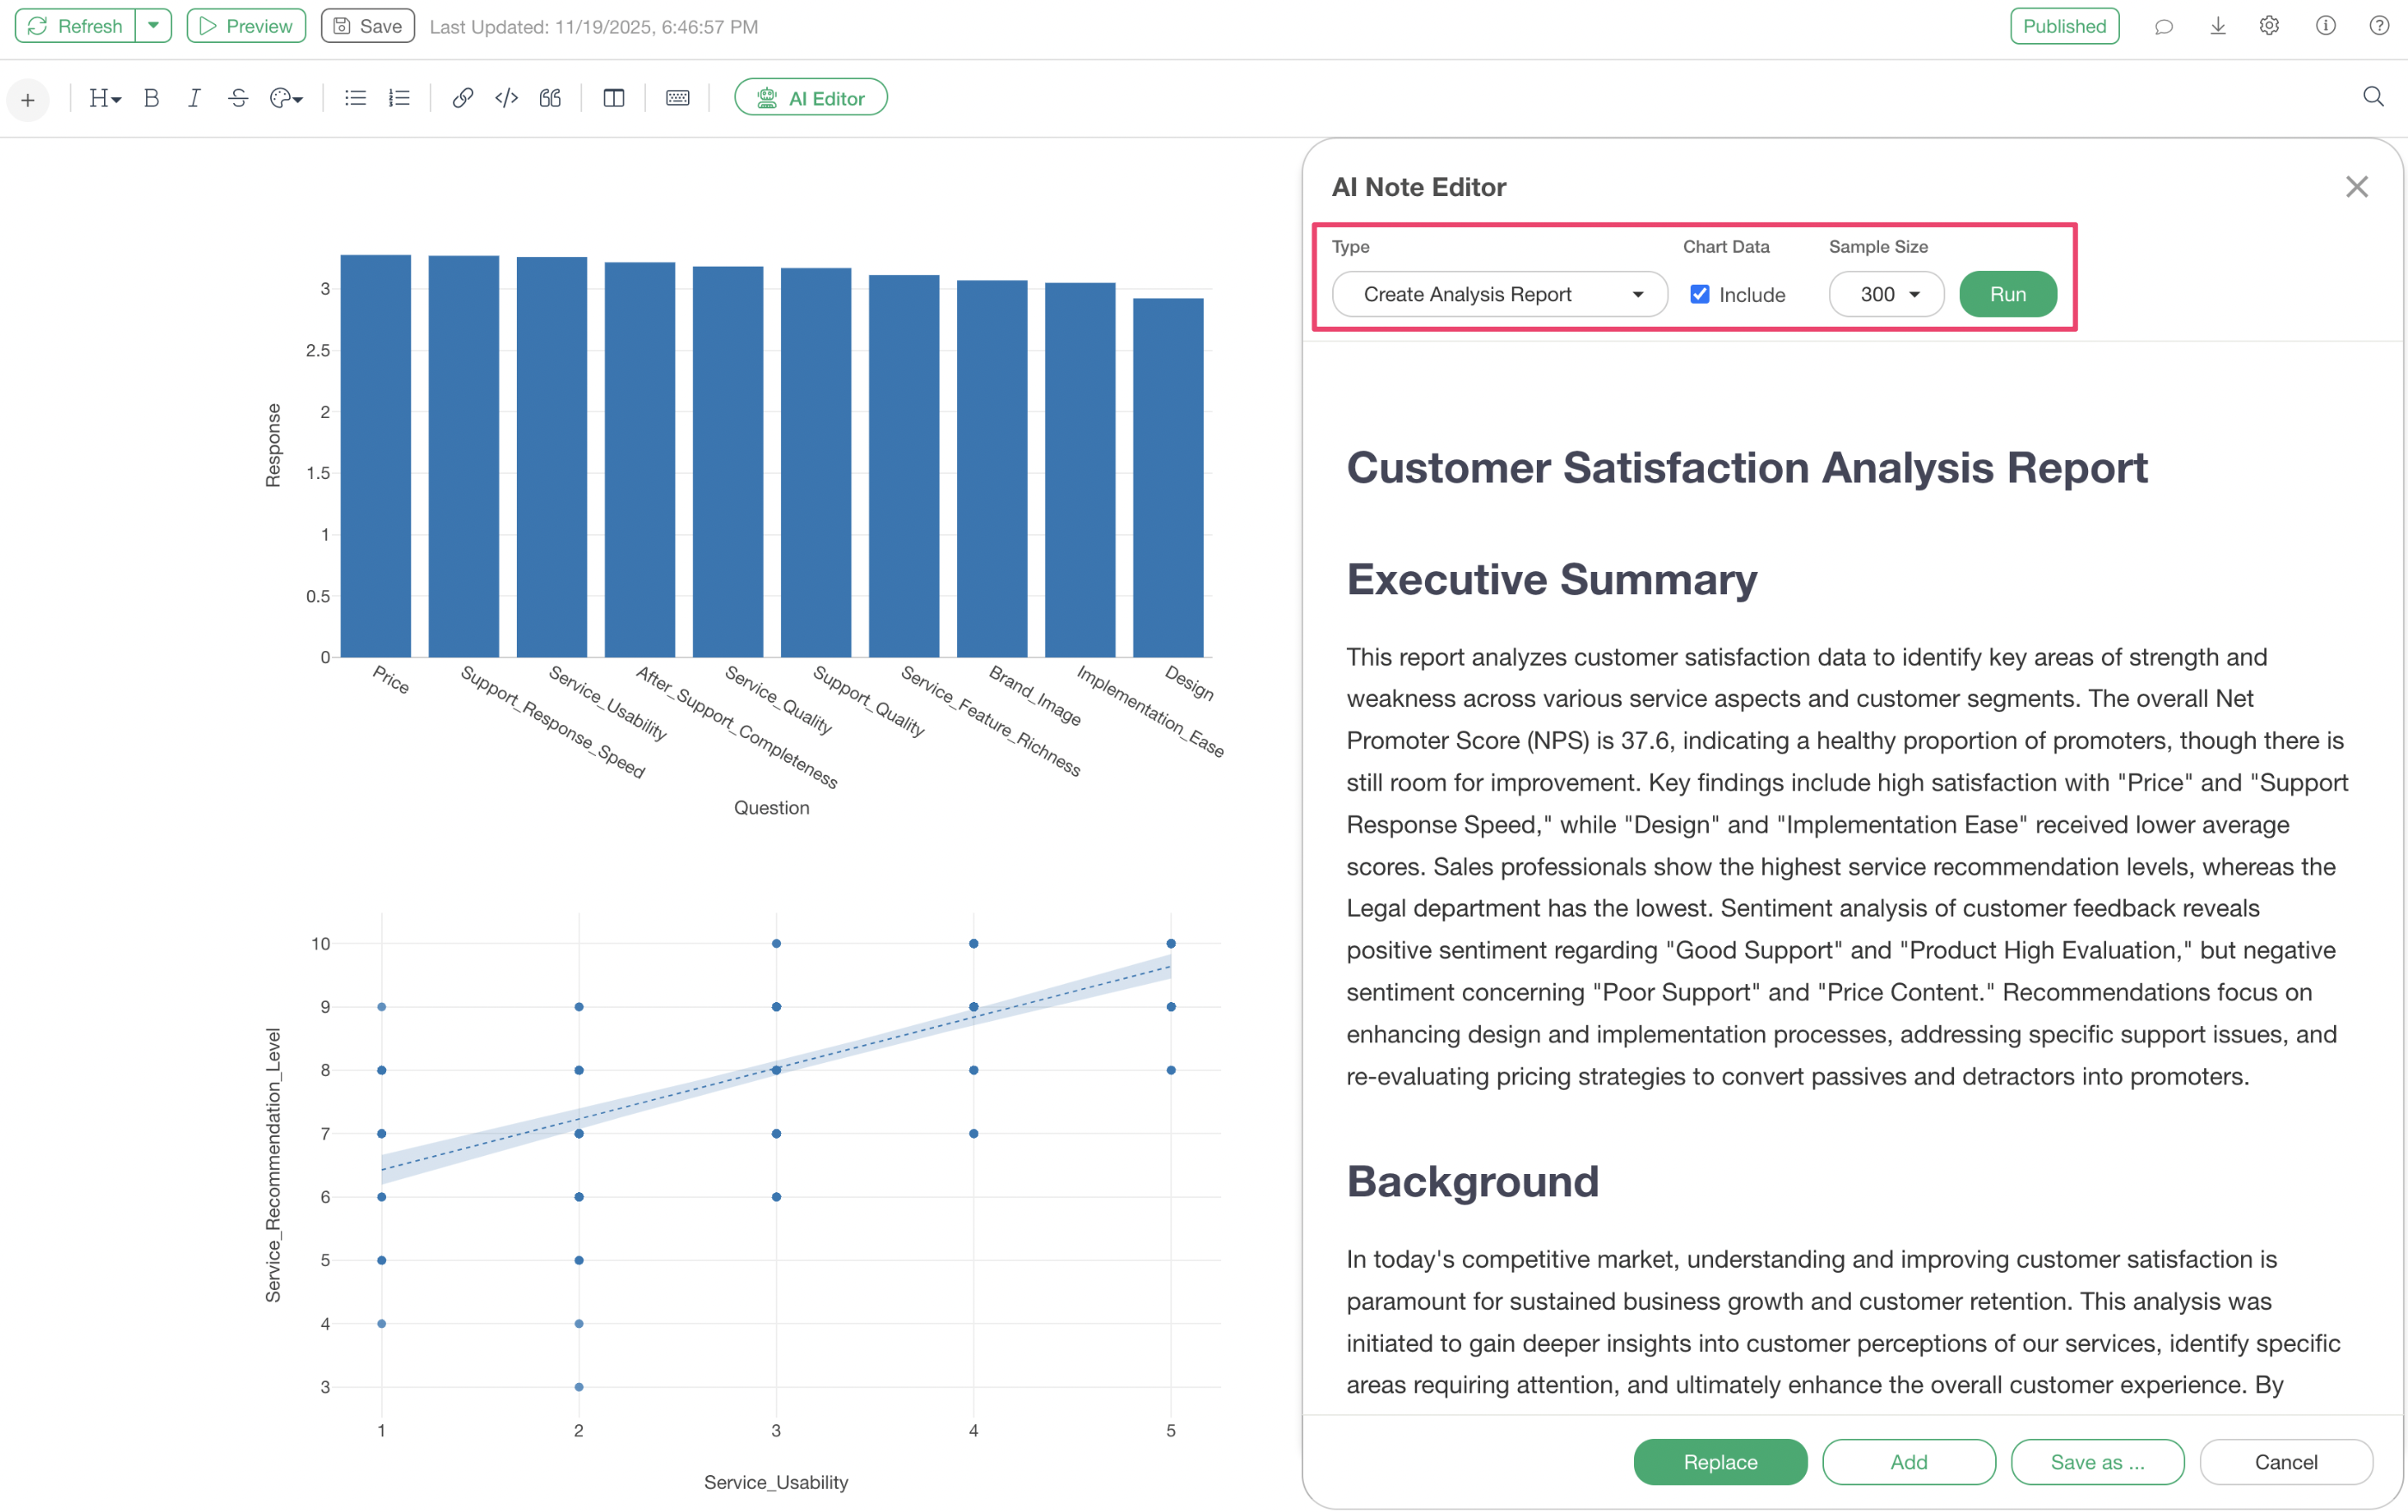
By selecting “Create Analysis Report” from the menu and executing it, a full-fledged analysis report with chart explanations will be automatically generated.
For example, from a state where only a few charts, such as retention rates and NPS, have been added to a note, a complete report with the following structure is generated:
- Executive Summary
- Background and Objectives
- Description of Analysis Methods
- Detailed Analysis Results (with charts appropriately placed)
- Insights on Retention Rates and Onboarding
- Proposals and Action Items
- Conclusion
- Supplementary Materials
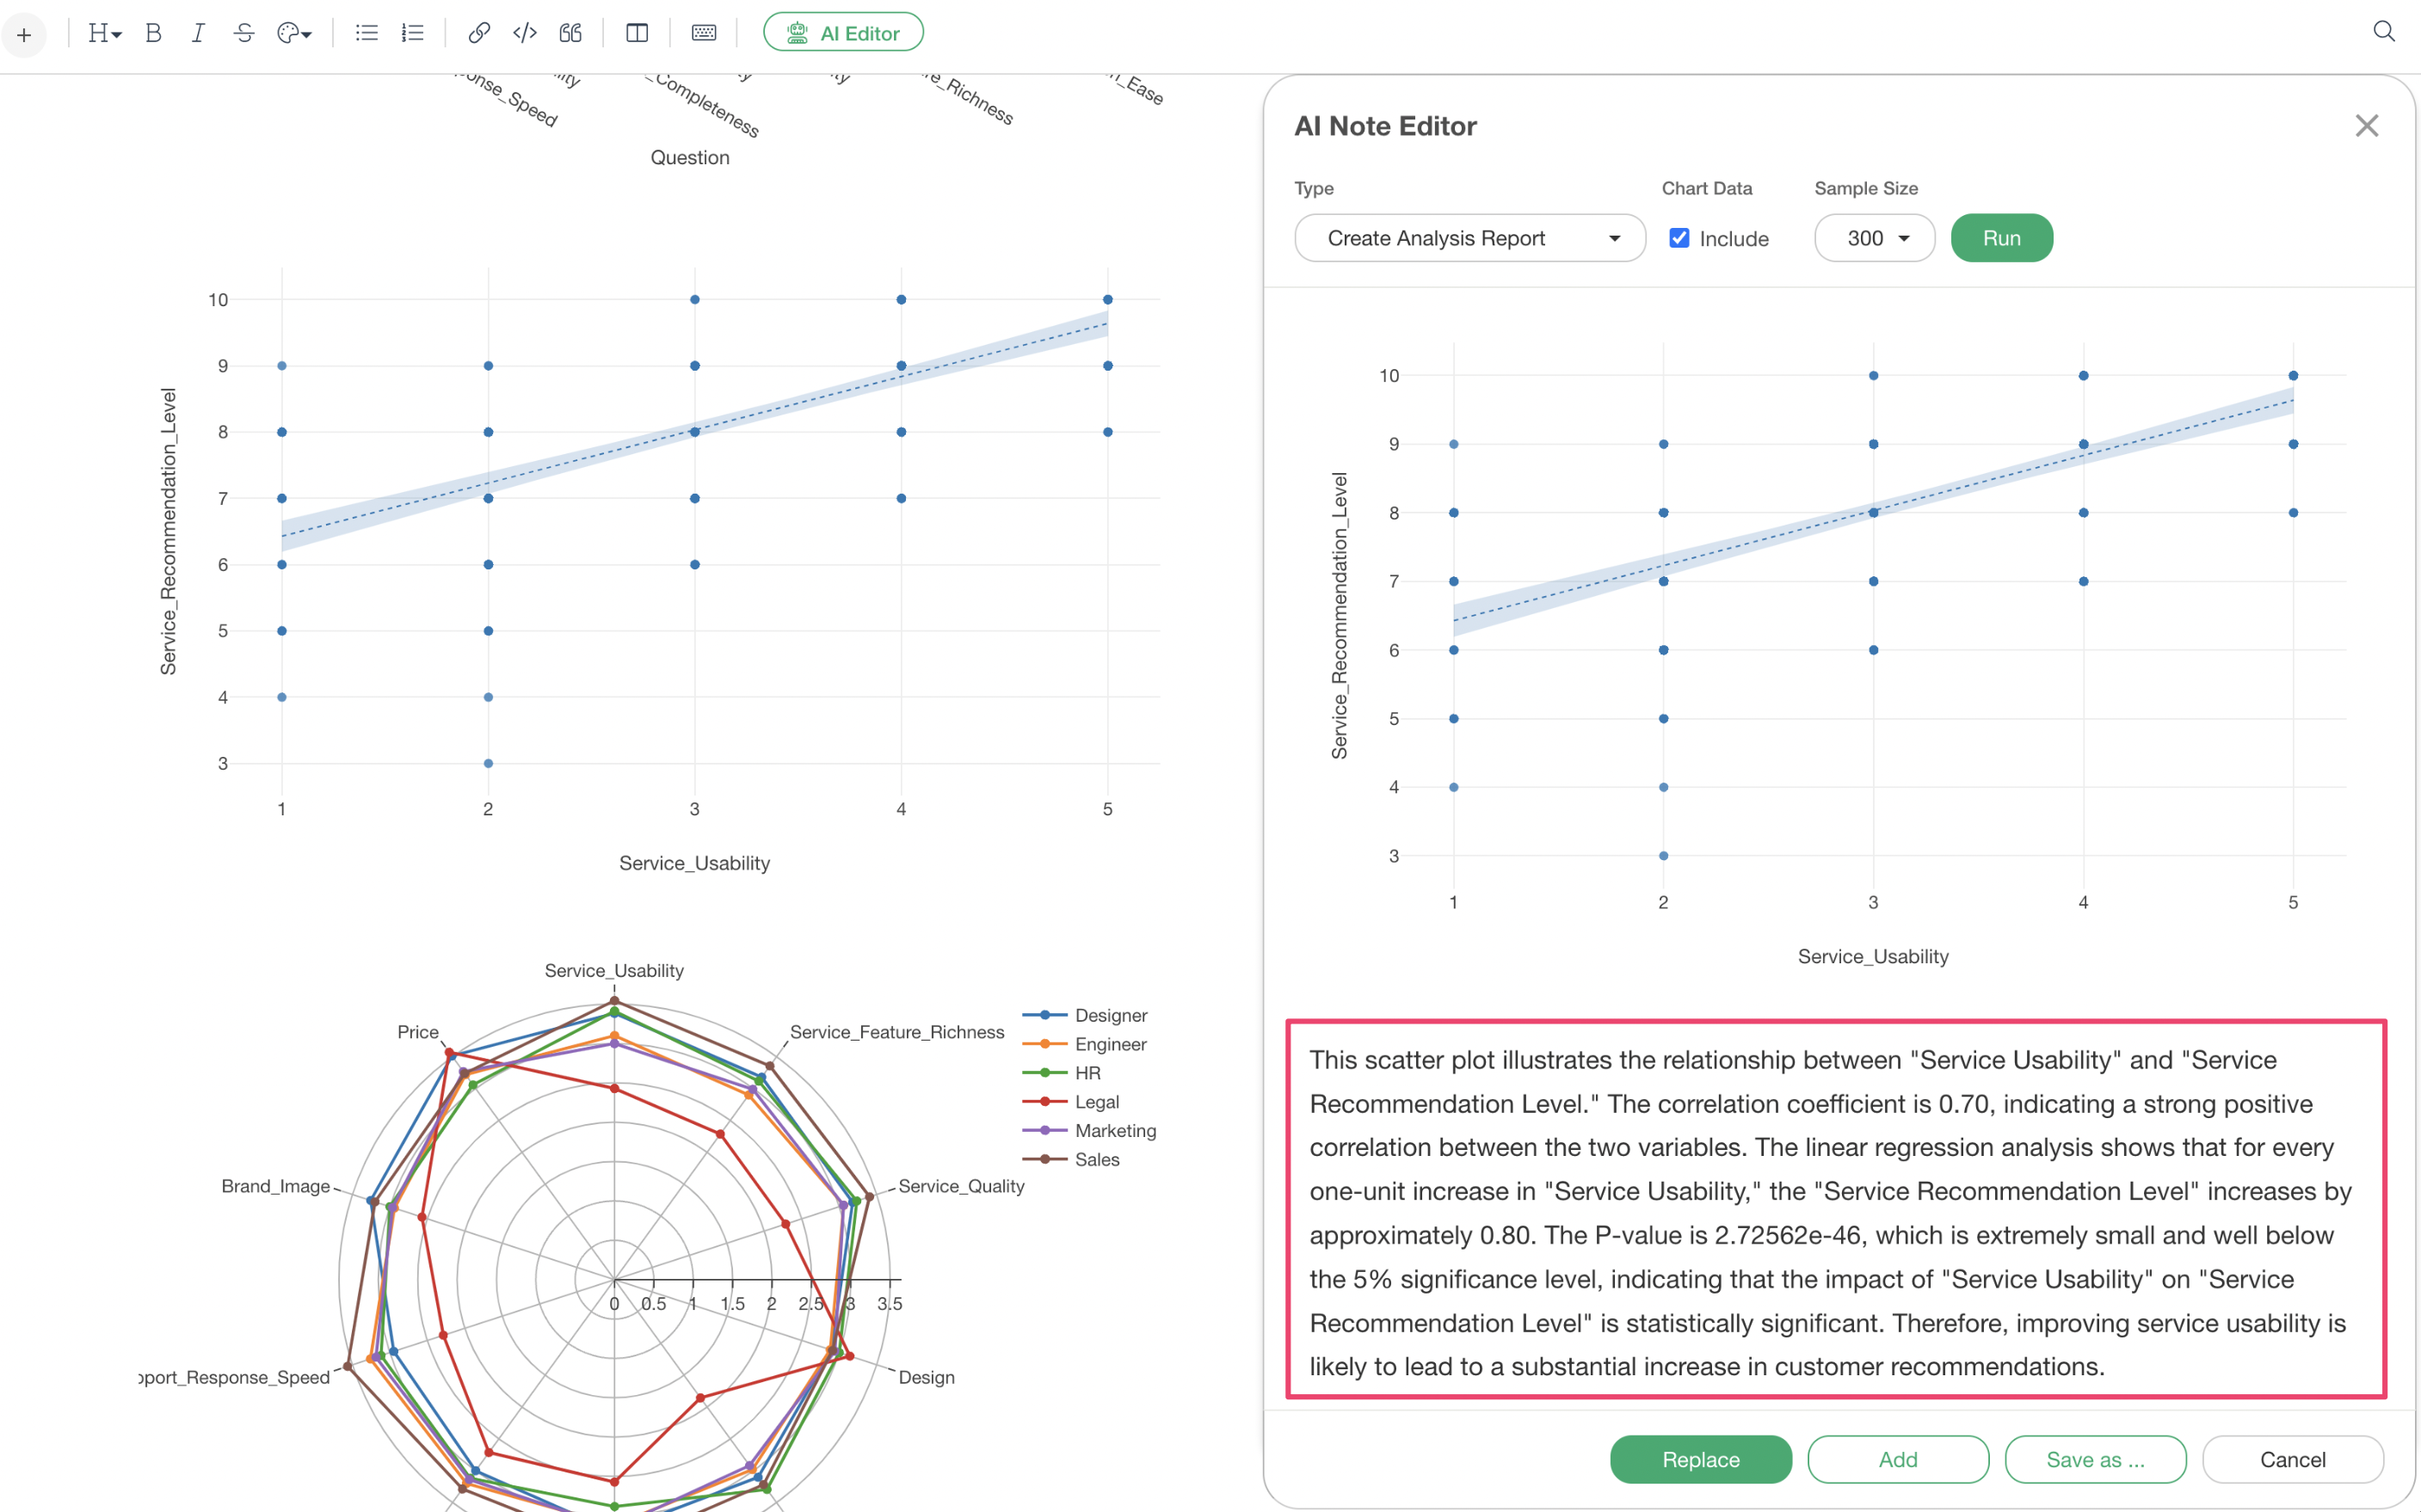
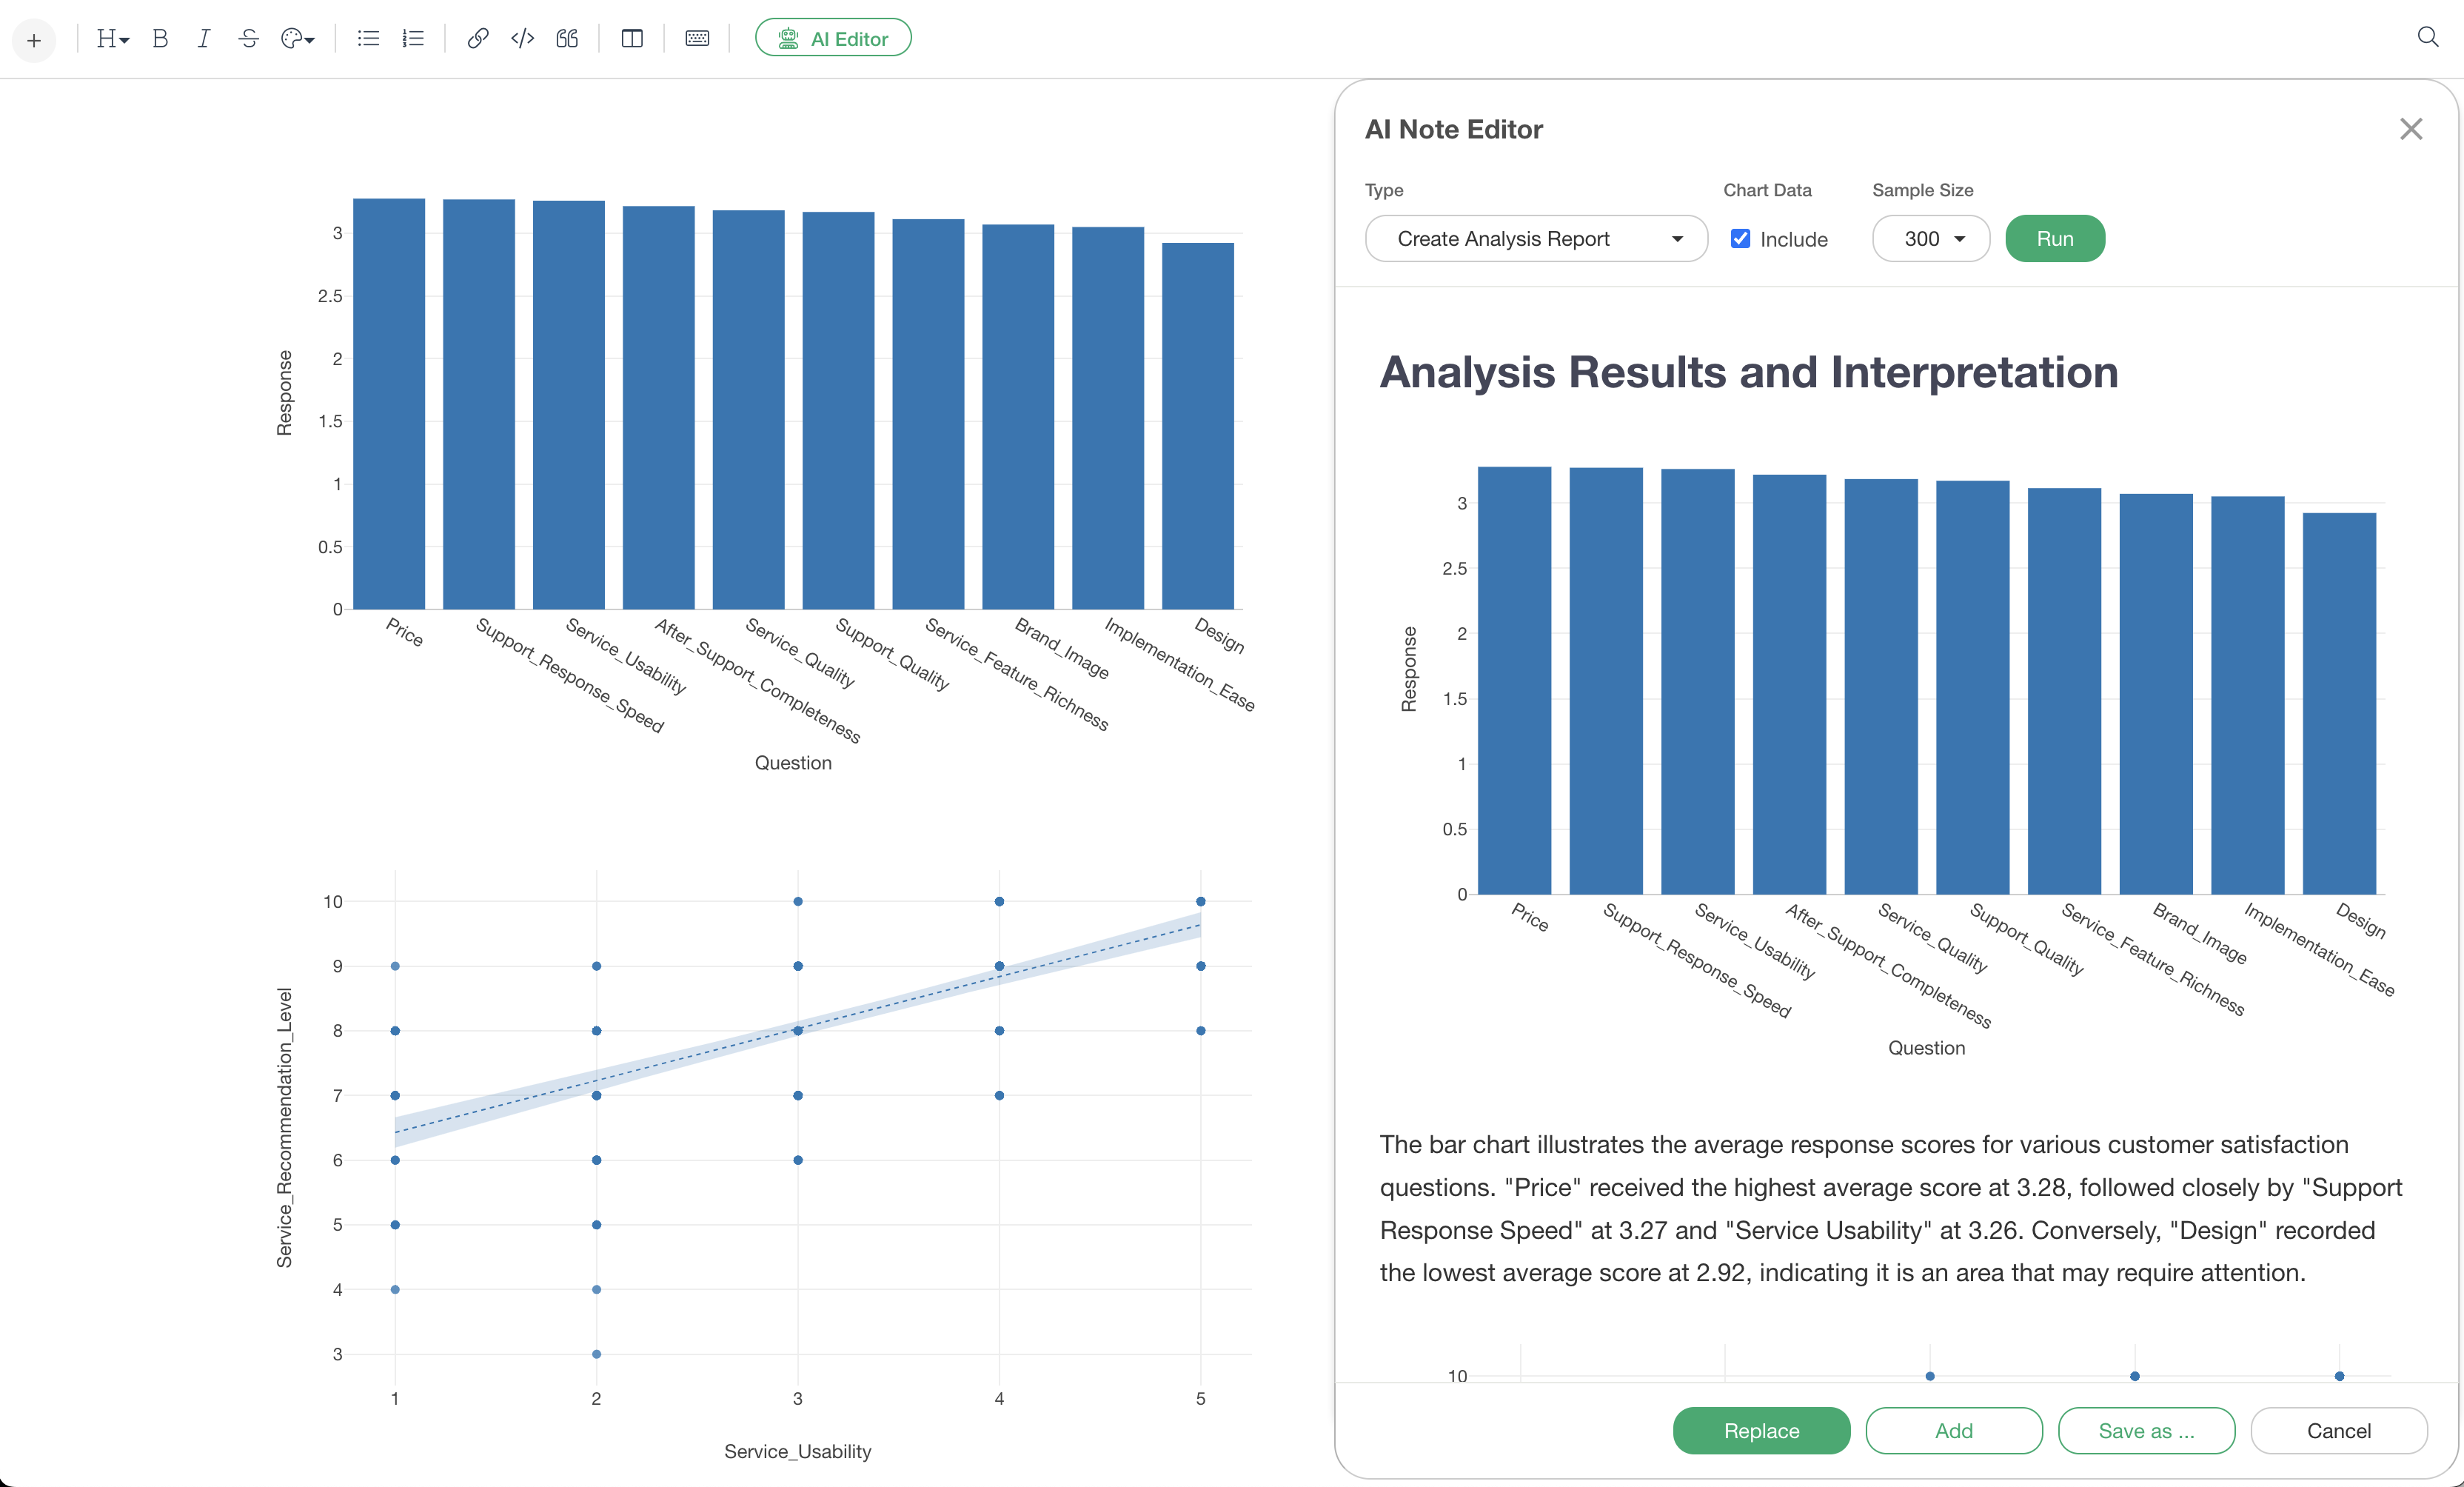
Furthermore, below each chart, insights derived from that chart are output in text format. This eliminates the need for users to write their own interpretations of the charts.
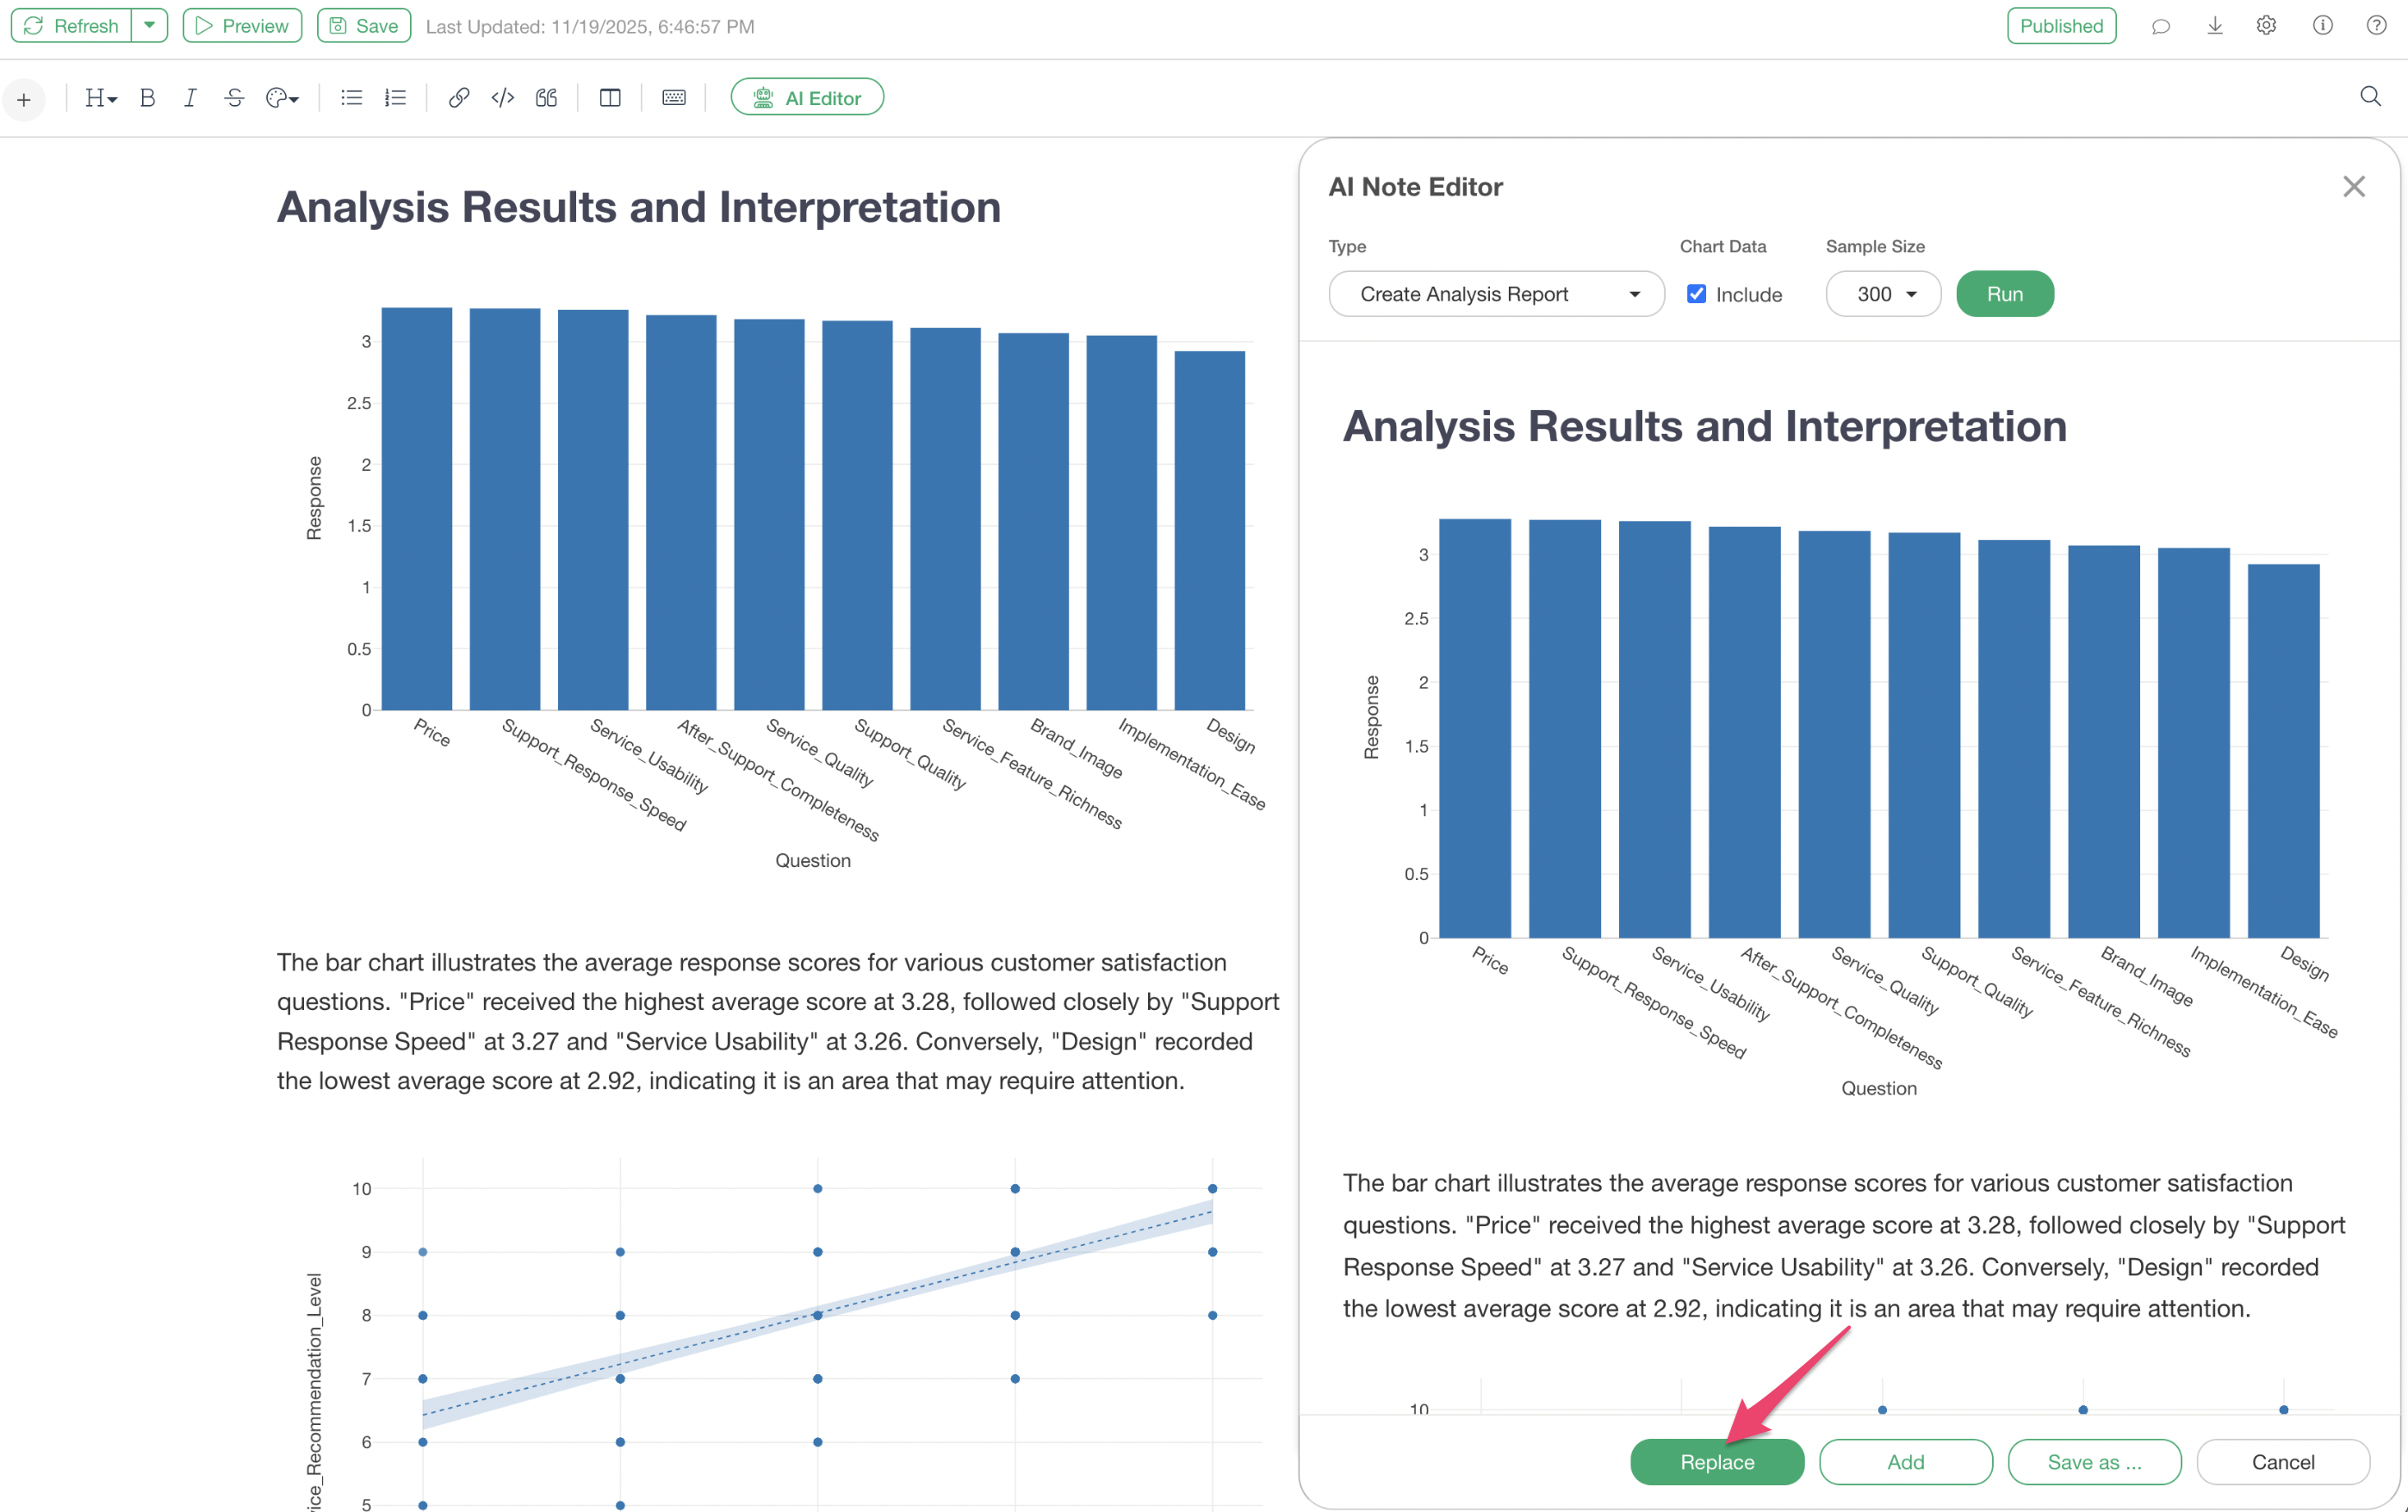
The generated report can be replaced with the original note content by pressing the “Replace” button. This allows for further in-depth analysis and discussion based on the AI-generated report, including chart interpretations.
Summary
The AI Note Editor is a powerful feature that not only dramatically streamlines the analysis report creation process in Exploratory but also facilitates chart interpretation.
By automatically generating full-fledged analysis reports and detailing insights derived from charts, it provides an environment where data analysts can focus on the essential tasks of understanding data and discovering insights.
This reduces the burden of report creation and enables higher quality decision-making.
Would you like to experience it now?
Experience the efficiency of report creation and chart interpretation in data analysis through new features like the AI Note Editor.
If you are not yet using Exploratory, you can try it with a 30-day free trial.