
How to Calculate Fn Conversion Rate with AI Prompt
Fn conversion rate (where F stands for funnel and n represents the number) is an important metric for measuring customer purchase continuity. In particular, there are two types of this metric, each providing different insights:
- Conversion rate from the first purchase (cumulative Fn conversion rate): Shows the percentage of customers who made their nth purchase relative to first-time buyers (F1). For example, if 300 out of 1,000 first-time buyers made a second purchase, the F2 conversion rate is 30%.
- Conversion rate from the previous purchase (direct Fn conversion rate): Shows the percentage of customers who made their nth purchase relative to those who made their (n-1)th purchase. For example, if 150 out of 300 second-time buyers made a third purchase, the F2→F3 conversion rate is 50%.
These metrics allow you to understand in detail at which purchase stage customer churn occurs and how efficient the conversion is between each stage.
Utilizing Fn Conversion Rate (F2 Conversion Rate)
Fn conversion rate can be utilized as a powerful metric, especially in business models where building continuous customer relationships is important.
Marketing Managers for Direct-to-Consumer Brands
For marketing managers of direct-to-consumer brands, the cumulative Fn conversion rate is an important metric for optimizing customer nurturing strategies after acquisition.
For example, if the conversion rate from F1 to F2 is 20% and from F1 to F3 is 18%, it becomes clear that there are challenges in follow-up after the first purchase. This weakness can be improved by strengthening special follow-up emails or reminders for first-time buyers.
CRM Strategy Specialists
For professionals responsible for CRM strategy, Fn conversion rate is an important metric for measuring the effectiveness of customer nurturing programs.
By analyzing conversion rates at each purchase stage, you can determine which stage of the customer lifecycle to focus resources on. Additionally, comparing cumulative Fn conversion rates across customer segments can help identify customer segments that are particularly easy to nurture.
Calculating Fn Conversion Rate (F2 Conversion Rate) with AI Prompt
This time, we’ll execute Fn conversion rate using AI Prompt with data where each row represents one order detail.
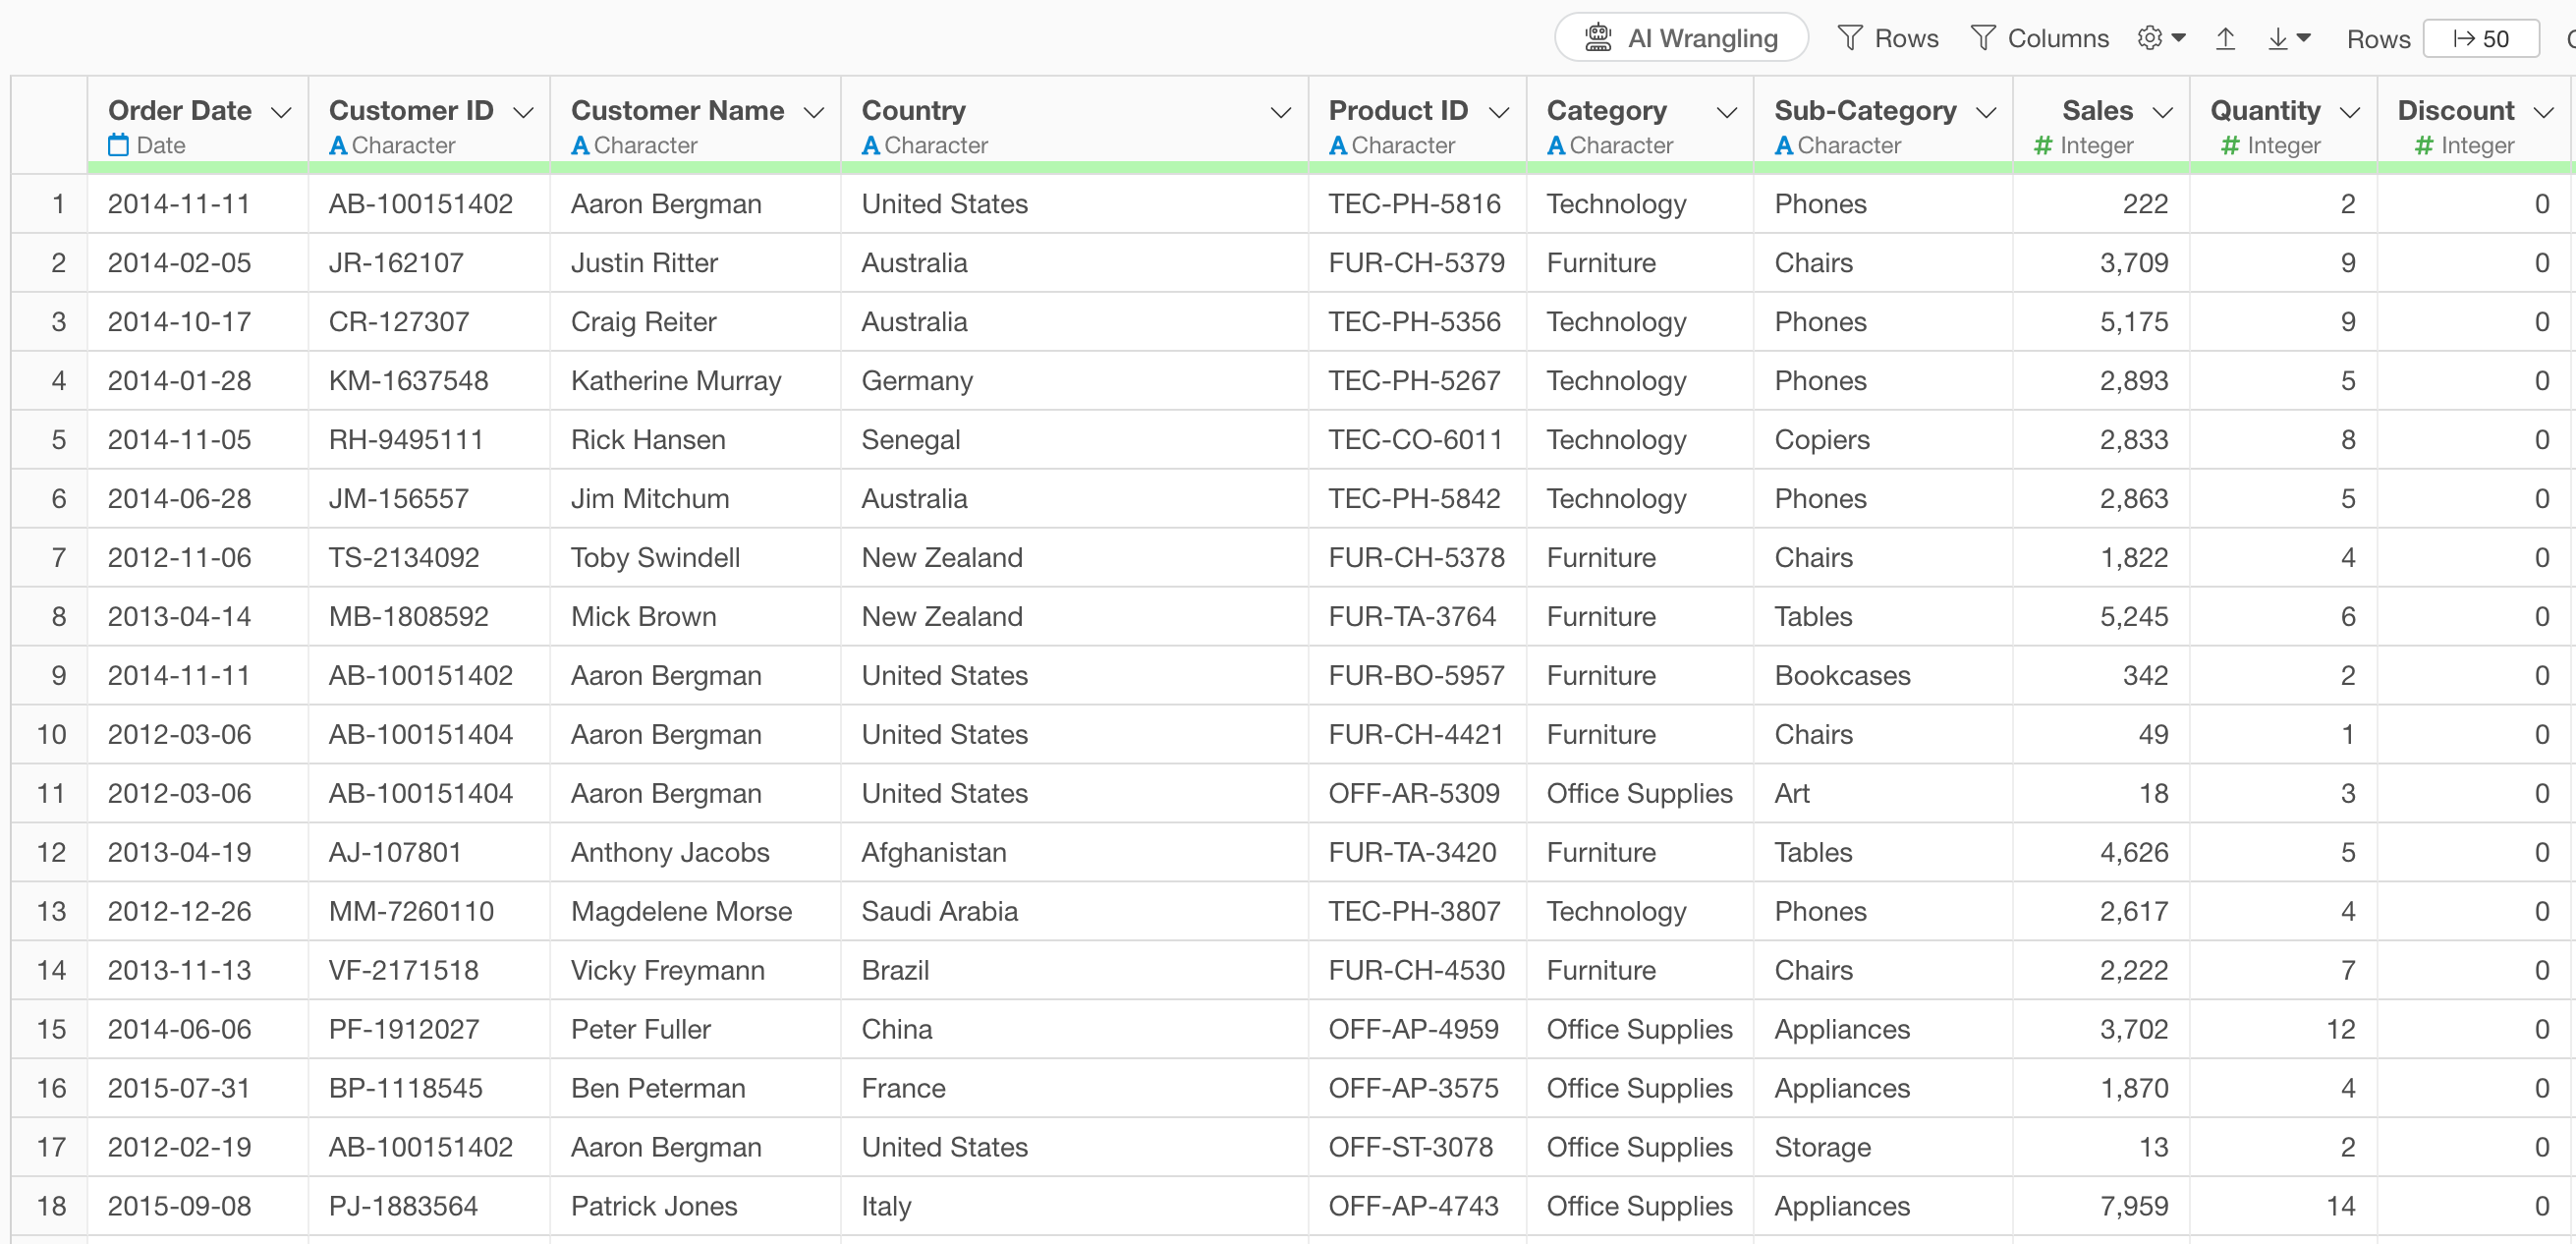
The data includes information such as customer ID, order date, order ID, amount, etc.
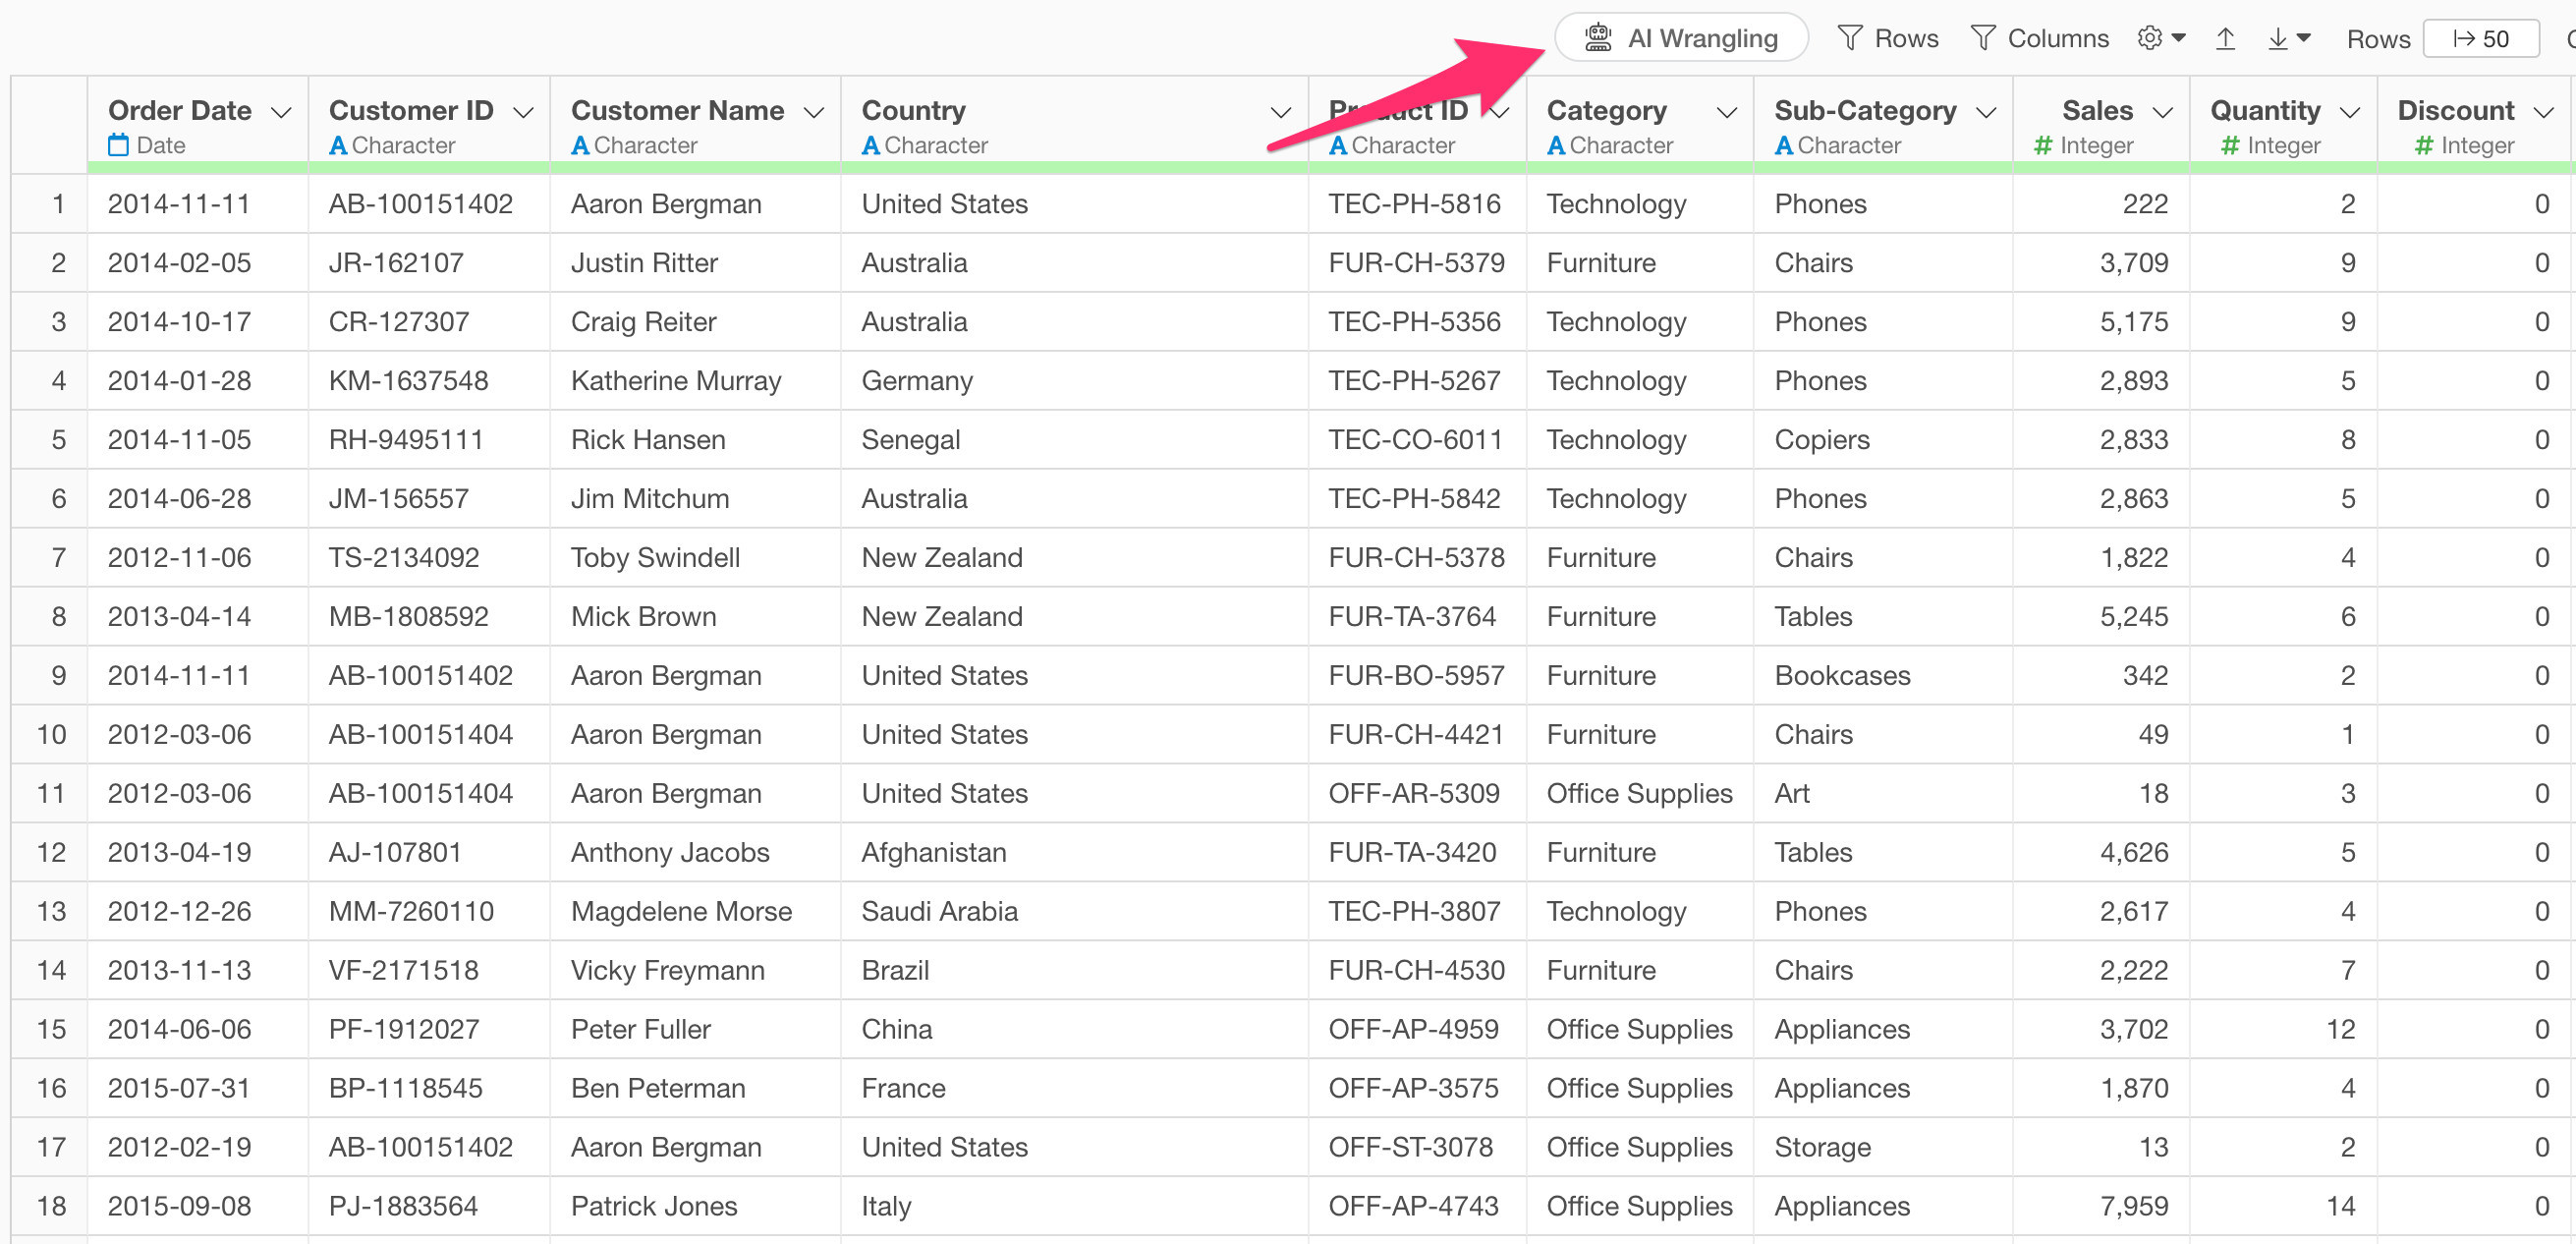
Click the “AI Wrangling” button.
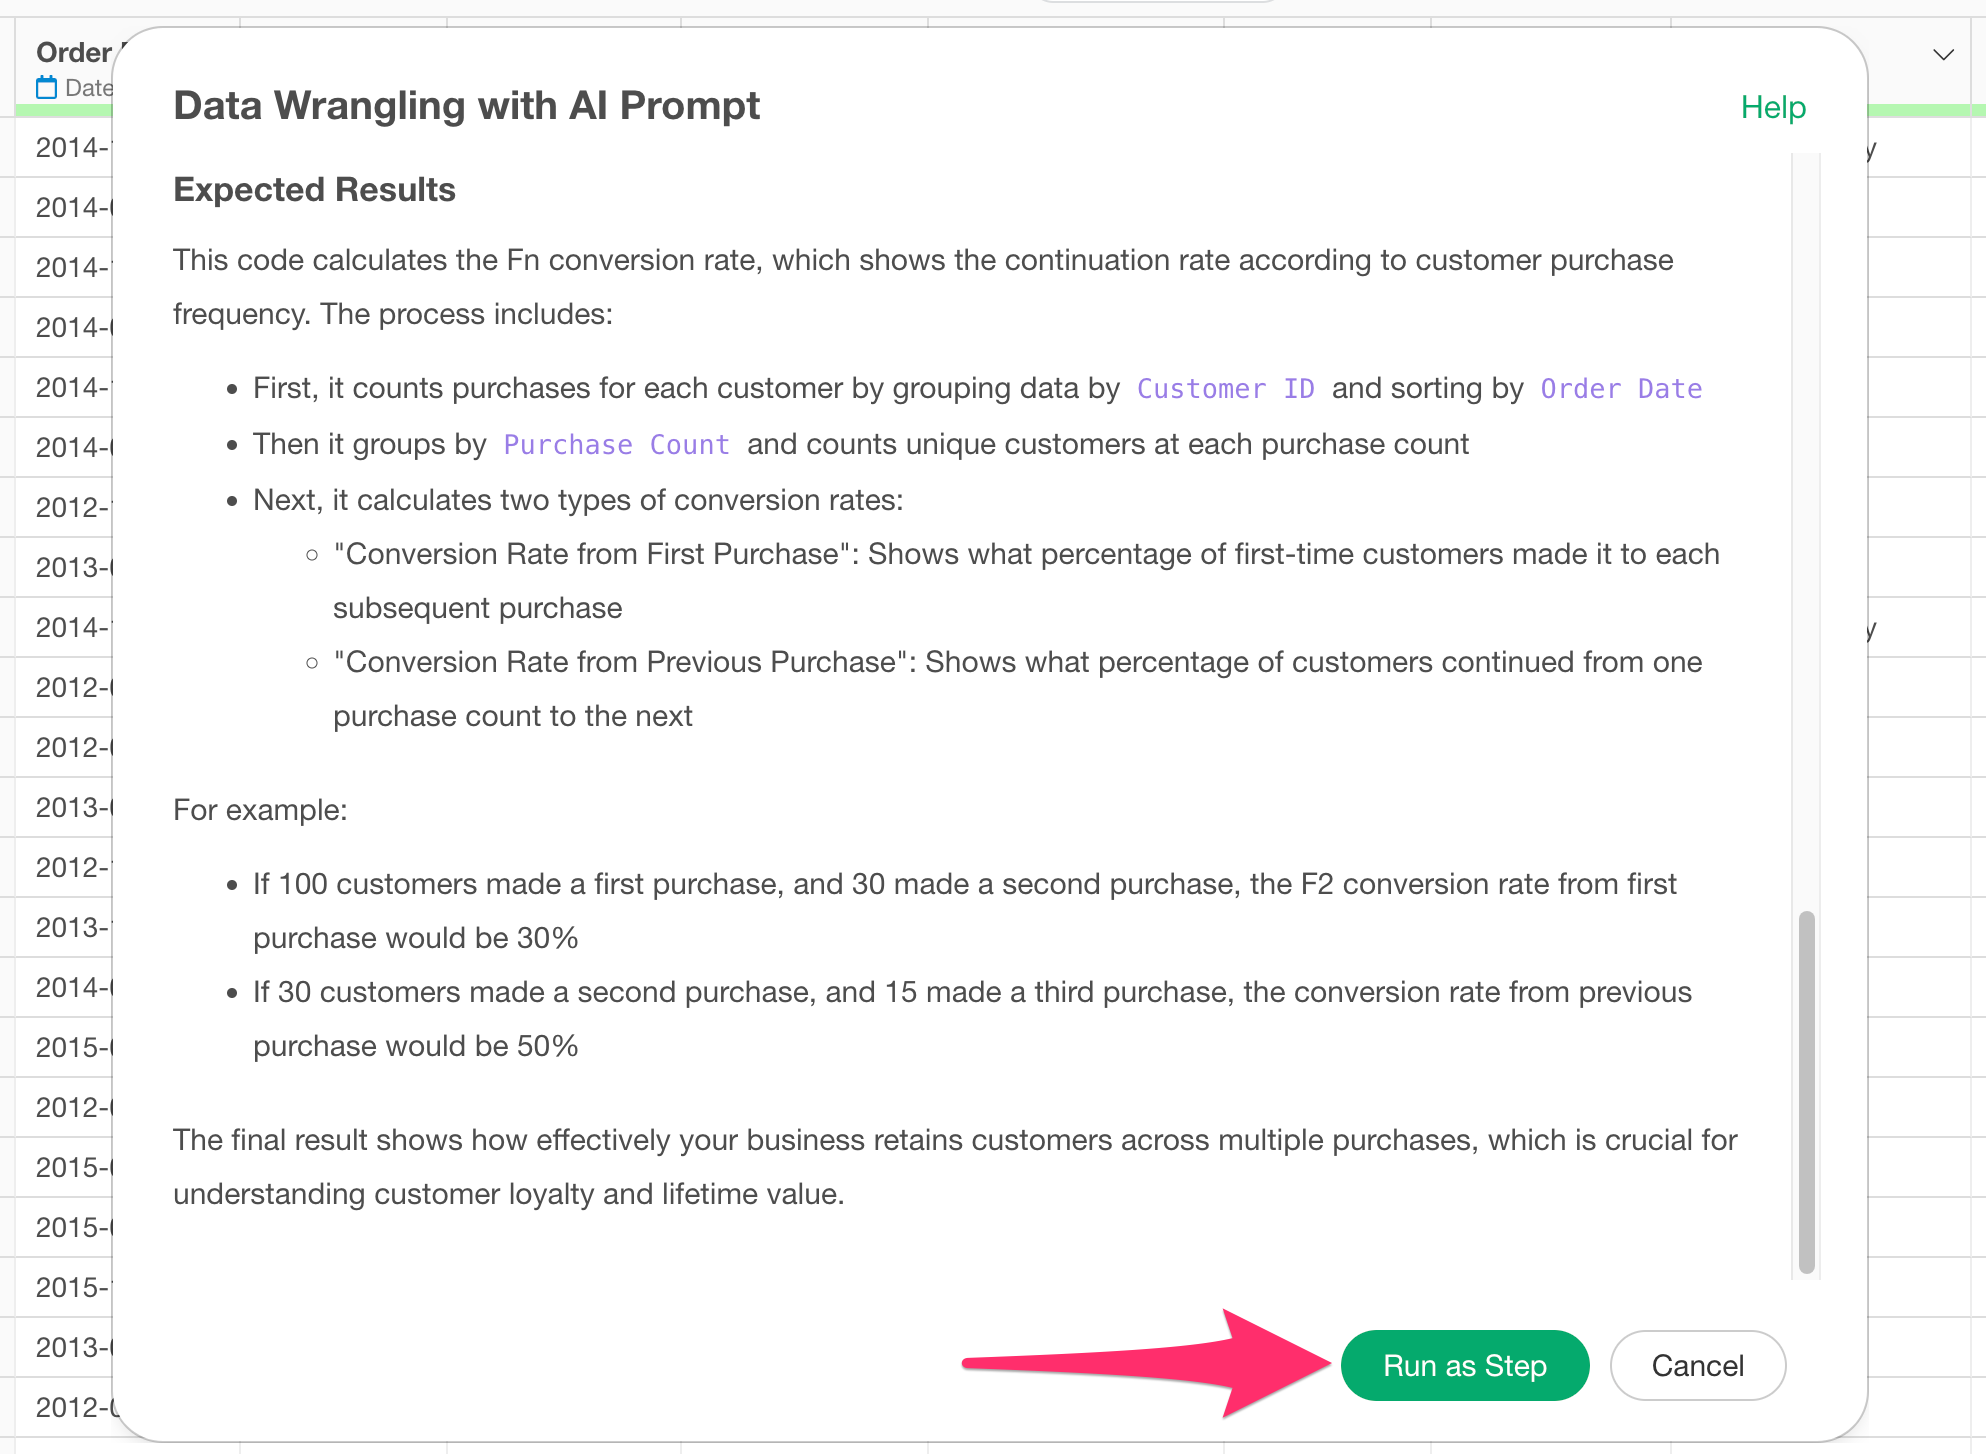
After opening the AI Prompt dialog, enter the following text and execute:
Calculate Fn conversion rate
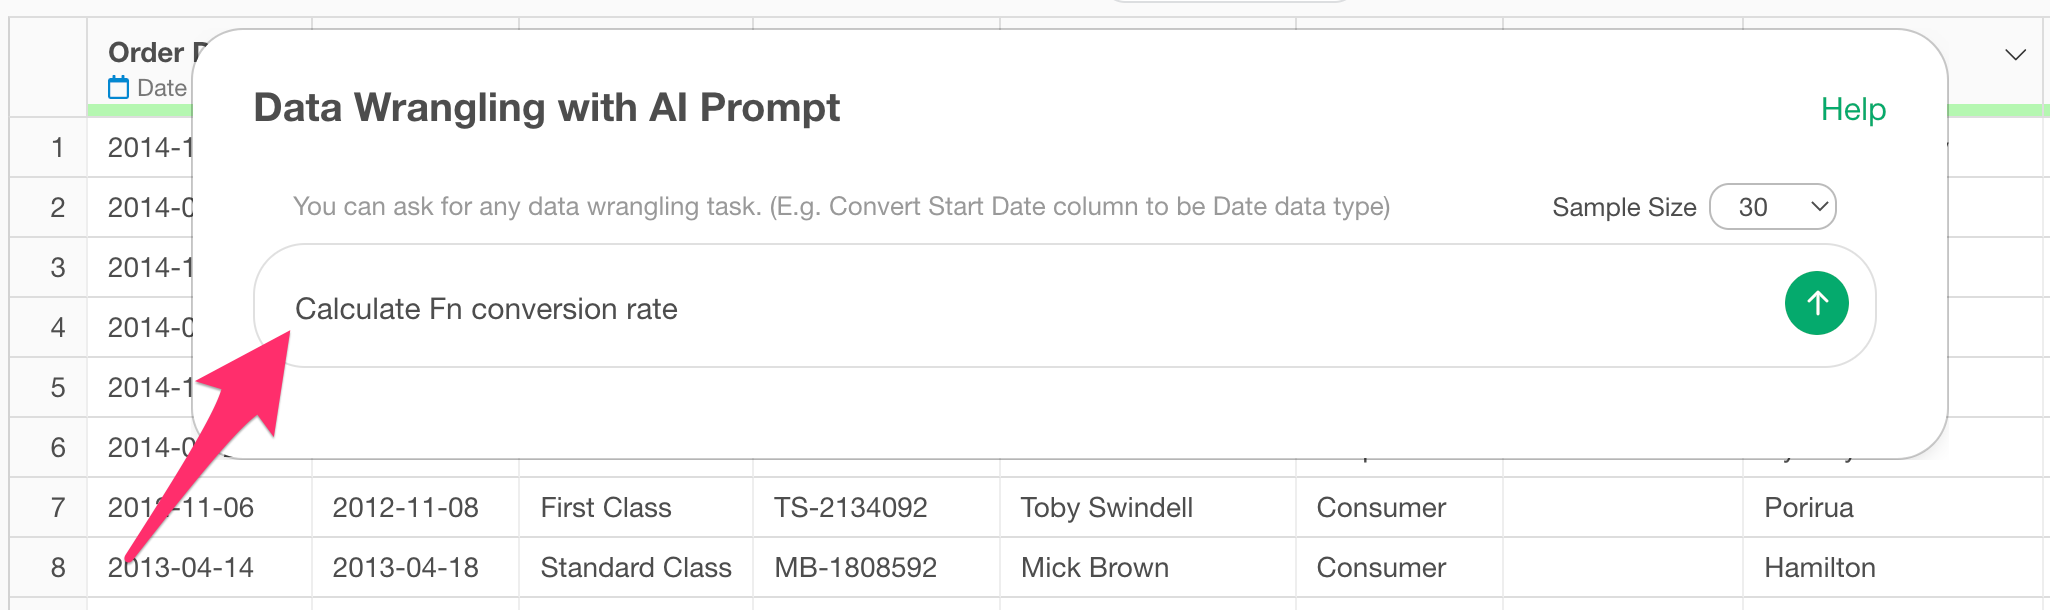
This generates code to calculate the cumulative Fn conversion rate.
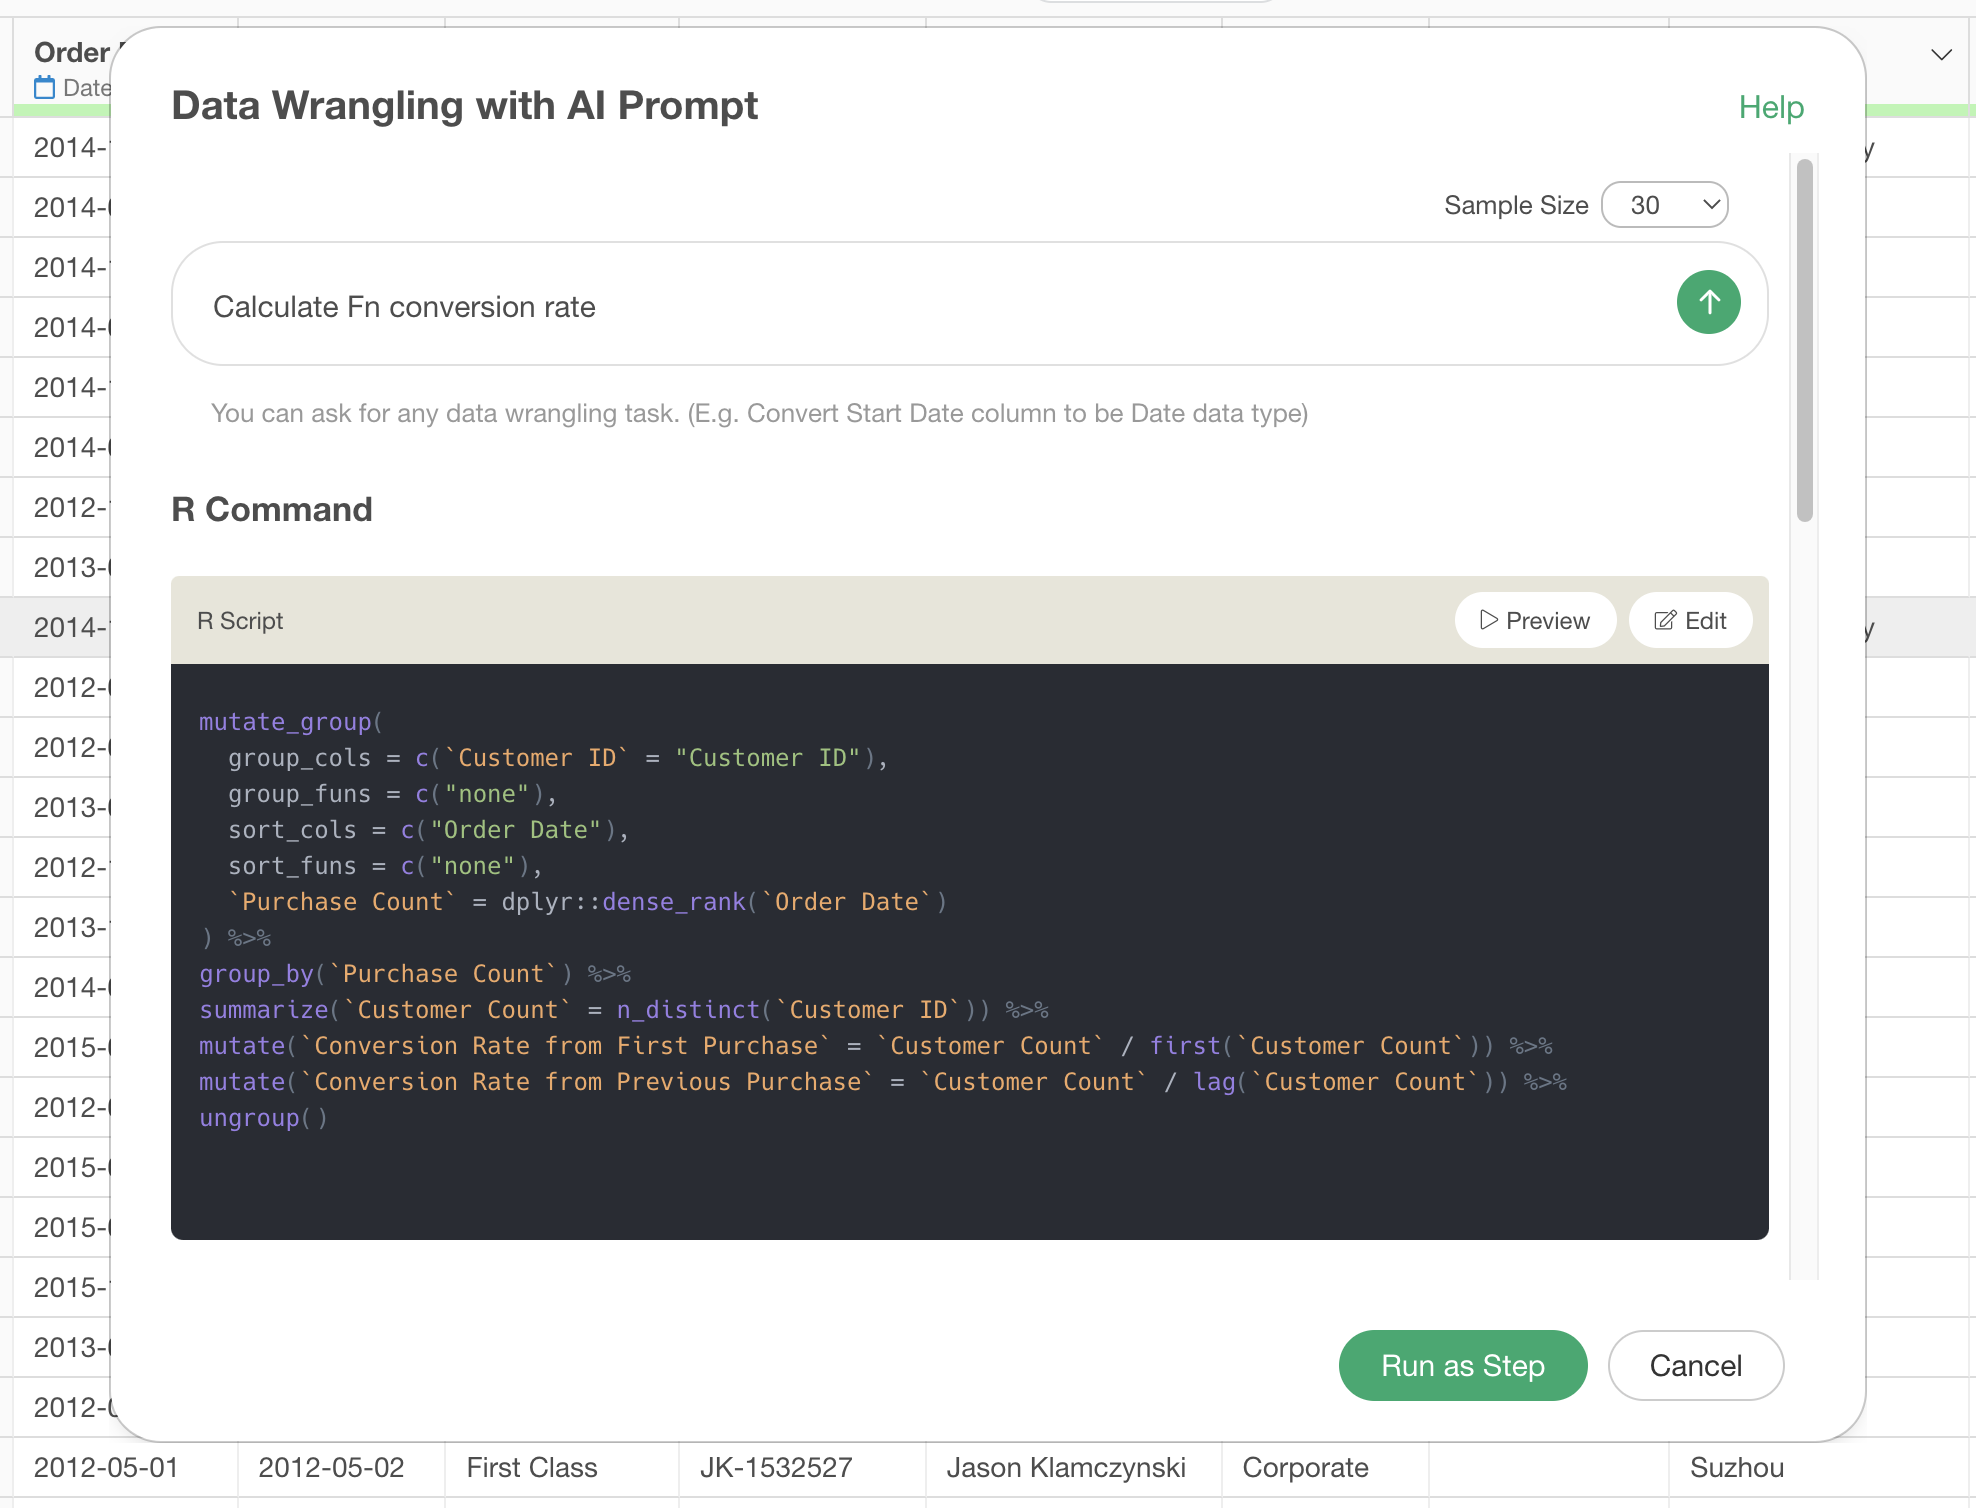
Check the explanation of the functions used and the expected results, confirm that the cumulative Fn conversion rate will be calculated appropriately, and click the execute button to run the step.
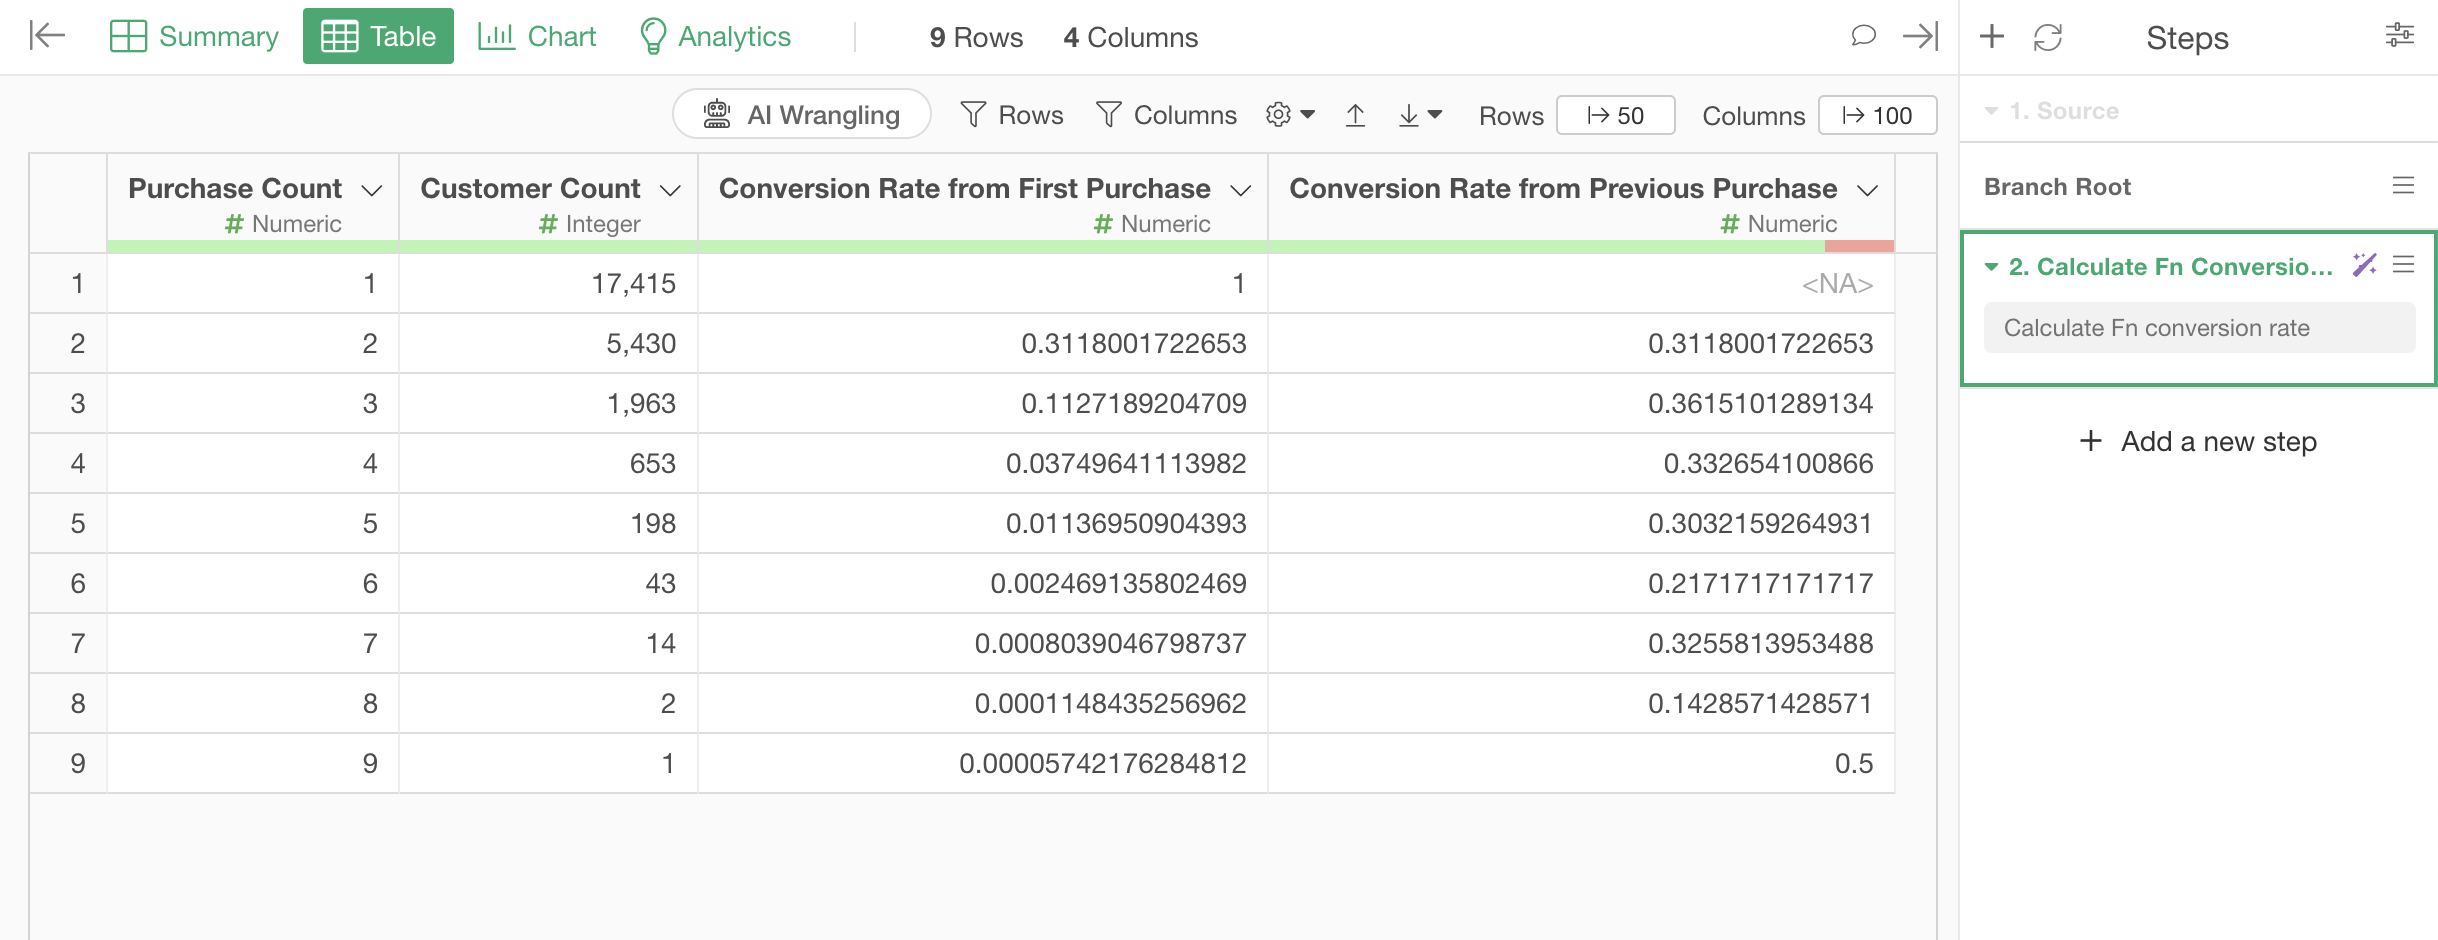
The step is added and we’ve successfully calculated the cumulative Fn conversion rate (repeat rate).
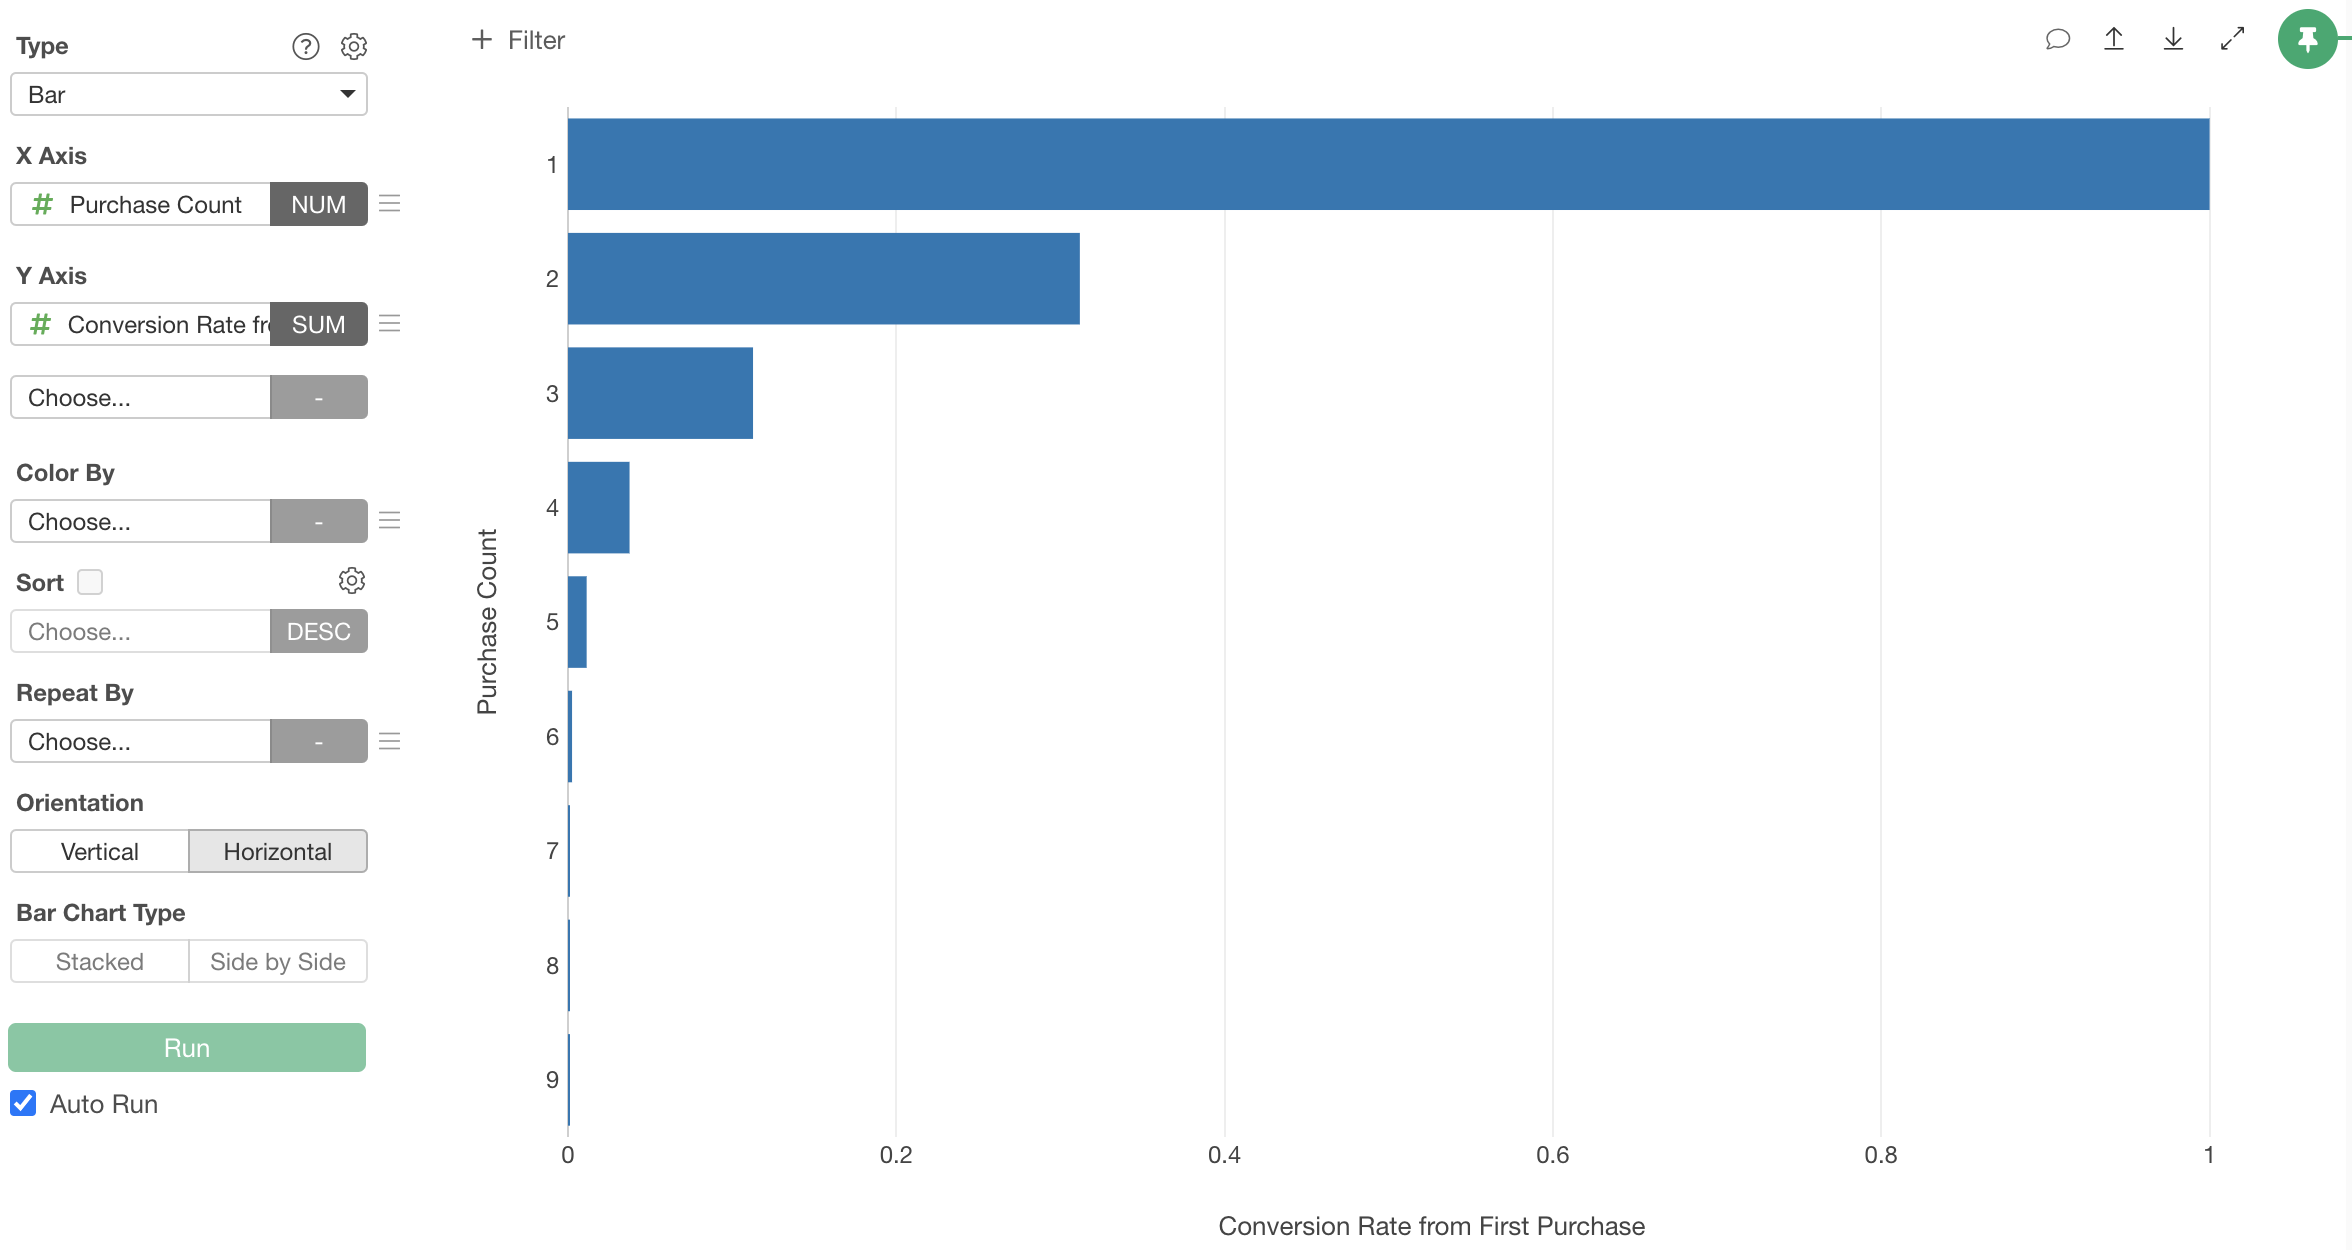
You can then visualize this with a bar chart or line chart by setting the X-axis to purchase frequency (F1, F2, F3…) and the Y-axis to repeat rate (%).
Summary
In this article, we introduced how to analyze cumulative Fn conversion rate (F2 conversion rate) using Exploratory’s AI feature “AI Prompt.”
Previously, calculating cumulative Fn conversion rate required knowledge of data processing methods and the skills to implement them. With Exploratory, you can quickly create such analytical charts simply by giving instructions in natural language!
If you haven’t used Exploratory before, please try the 30-day free trial!