How to do ABC Analysis with AI Prompt
ABC analysis is an analytical method that classifies targets of interest such as customers or products into three ranks (A, B, C) based on specific evaluation criteria (e.g., sales, shipment volume).
For example, when performing ABC analysis on customer sales, you calculate the cumulative sales ratio starting from customers with the highest sales and divide them into ABC ranks based on arbitrary thresholds.
Generally, the following thresholds are used to divide into three groups. However, these percentages can be freely adjusted according to your purpose.
- Group A: The group that accounts for 70% of the total when adding up sales from the top items.
- Group B: The group following Group A, accounting for approximately 20% of the total.
- Group C: The group following Group B, accounting for approximately 10% of the total.
Utilizing ABC Analysis
By utilizing ABC analysis, companies can achieve resource optimization and efficiency.
By concentrating limited resources such as time, budget, and personnel on the most important targets (those that contribute significantly to sales or profits), overall business performance can be improved.
For example, Group A receives intensive resource allocation and management, Group B receives standard management, and Group C receives minimized efficient management. This enables both cost reduction and revenue maximization.
Retail and Sales
For product managers and buyers, ABC analysis helps optimize inventory management.
A products (products accounting for 70% of sales) should always have sufficient inventory and be allocated special promotions and prominent display locations. B products should receive moderate attention, and C products should be managed with minimal inventory to reduce costs and maximize profits.
Manufacturing
Production managers can optimize resource allocation in production lines through ABC analysis.
By allocating the highest quality materials and skilled workers to A products, standard resources to B products, and efficient processes to C products, overall production efficiency can be improved.
Service Industry
Customer service department managers can effectively allocate limited resources by classifying customers using ABC analysis.
By assigning dedicated account managers and providing premium services to A customers (customer segments generating 70% of revenue), standard services to B customers, and self-service options to C customers, a balance between customer satisfaction and profitability can be achieved.
Performing ABC Analysis Using AI Prompt
In this example, we’ll use data where each row represents an order line item to perform ABC analysis on sales by product subcategory using AI Prompts.
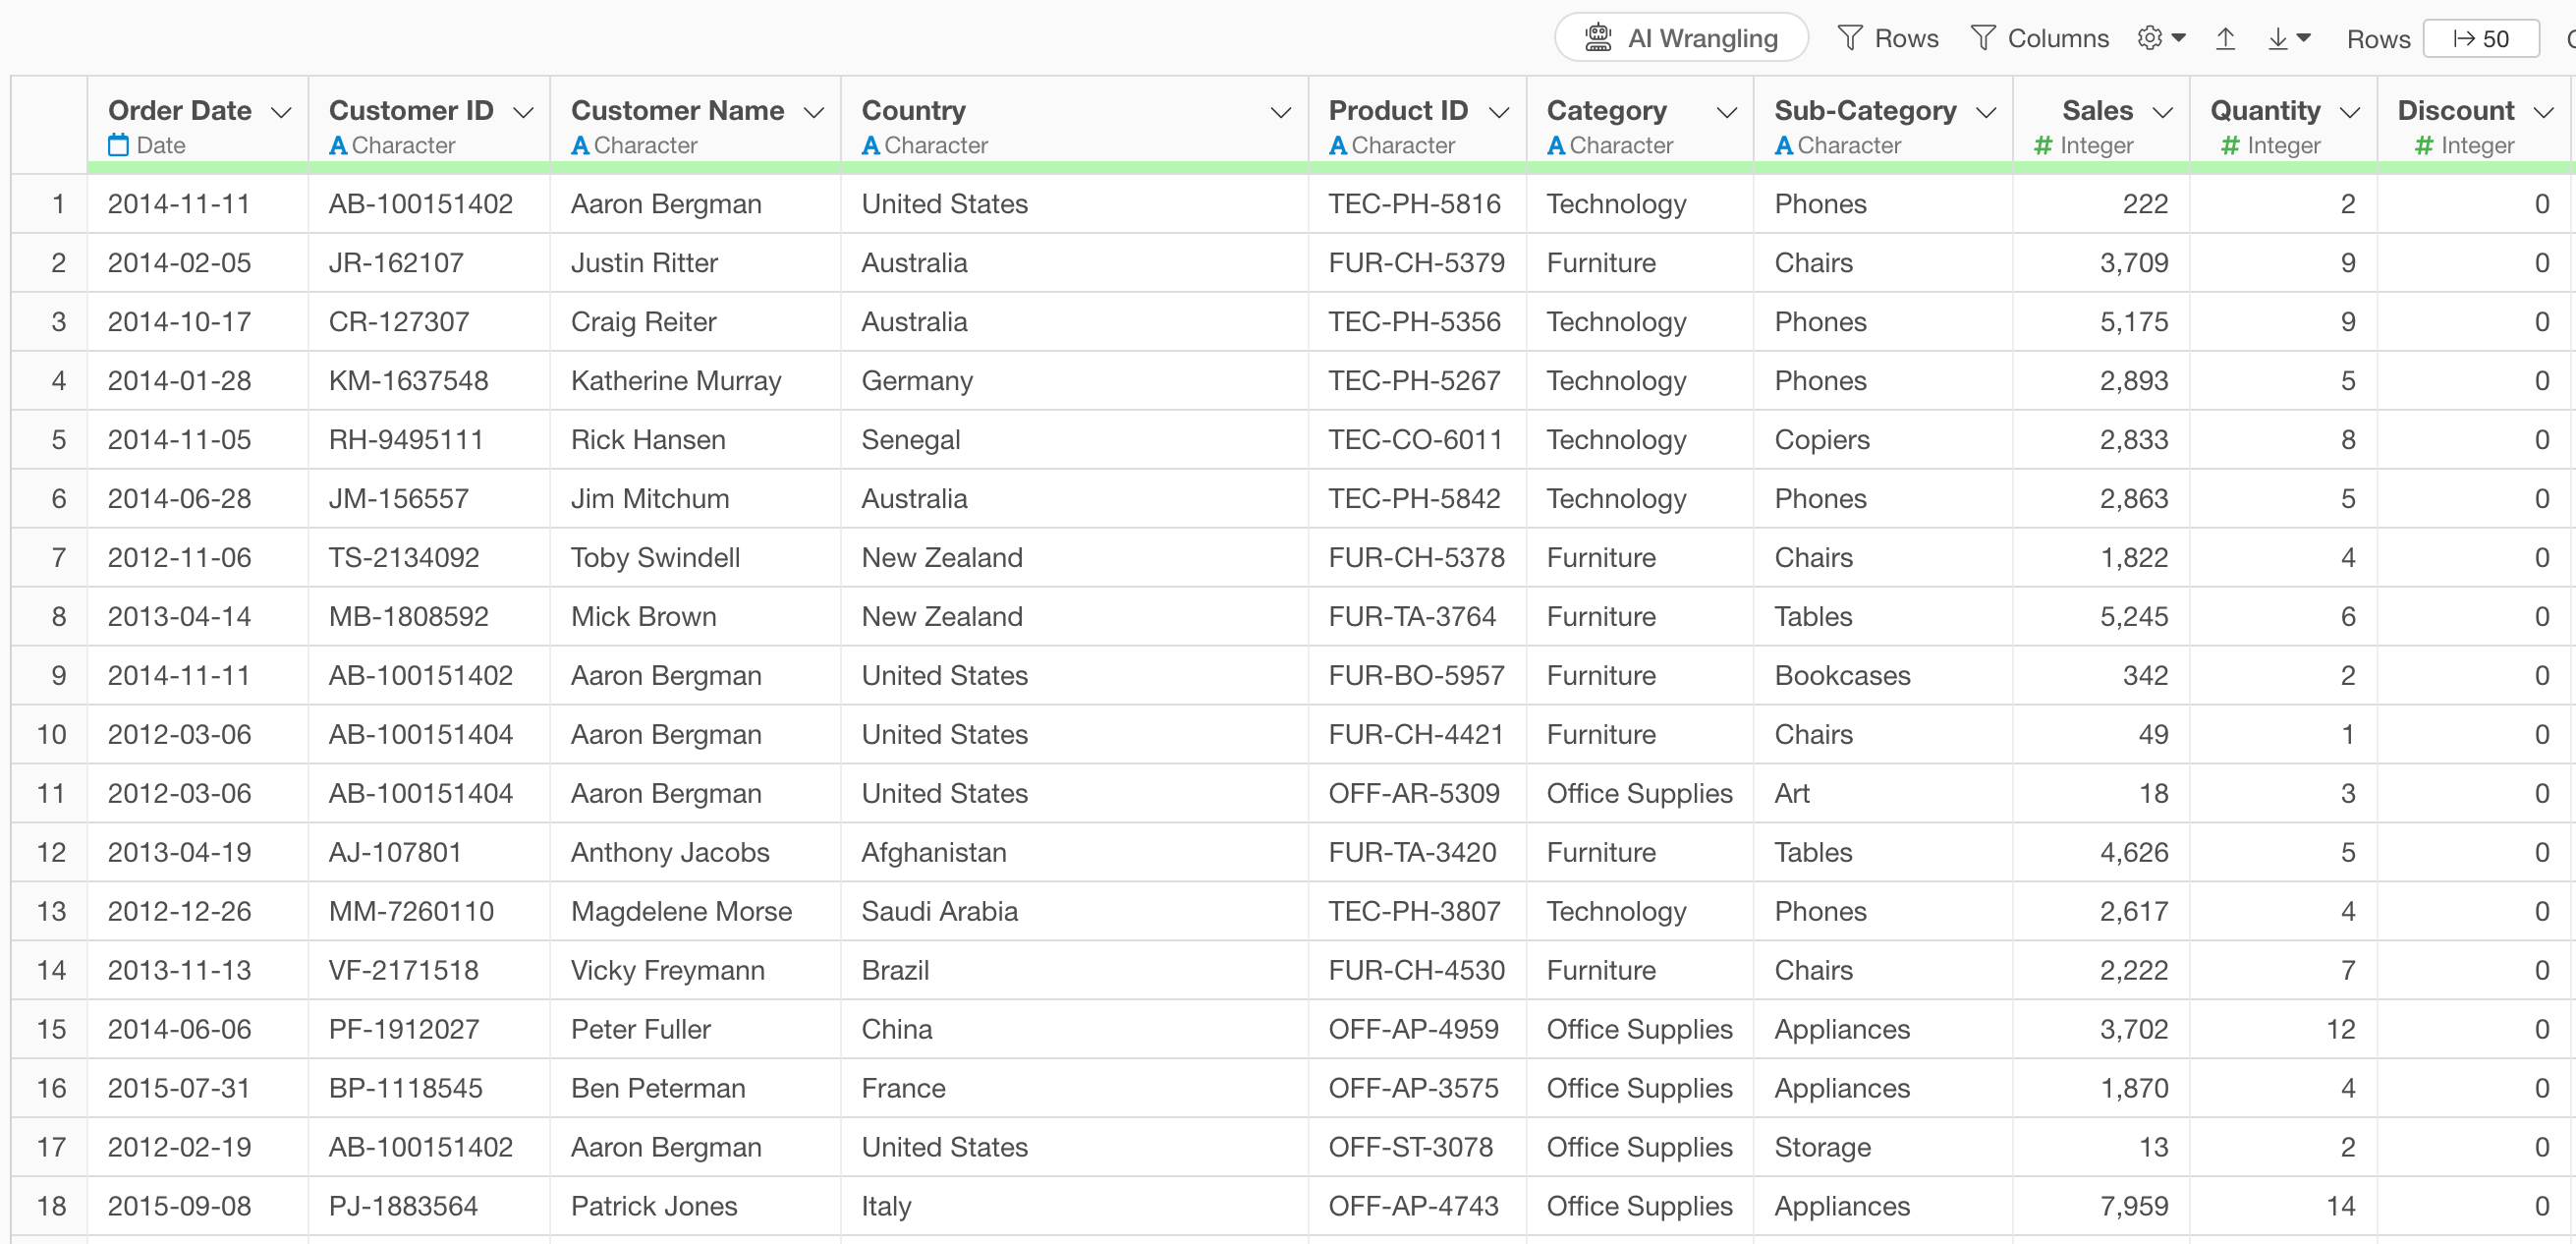
The data includes information such as order date, product category, subcategory, product name, sales, etc.
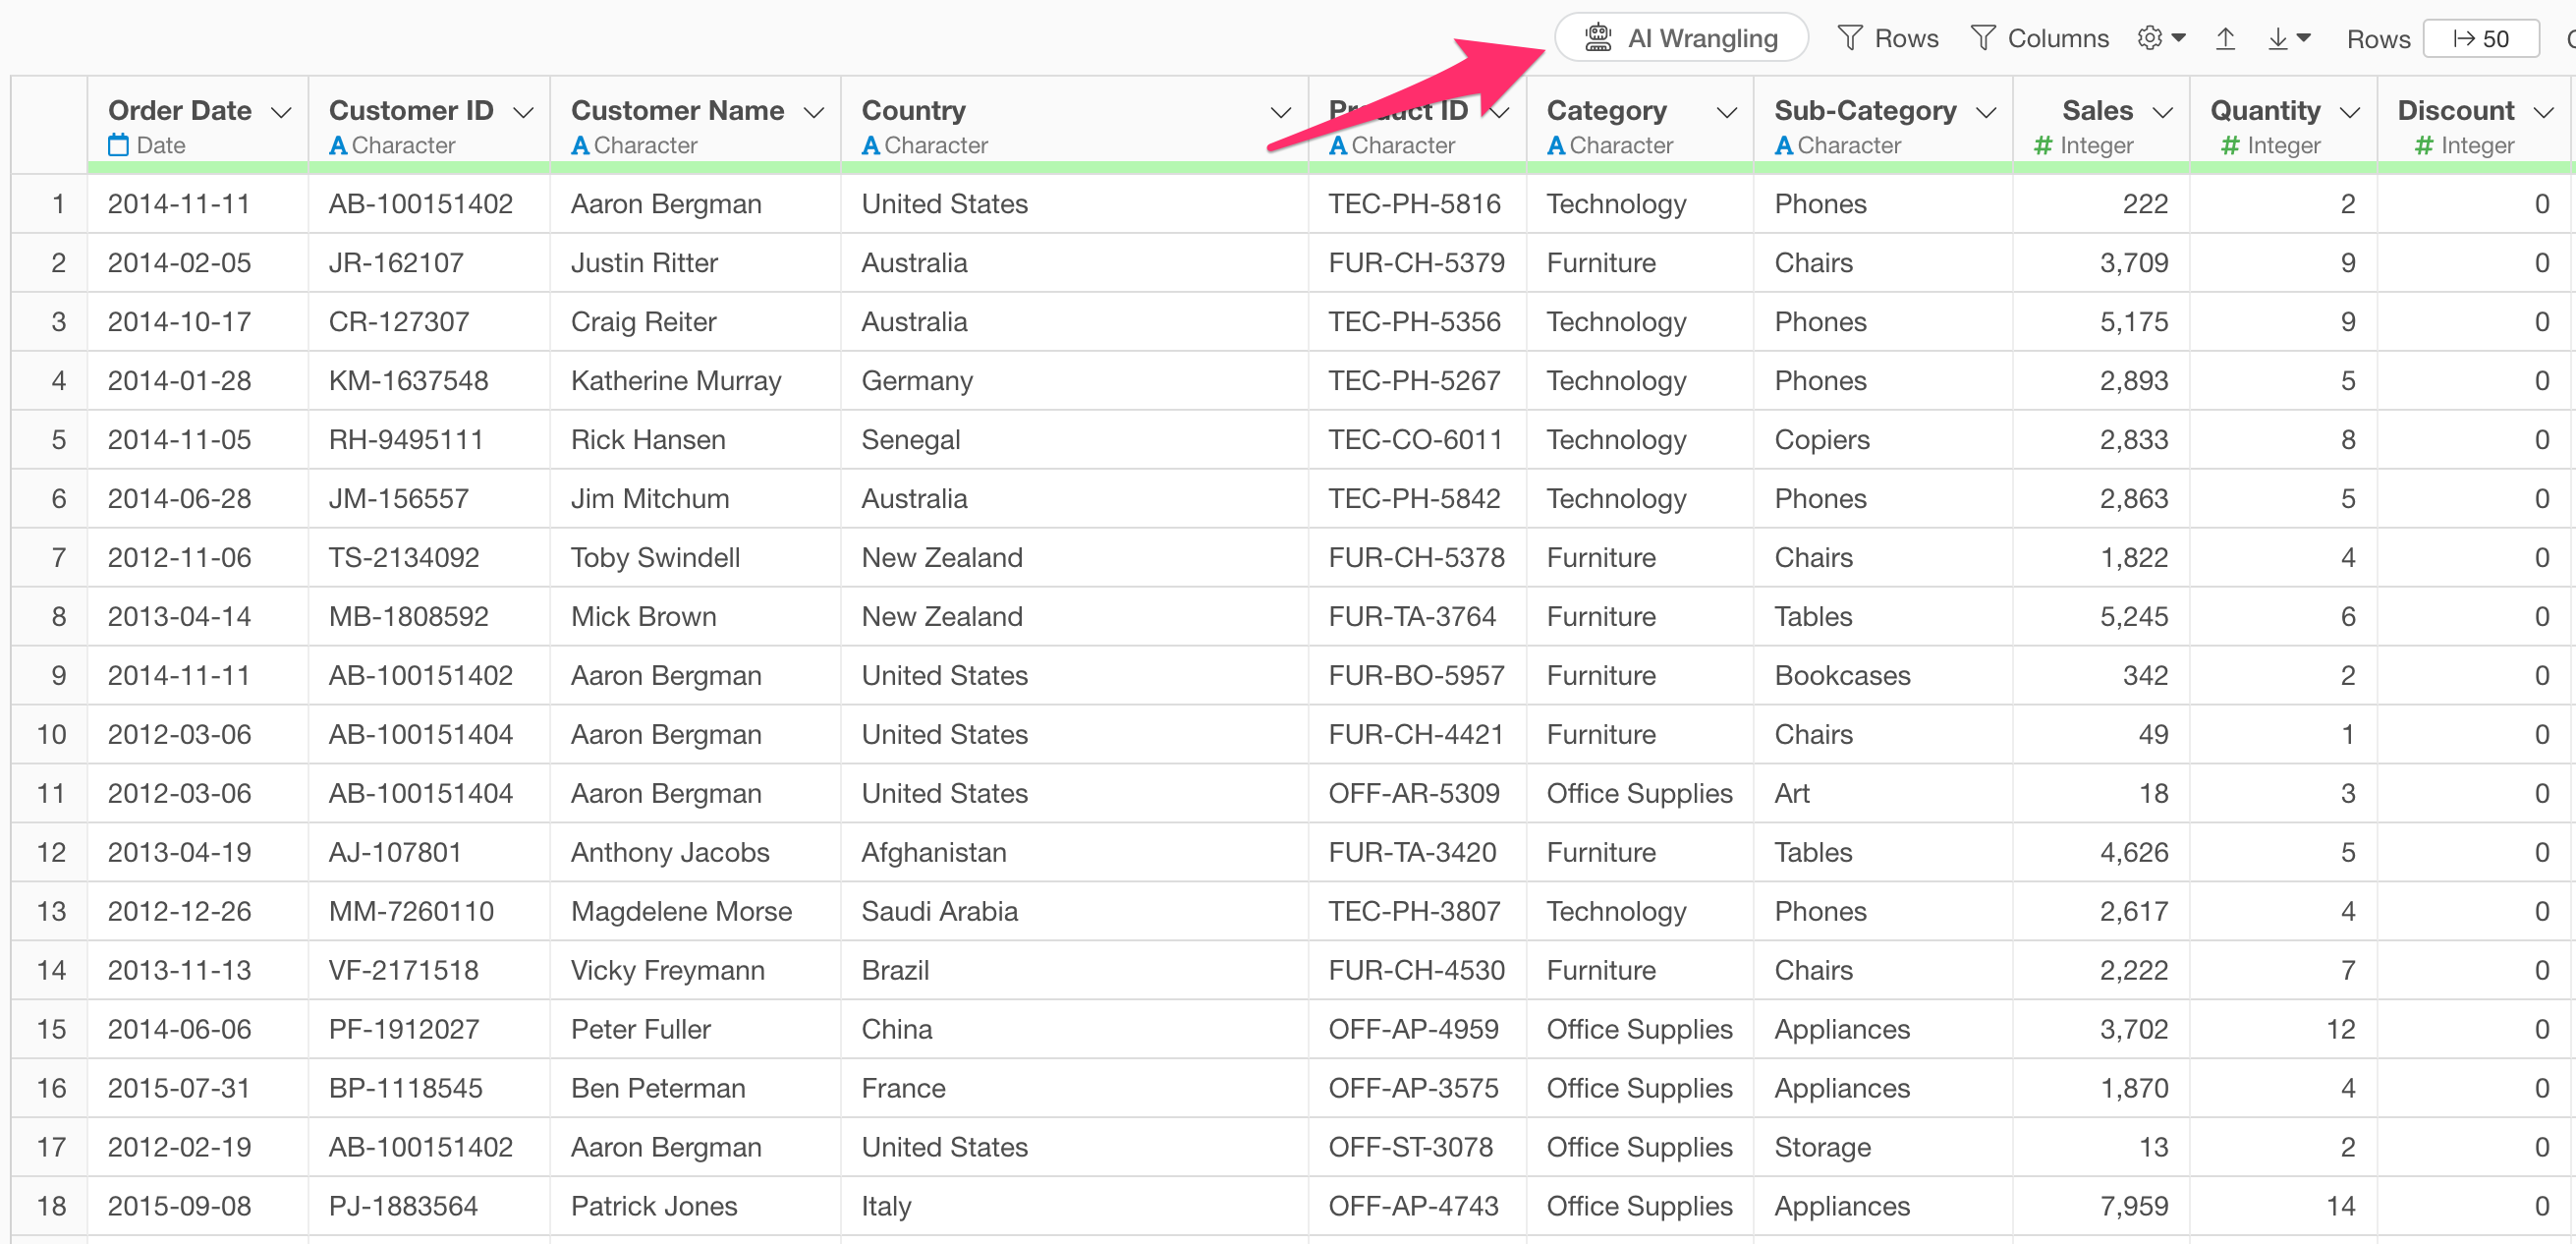
Click the “AI Wrangling” button.
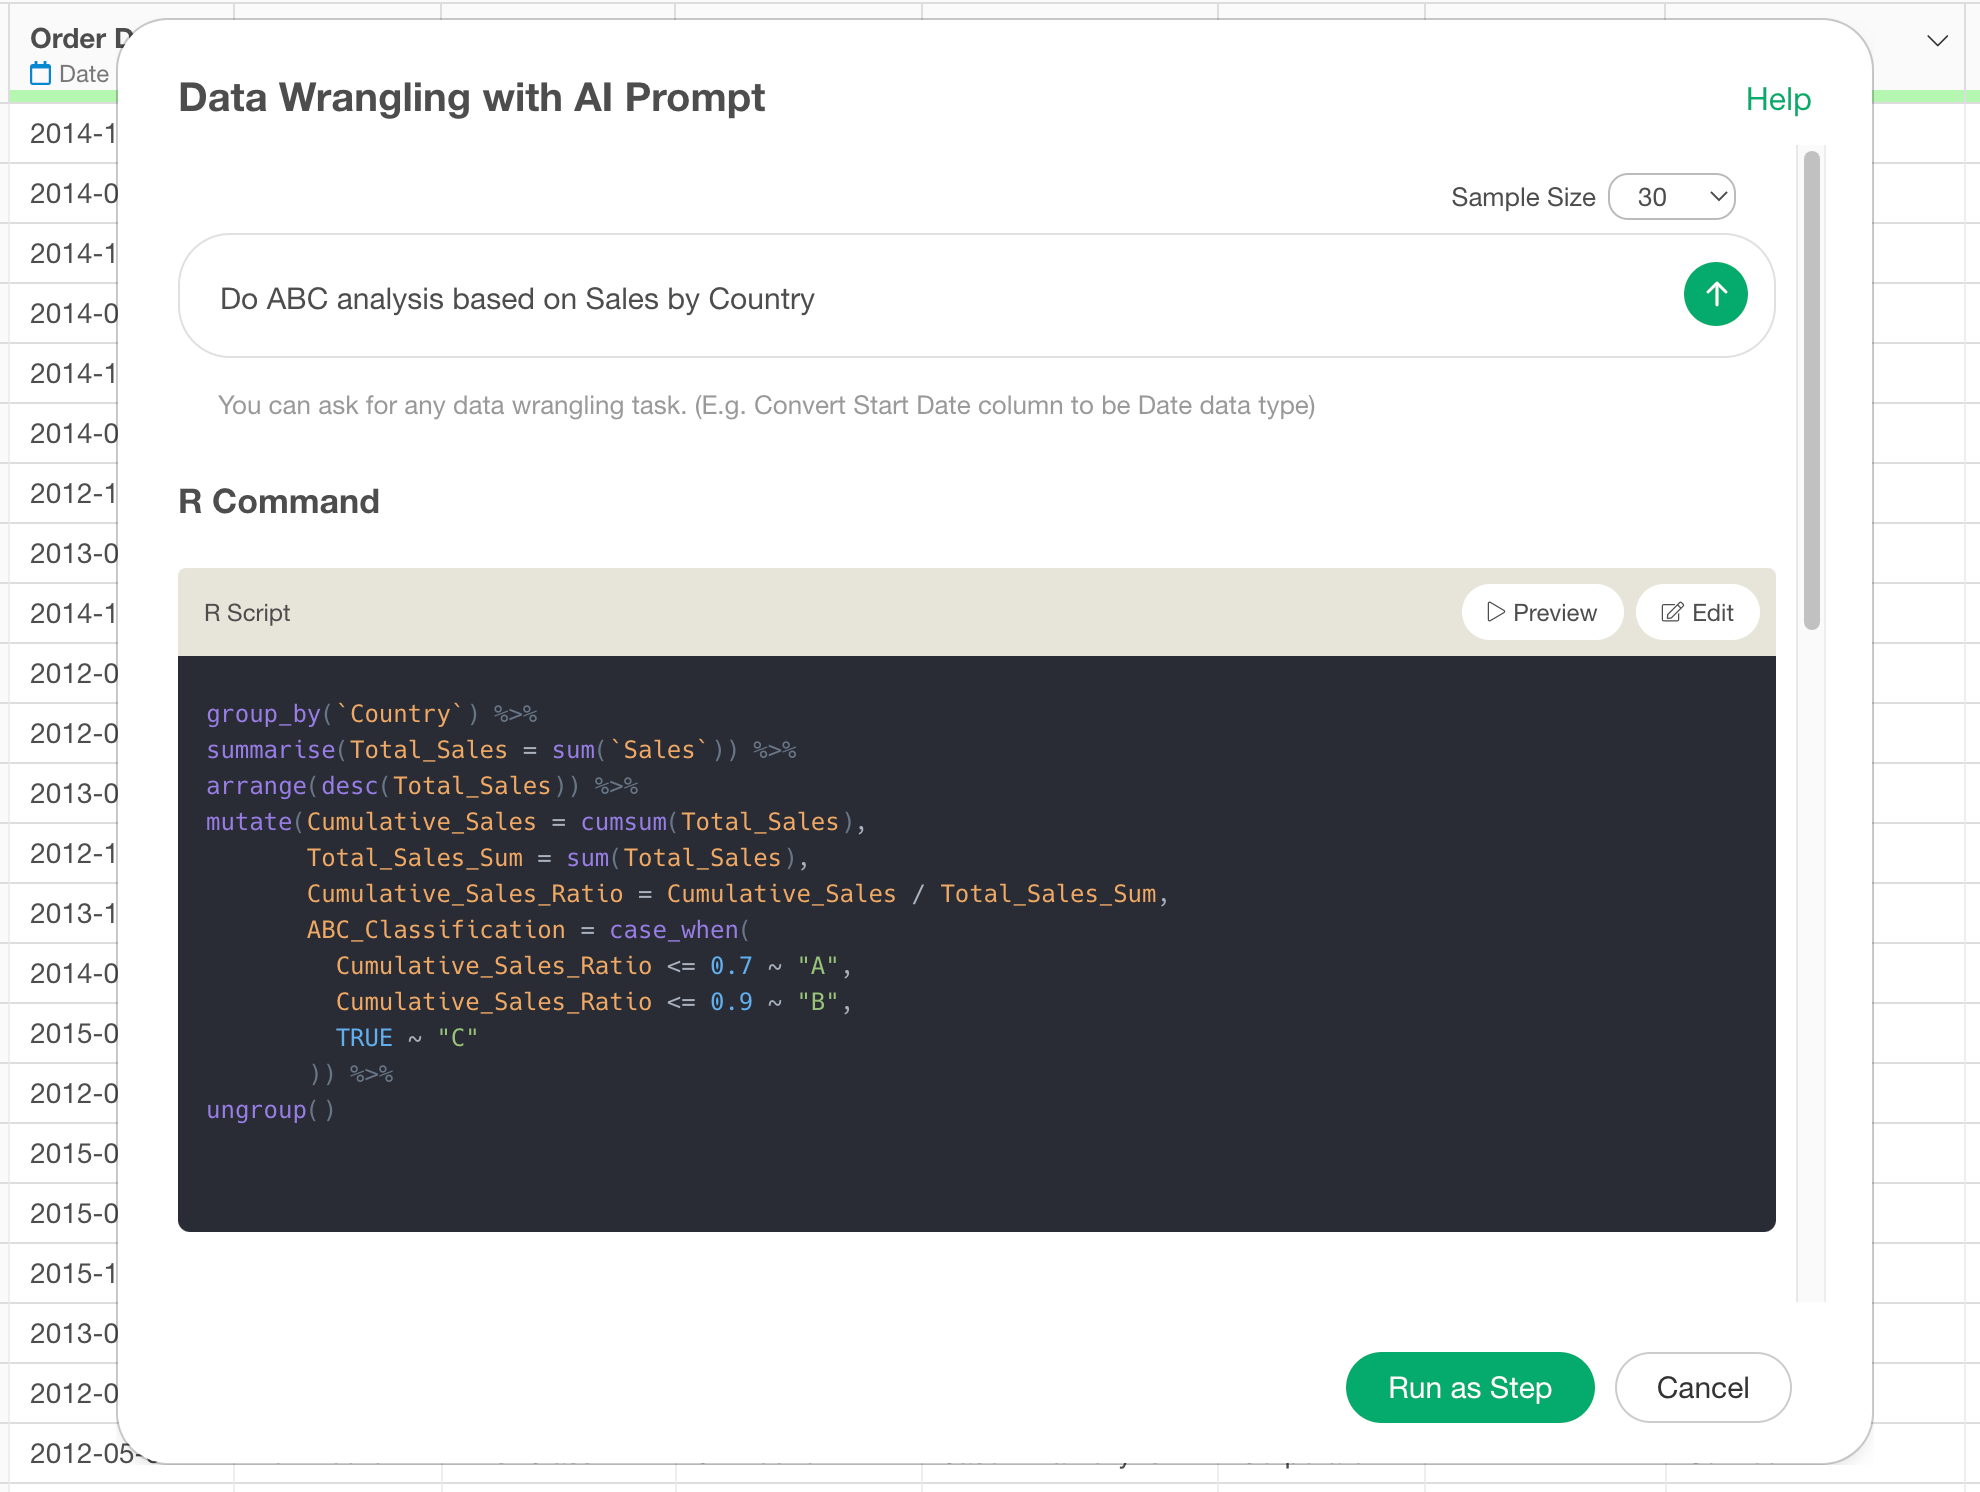
After opening the AI Prompt dialog, enter the following text and execute:
Do ABC analysis based on Sales by Country
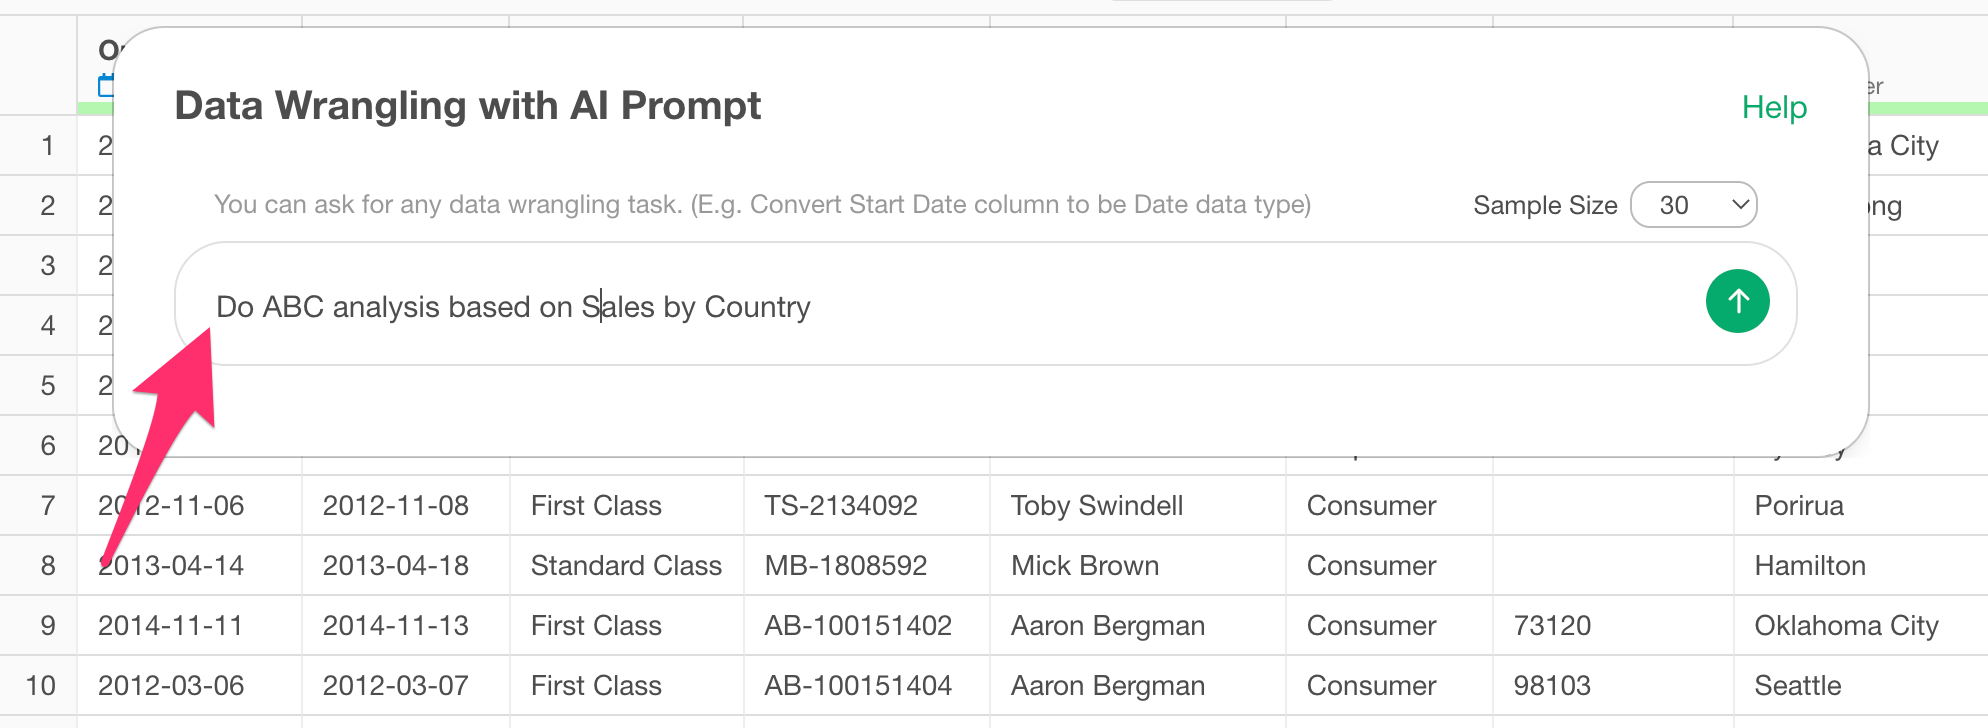
This will generate code to perform ABC analysis.
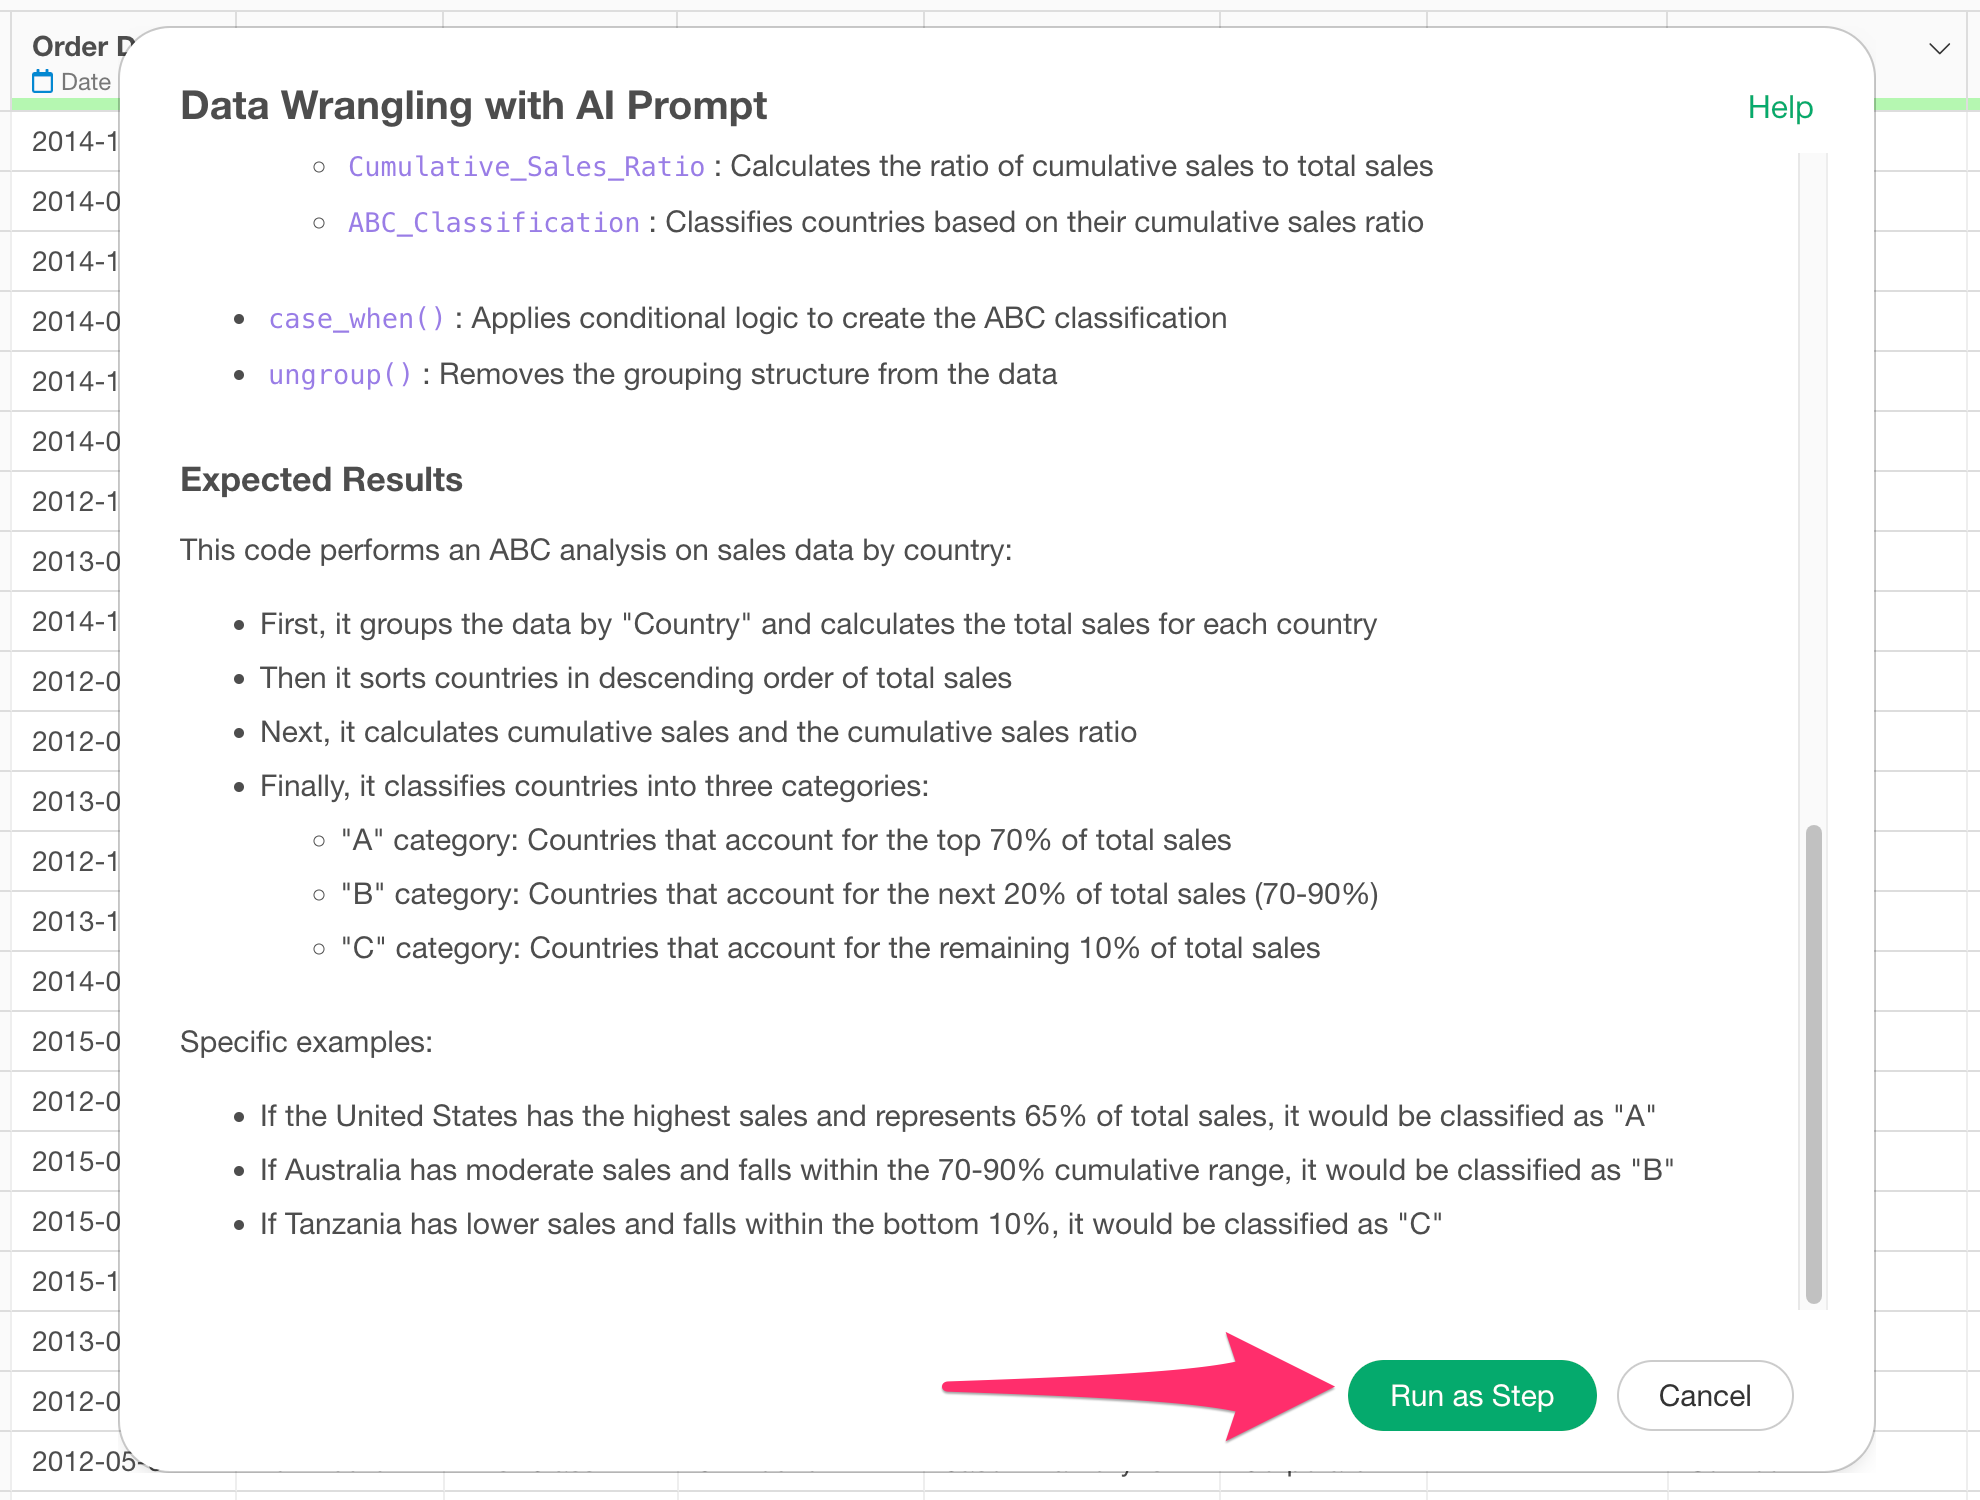
Review the explanation of the functions used and the expected results, then click the “Run as Step” button.
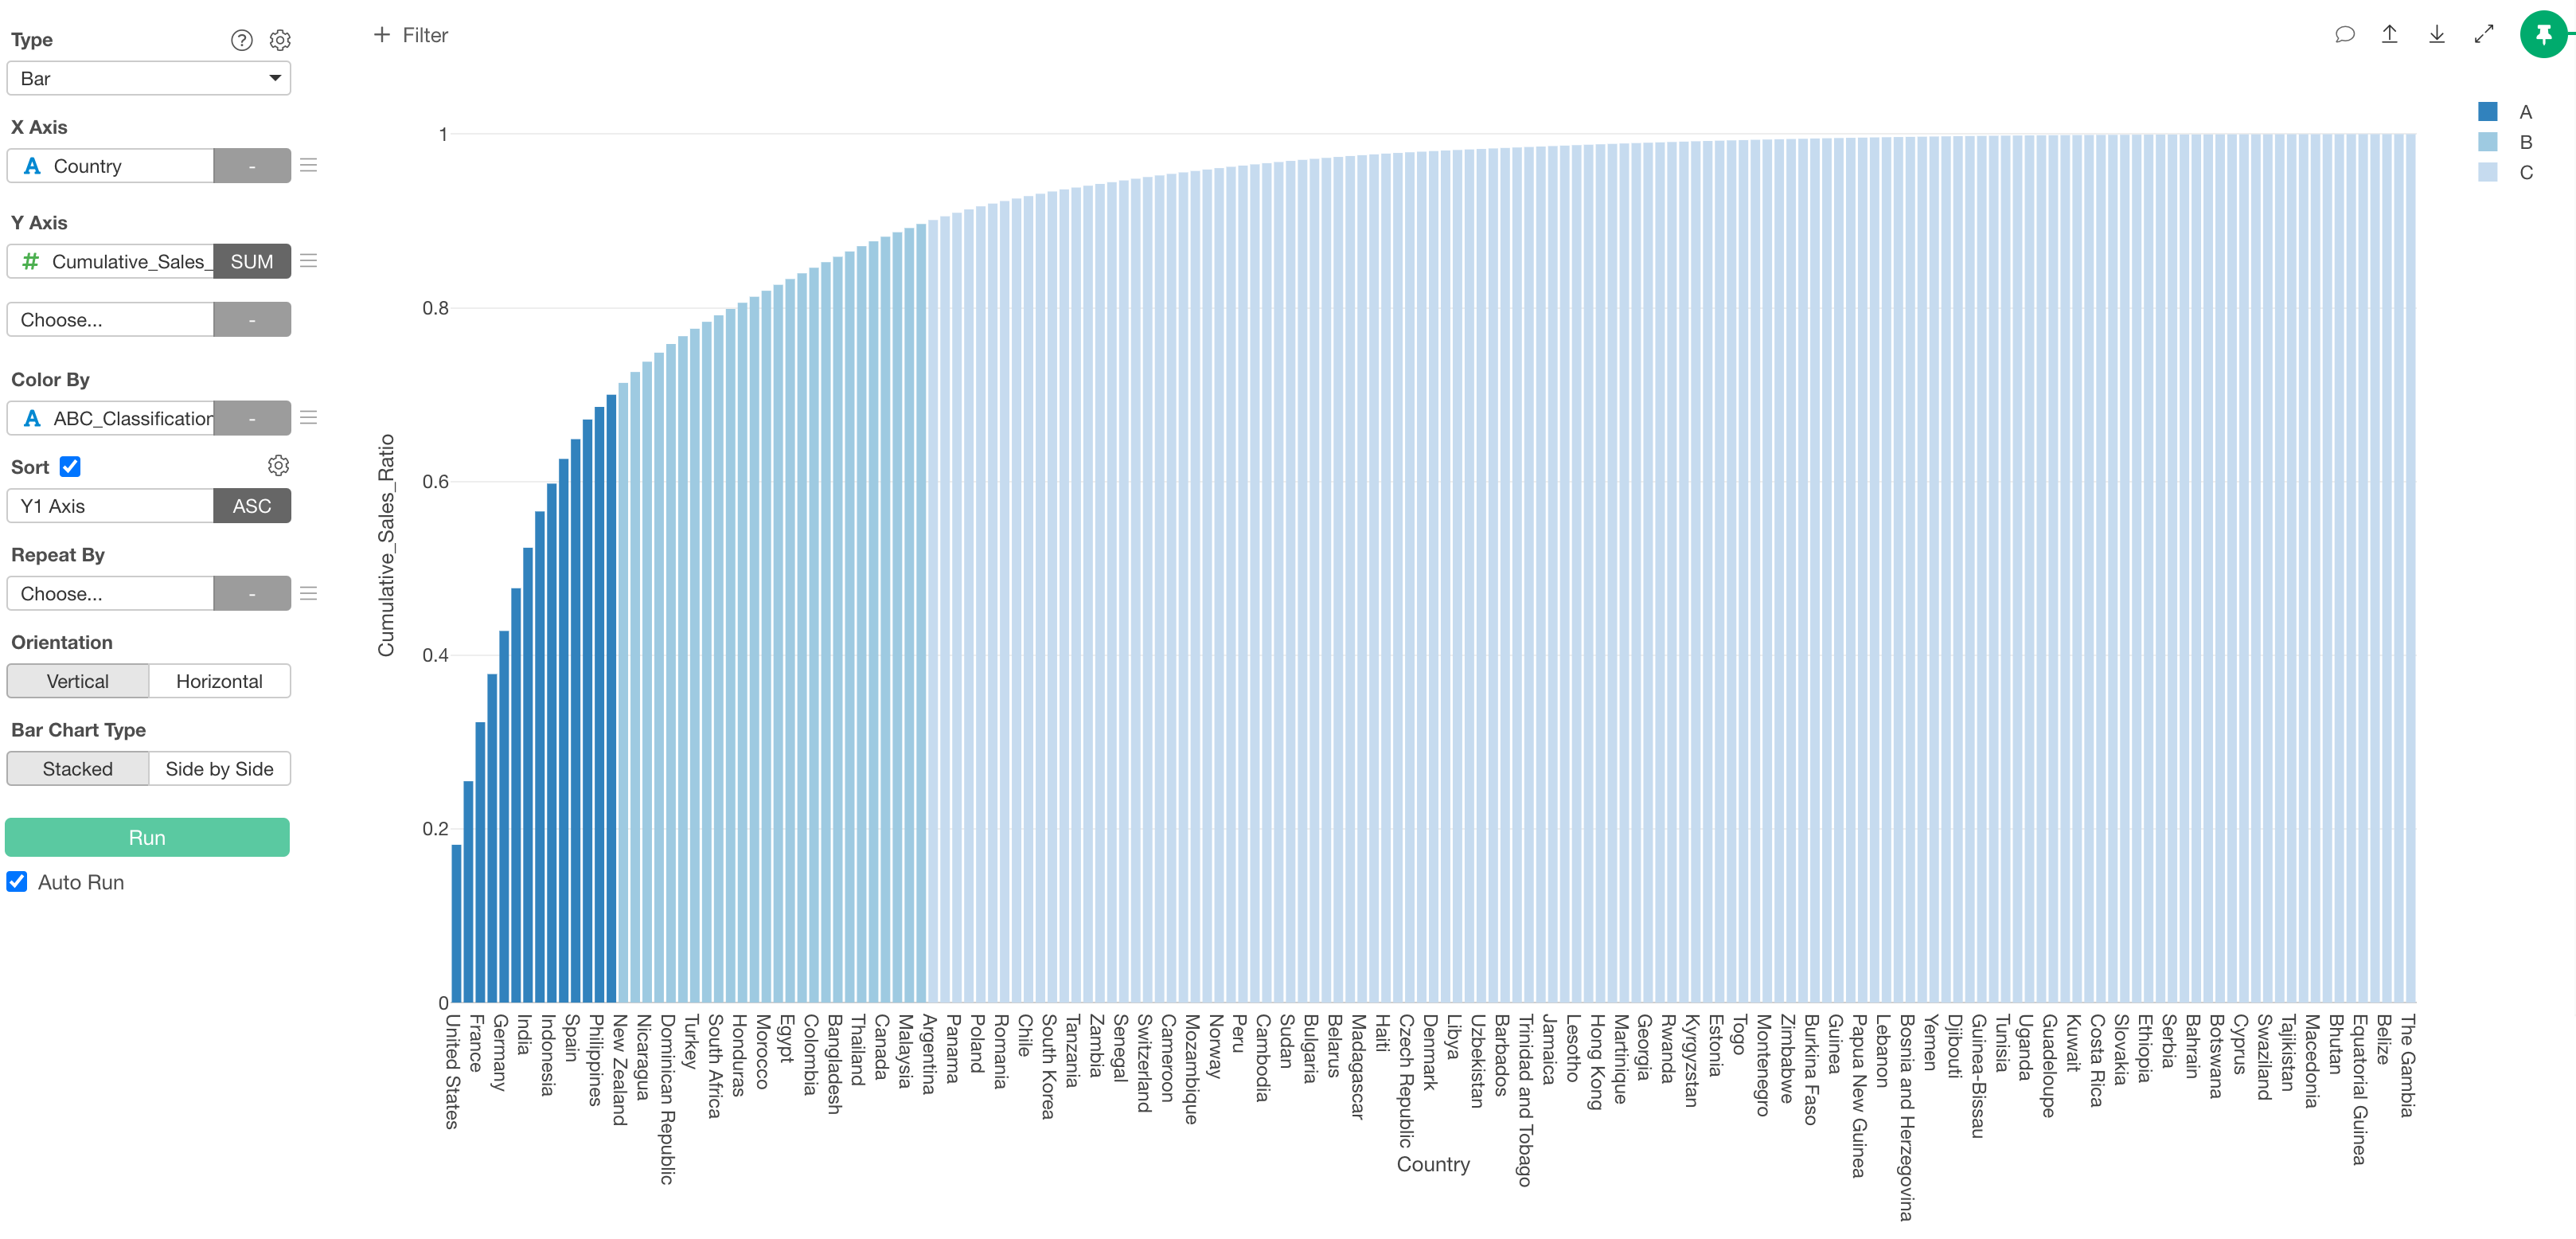
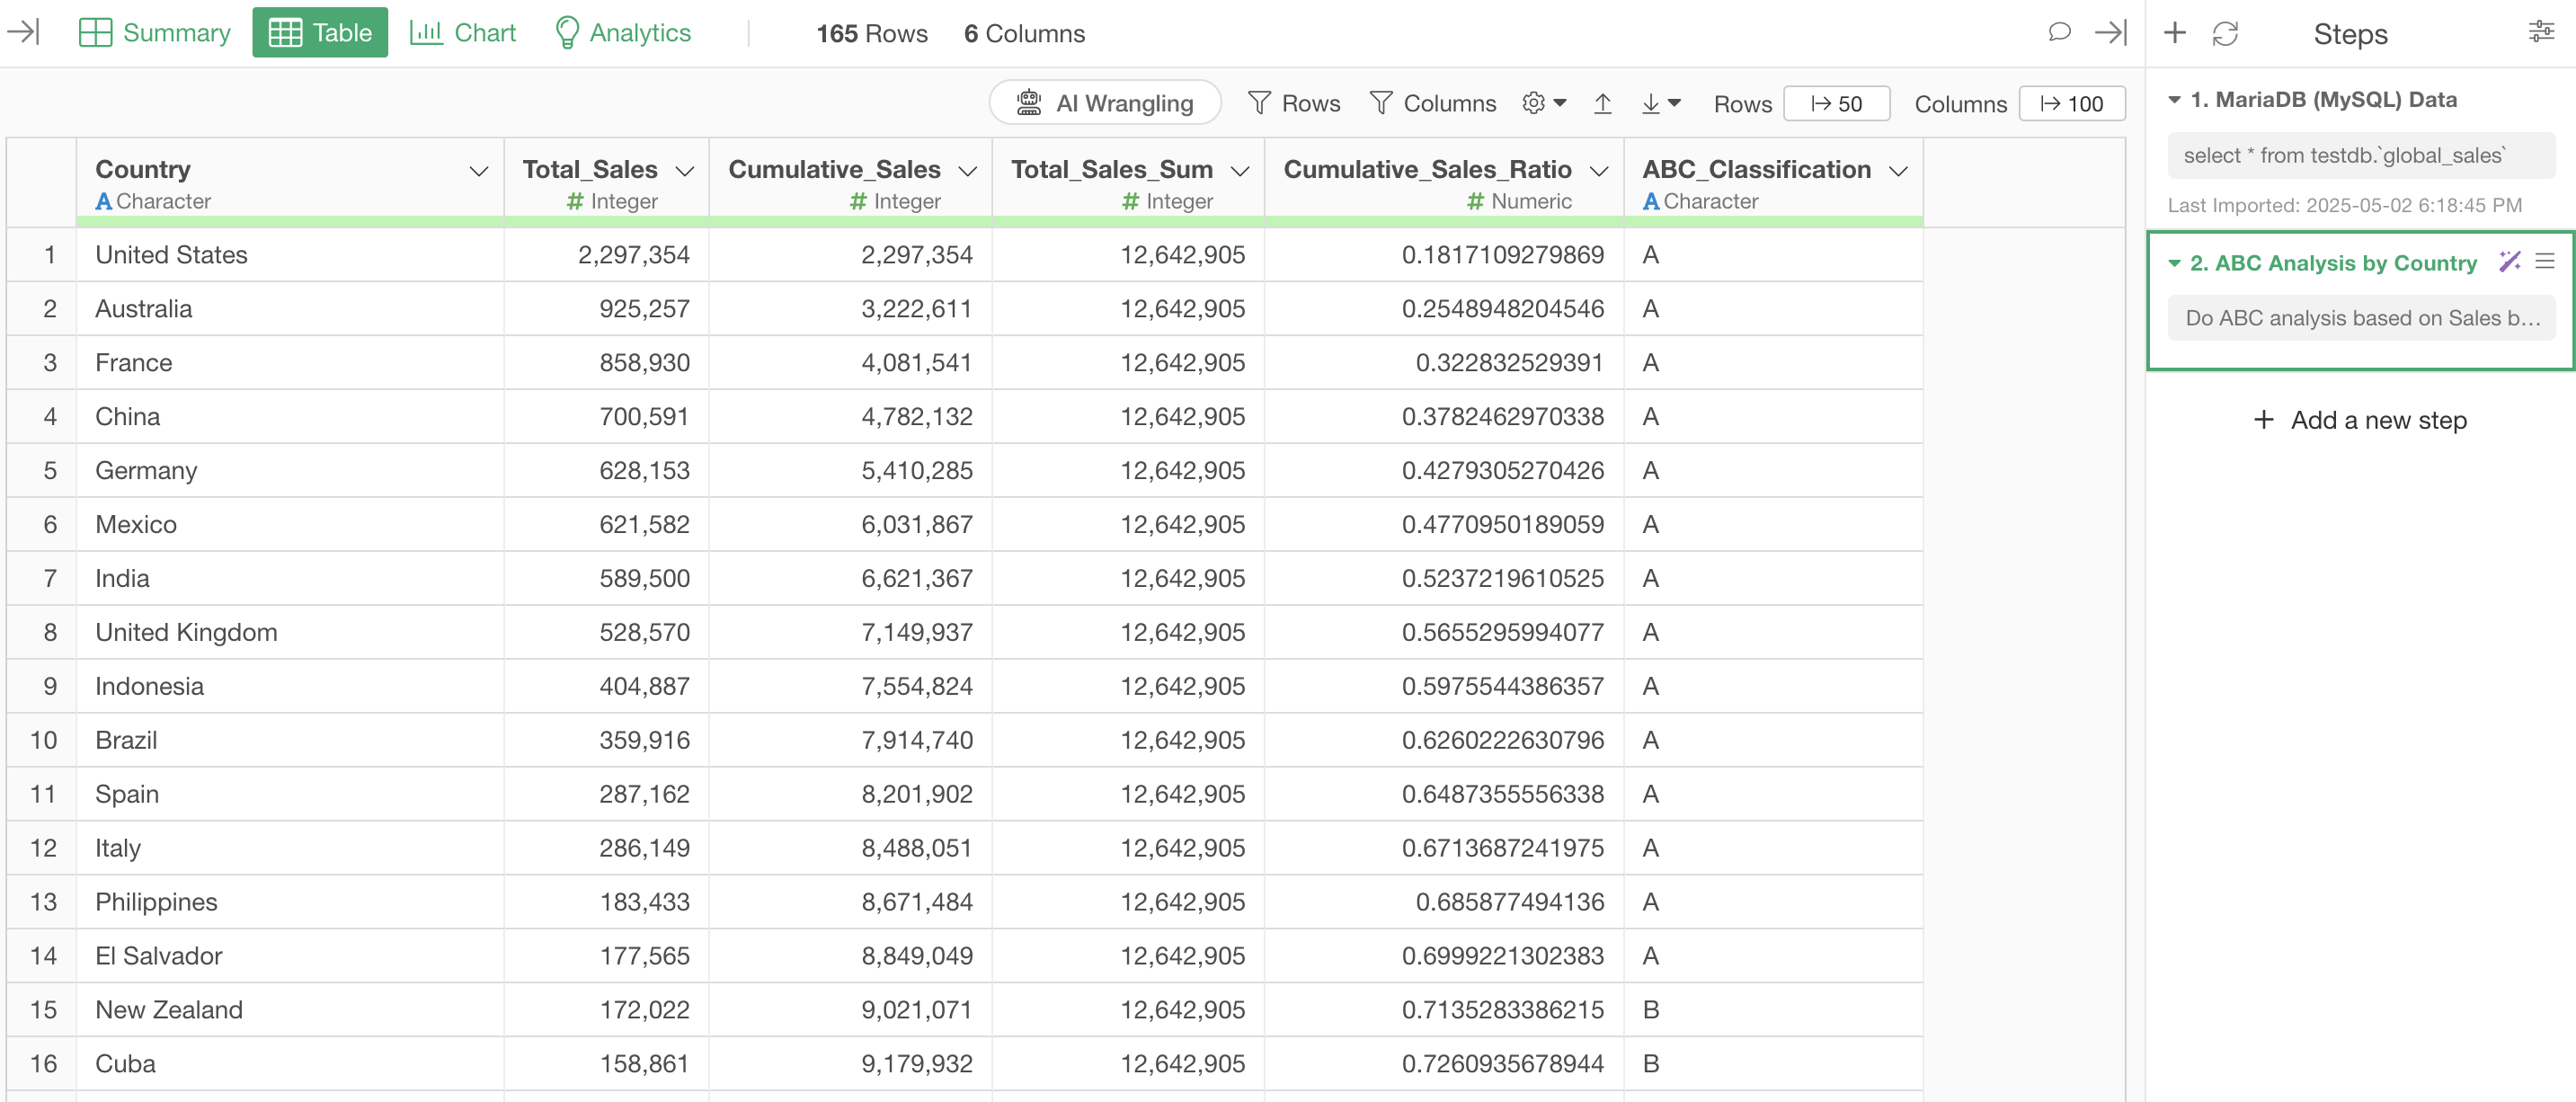
The step is added, and the data for ABC analysis has been created.
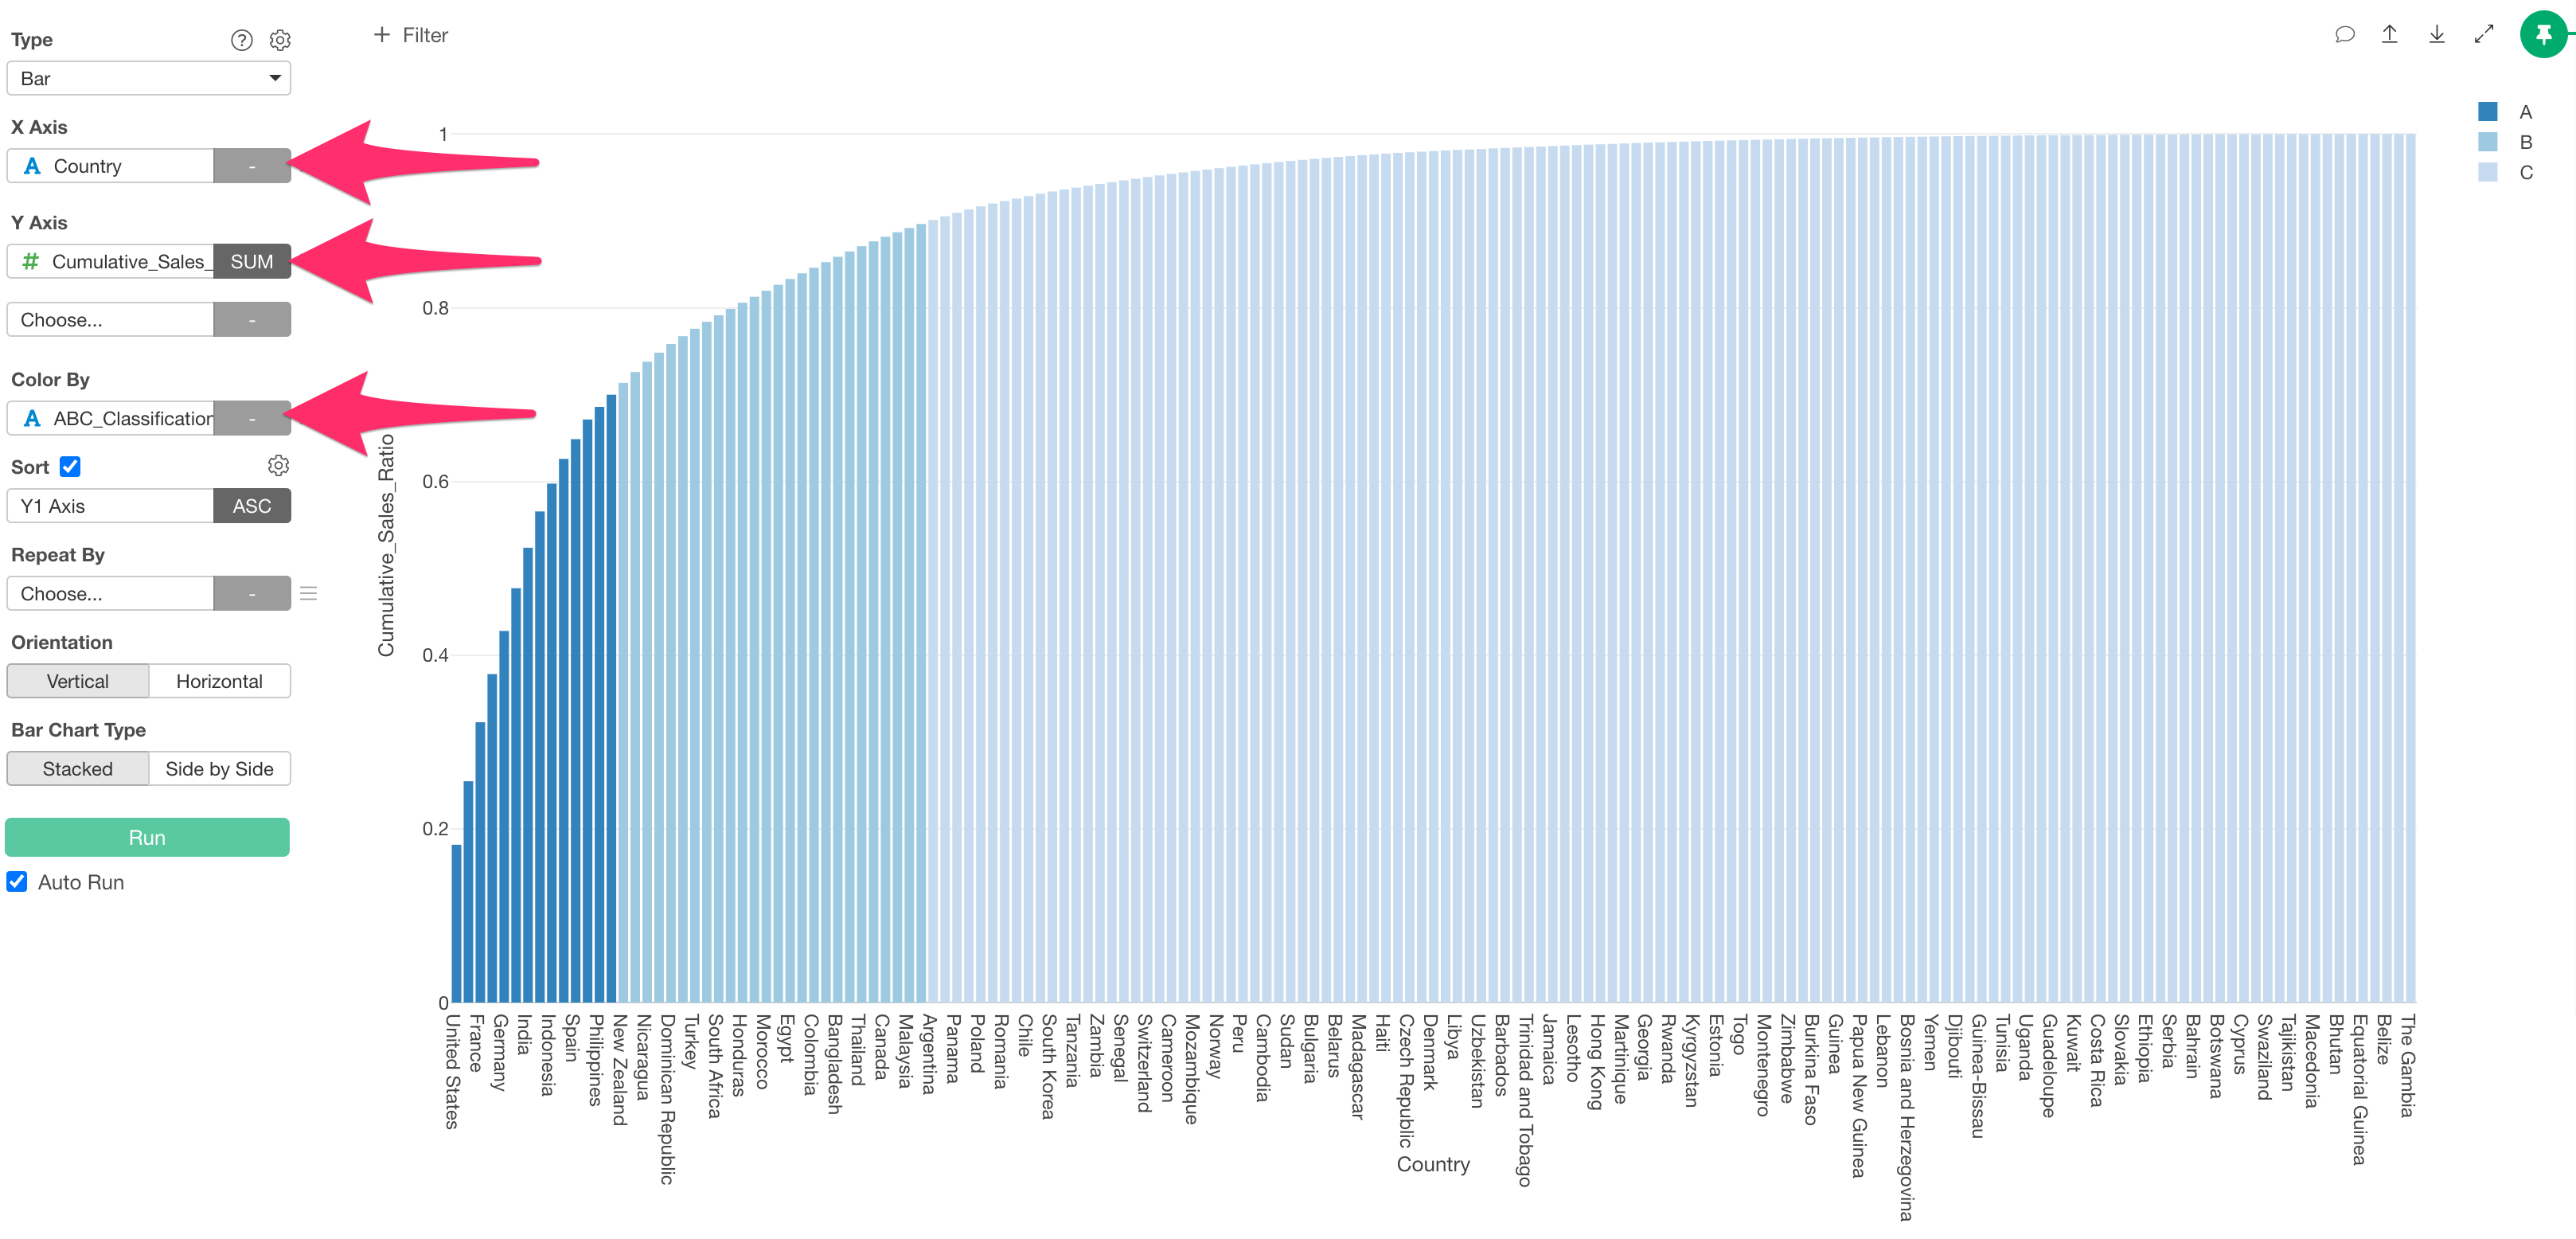
Now you just need to set the X-axis, Y-axis, and color in the chart to visualize the ABC analysis results.
Summary
In this article, we introduced how to perform ABC analysis using Exploratory’s AI feature “AI Prompt.”
Previously, even if you wanted to perform ABC analysis, you needed knowledge of data processing methods and the skills to implement them. However, with Exploratory, you can quickly create analysis charts using natural language!
If you haven’t used Exploratory before, please try the 30-day free trial!