How to do RFM Analysis with AI Prompt
RFM analysis is an effective marketing technique that evaluates customer purchasing behavior using three key indicators to segment customers. RFM analysis is derived from the first letters of these three indicators:
- R (Recency): The time elapsed since a customer’s last purchase. Customers who have purchased recently are more likely to make repeat purchases.
- F (Frequency): The number of purchases made within a specific period. Customers who purchase frequently tend to have higher brand loyalty.
- M (Monetary): The total purchase amount within a specific period. Customers with larger purchase amounts hold higher value for the business.
In RFM analysis, customers are grouped based on the values of each indicator.
The number of groups can be flexibly set according to business objectives and customer base characteristics. For example, each indicator might be divided into three groups (high, medium, low), or more finely into five or four groups.
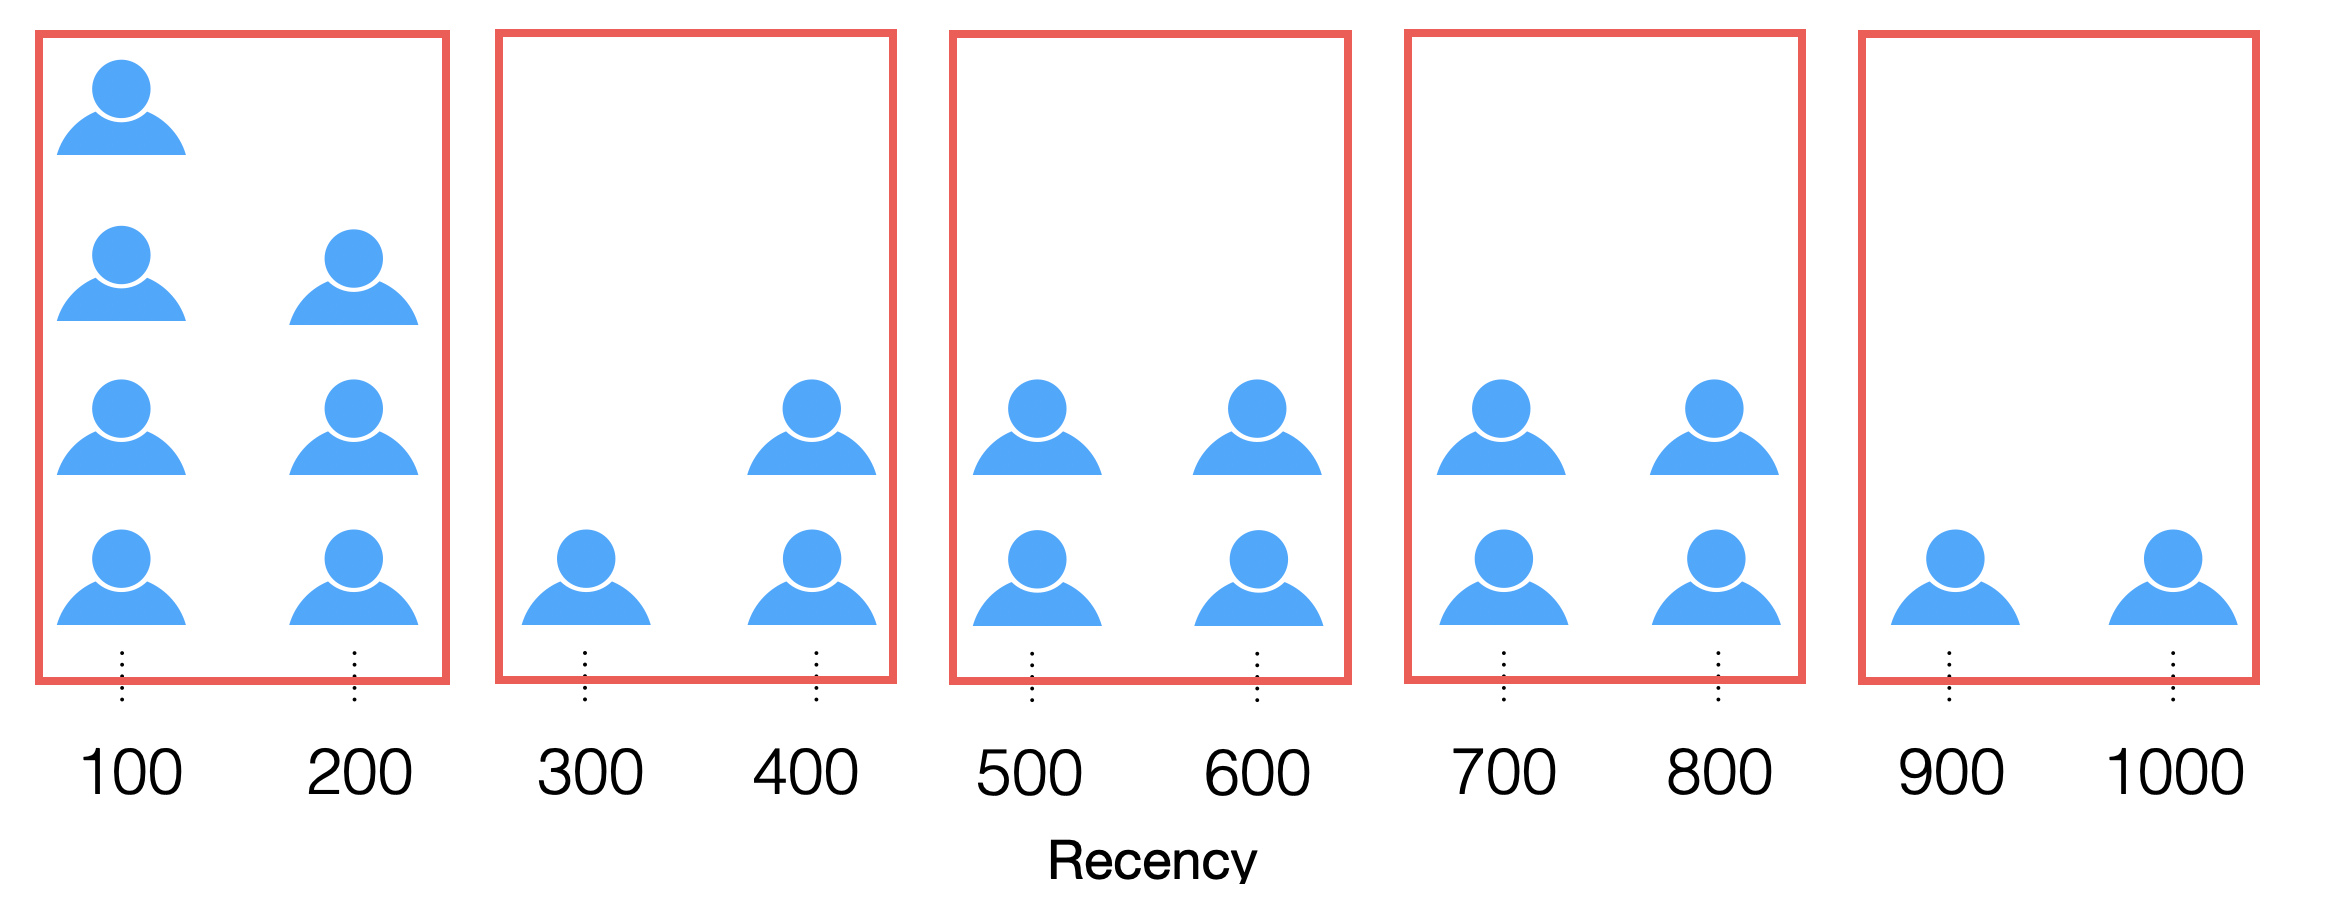
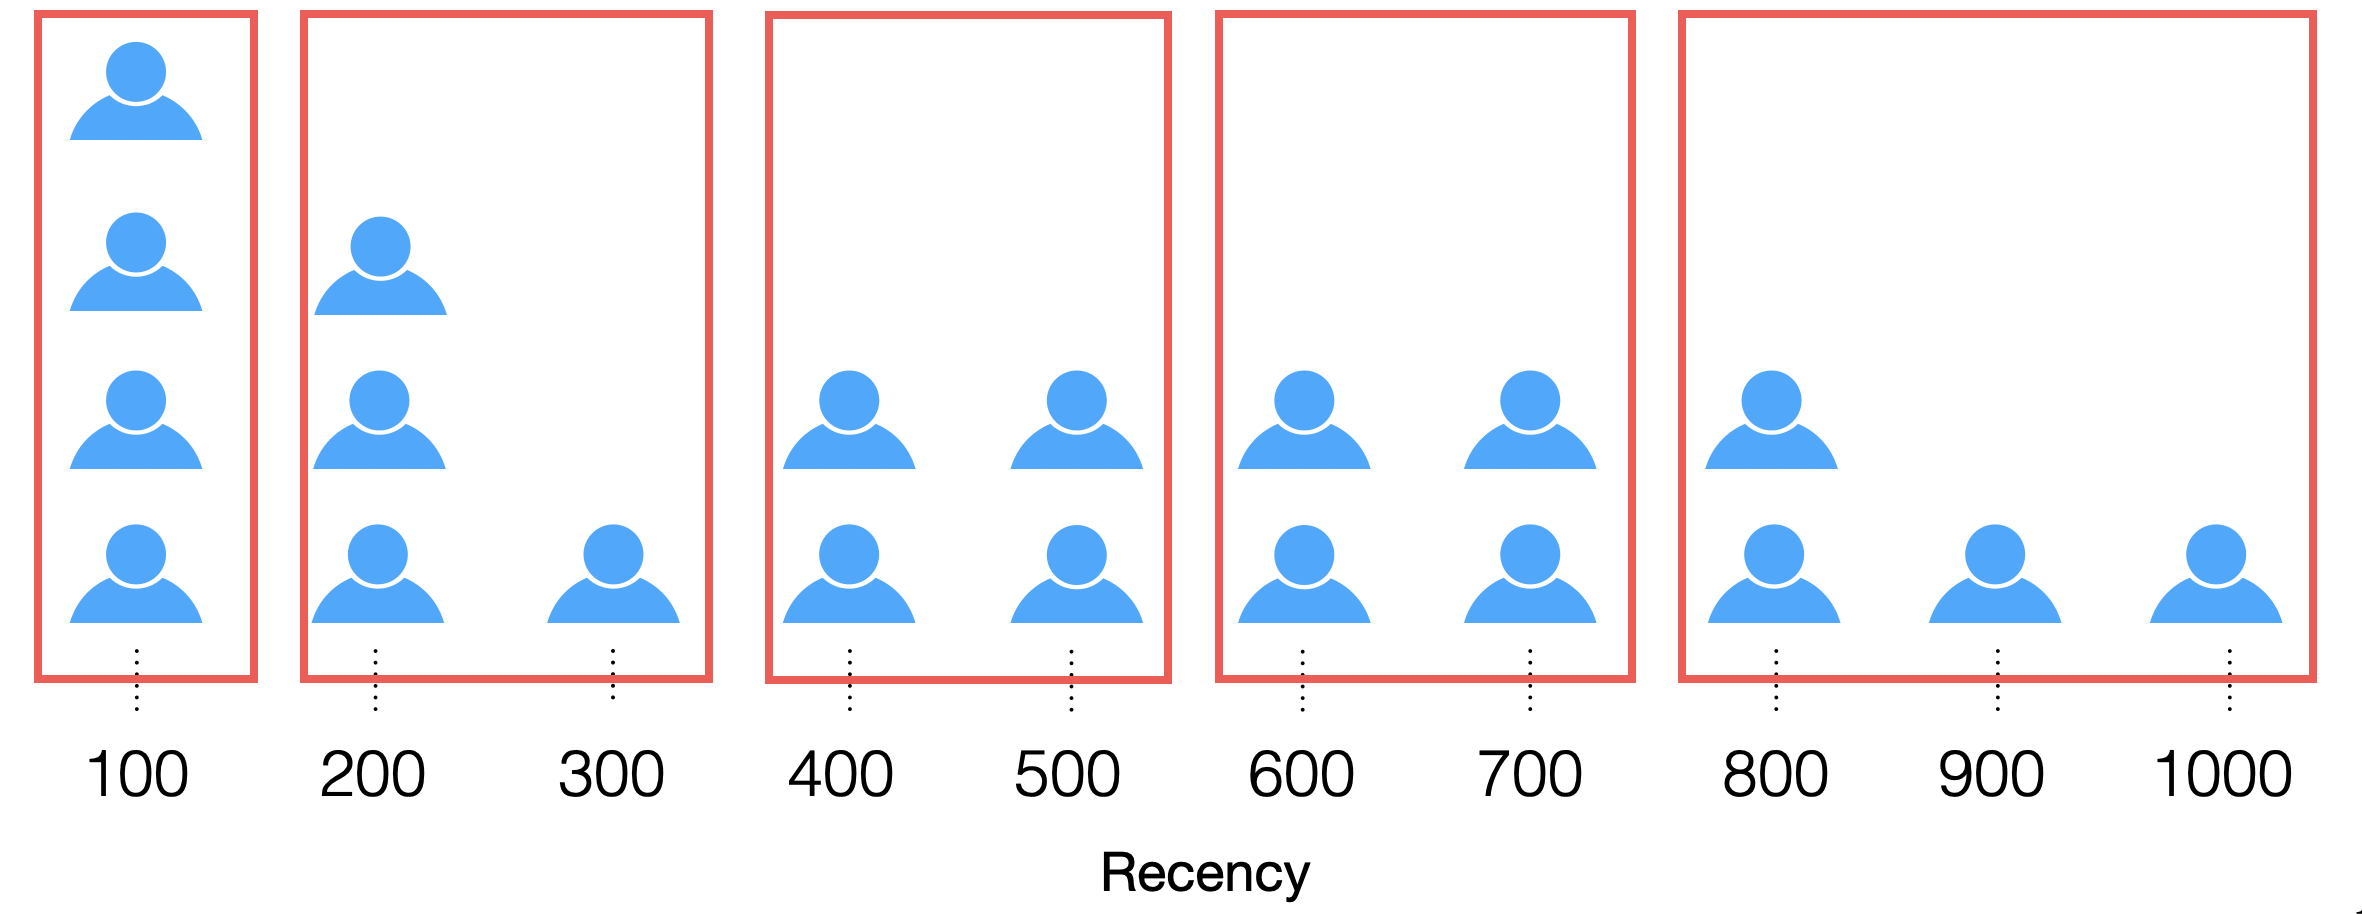
There are methods for dividing groups, such as equal width or equal frequency. (Depending on the data, customers may concentrate in areas with low purchase frequency or amount, so dividing groups by equal frequency tends to segment customers more evenly.)
Equal Width
Equal Frequency
Customers are segmented based on combinations of these groups.
For example, customers who belong to high groups across all indicators can be classified as “premium customers,” while those high only in R might be “new customers.”
This analytical method helps to optimally allocate limited marketing resources and develop communication strategies aligned with the customer lifecycle.
Utilizing RFM Analysis
RFM analysis is a powerful tool especially in CRM (Customer Relationship Management) strategies for e-commerce and retail, but it can be applied to many business models with repeat purchases, including service industries.
Marketing Managers
Marketing managers can use RFM analysis to implement optimal marketing initiatives for each customer segment.
For example, they can strengthen relationships with premium customers (high in all “RFM” scores) through VIP benefits. Conversely, for dormant customers who were once premium but haven’t purchased recently, they can implement reactivation campaigns, taking different approaches for each segment.
CRM Managers and Customer Analysts
CRM managers and customer analysts can utilize RFM analysis to develop retention strategies.
By analyzing purchasing patterns of each segment, they can predict which segments to invest in and which segments are likely to generate high value in the future.
Additionally, tracking customer movement (e.g., from premium to dormant customers) can serve as an early warning system for customer retention.
Executives and Business Managers
For executives and business managers, RFM analysis serves as an important indicator for evaluating the health of the customer base and formulating business strategies.
By regularly monitoring the RFM distribution of the customer portfolio, they can assess the sustainability and growth potential of the business. For example, a decrease in the proportion of high RFM customers may indicate issues with product or service quality. Conversely, an increase in new customers (high R, low F, low M) suggests successful marketing initiatives.
Executing RFM Analysis with AI Prompt
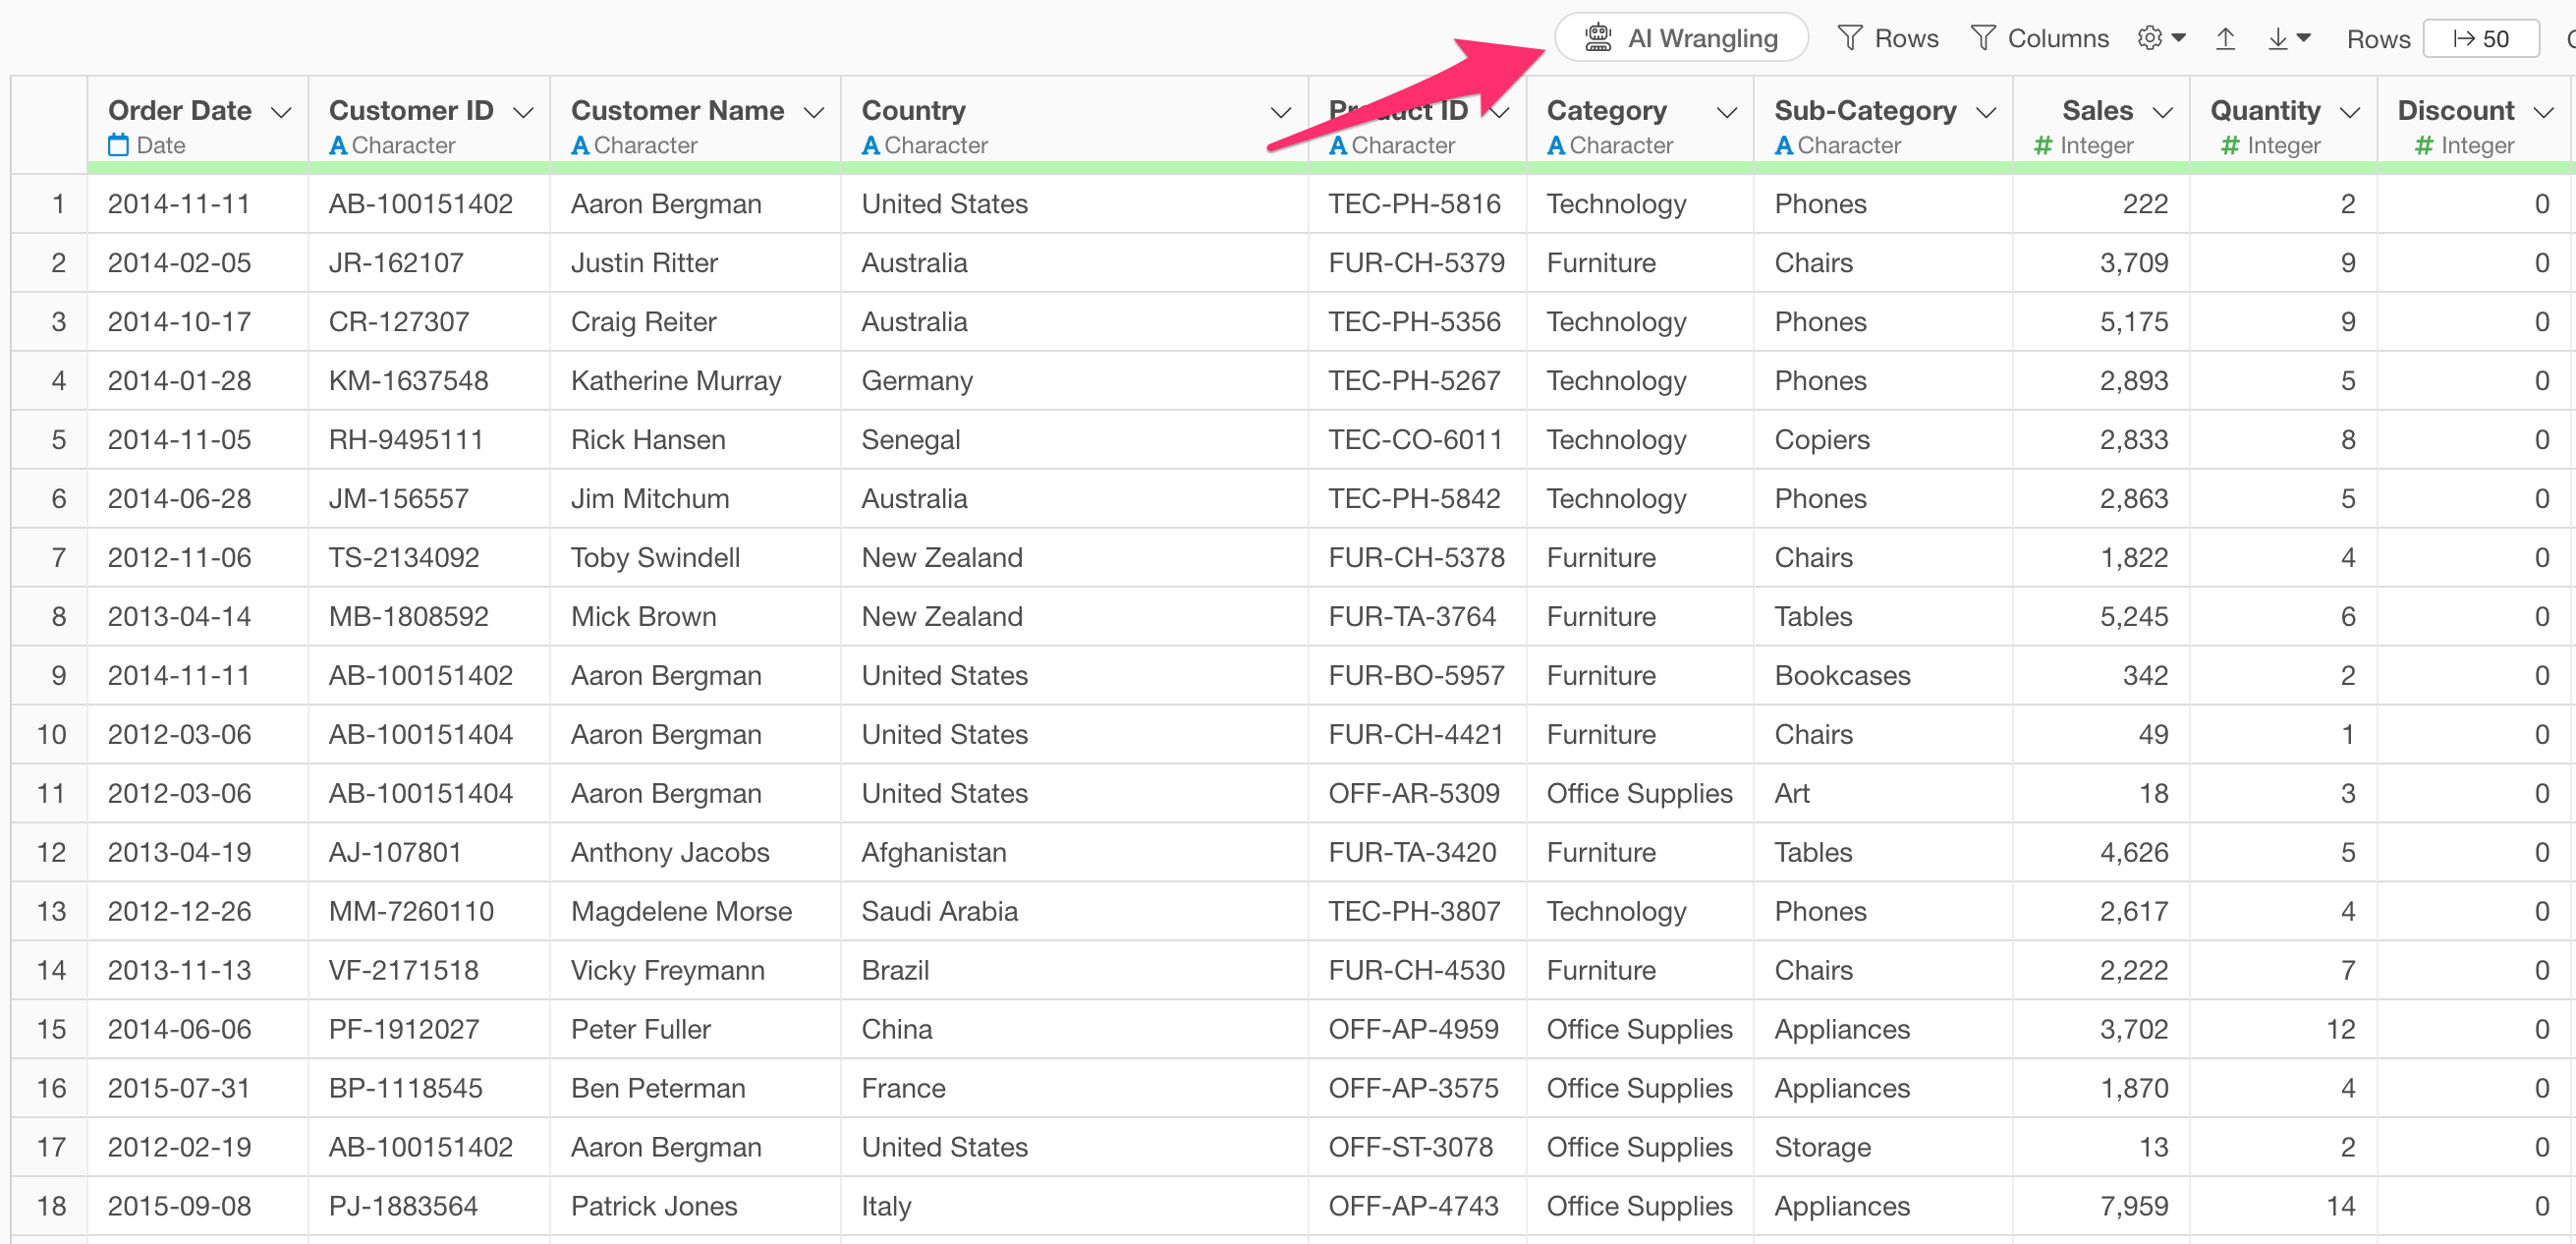
In this example, we’ll execute RFM analysis using AI Prompt on data where each row represents one order detail.
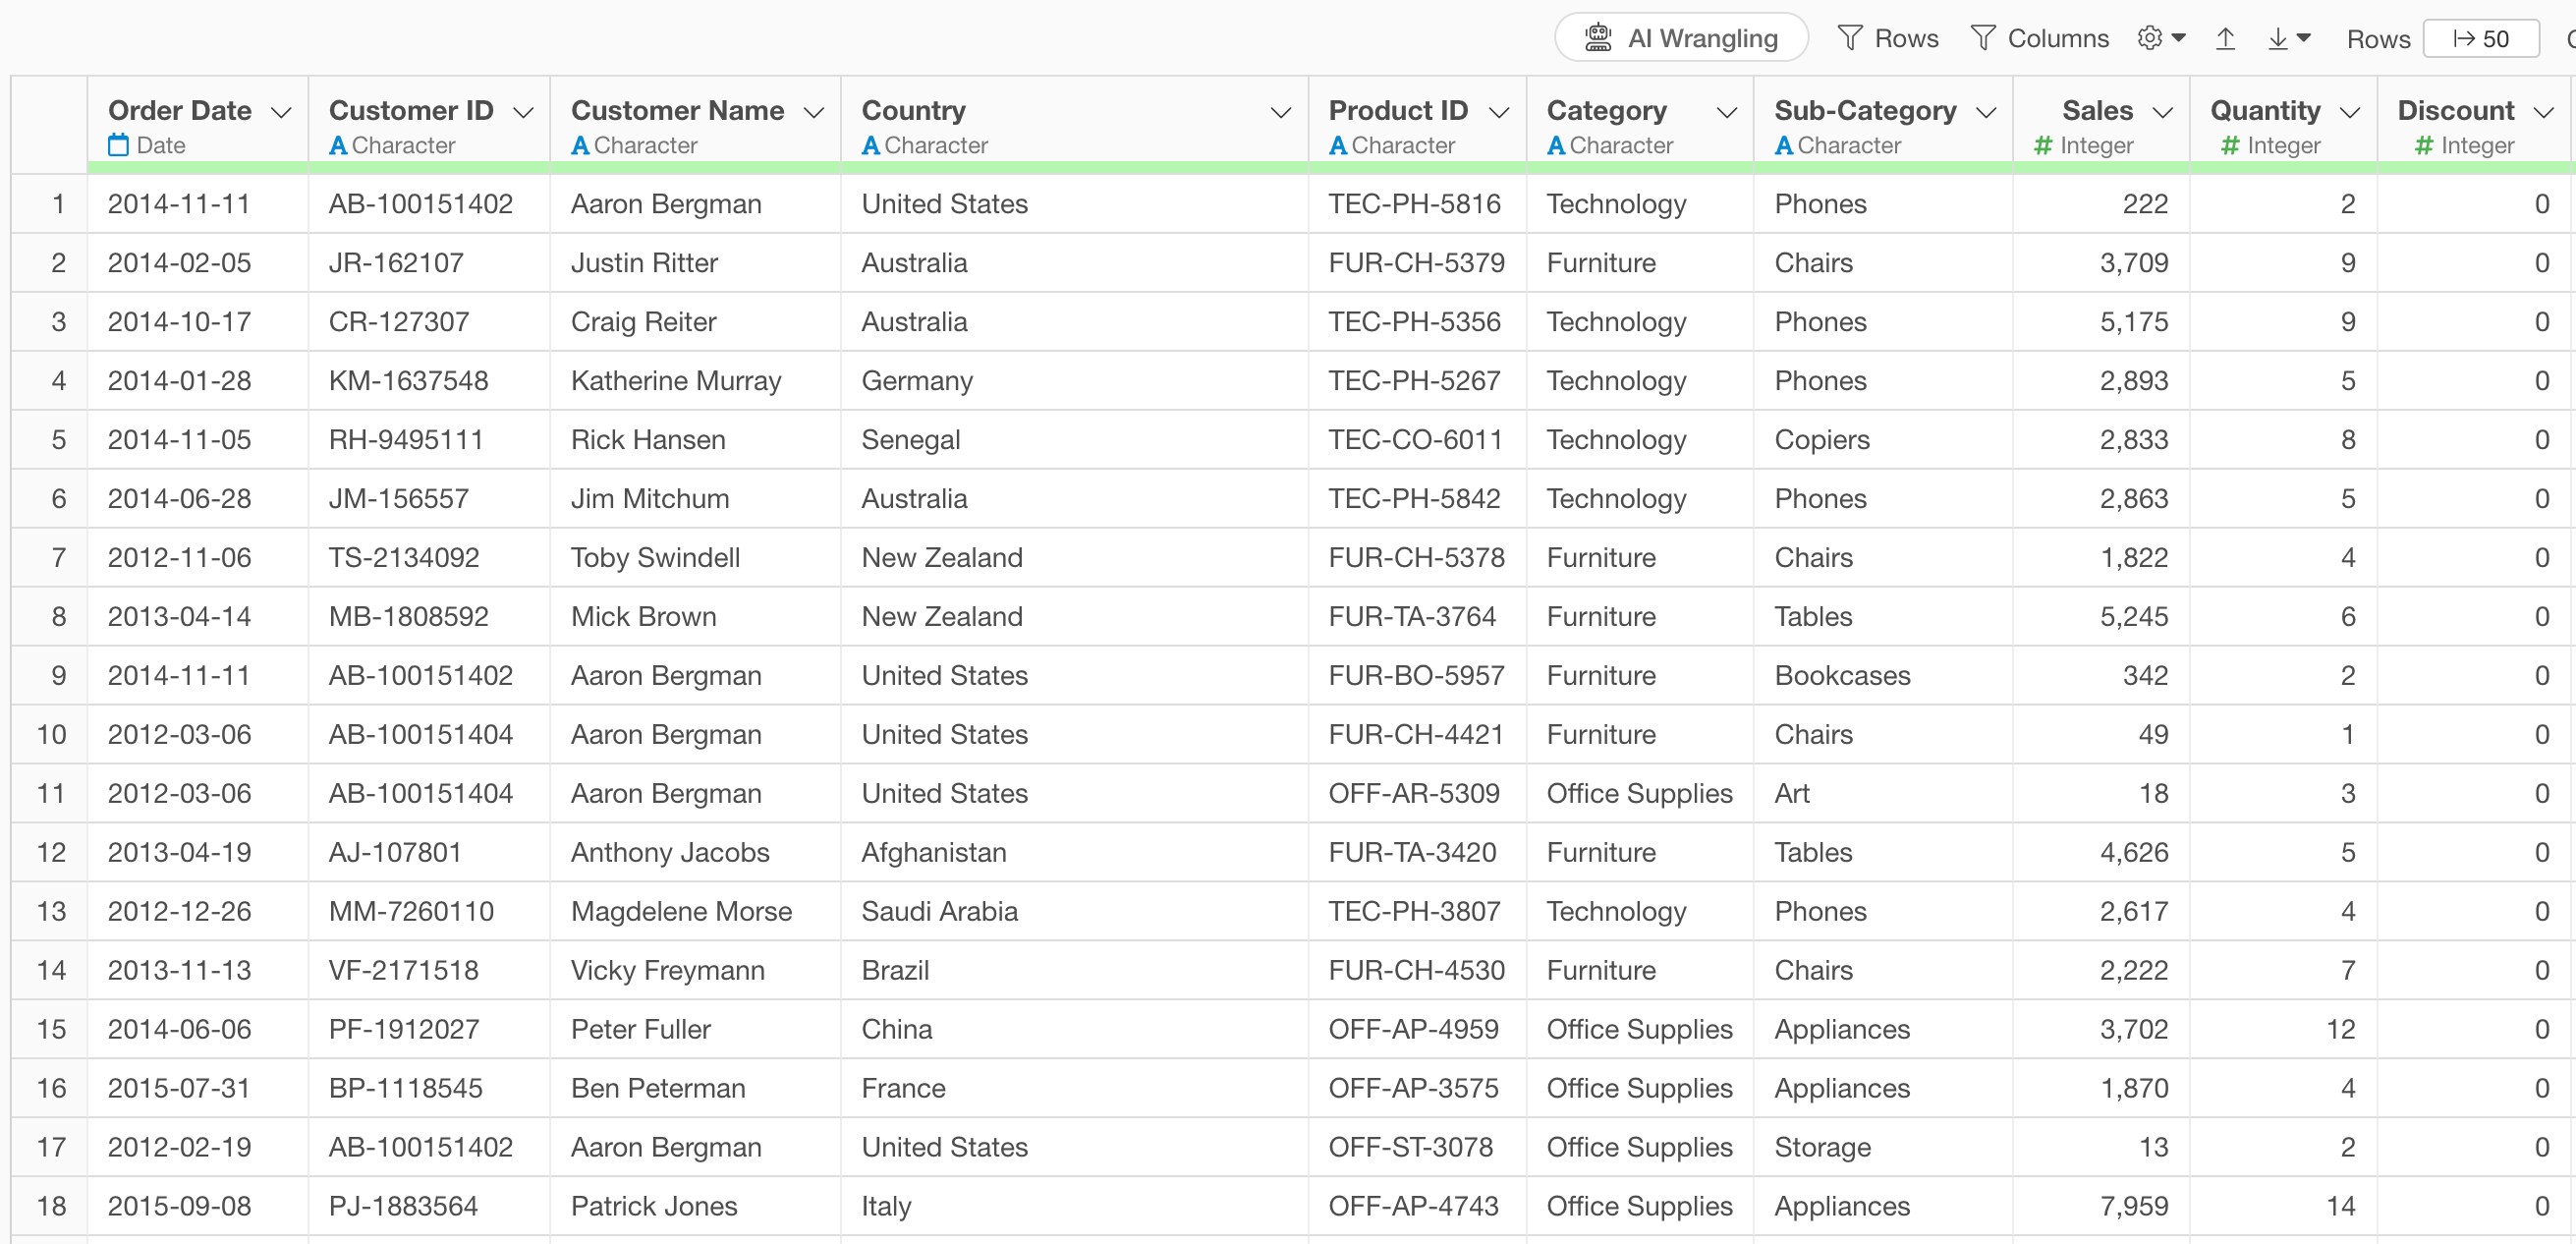
The data includes information such as customer ID, order date, and purchase amount.
Click the “AI Wrangling” button.
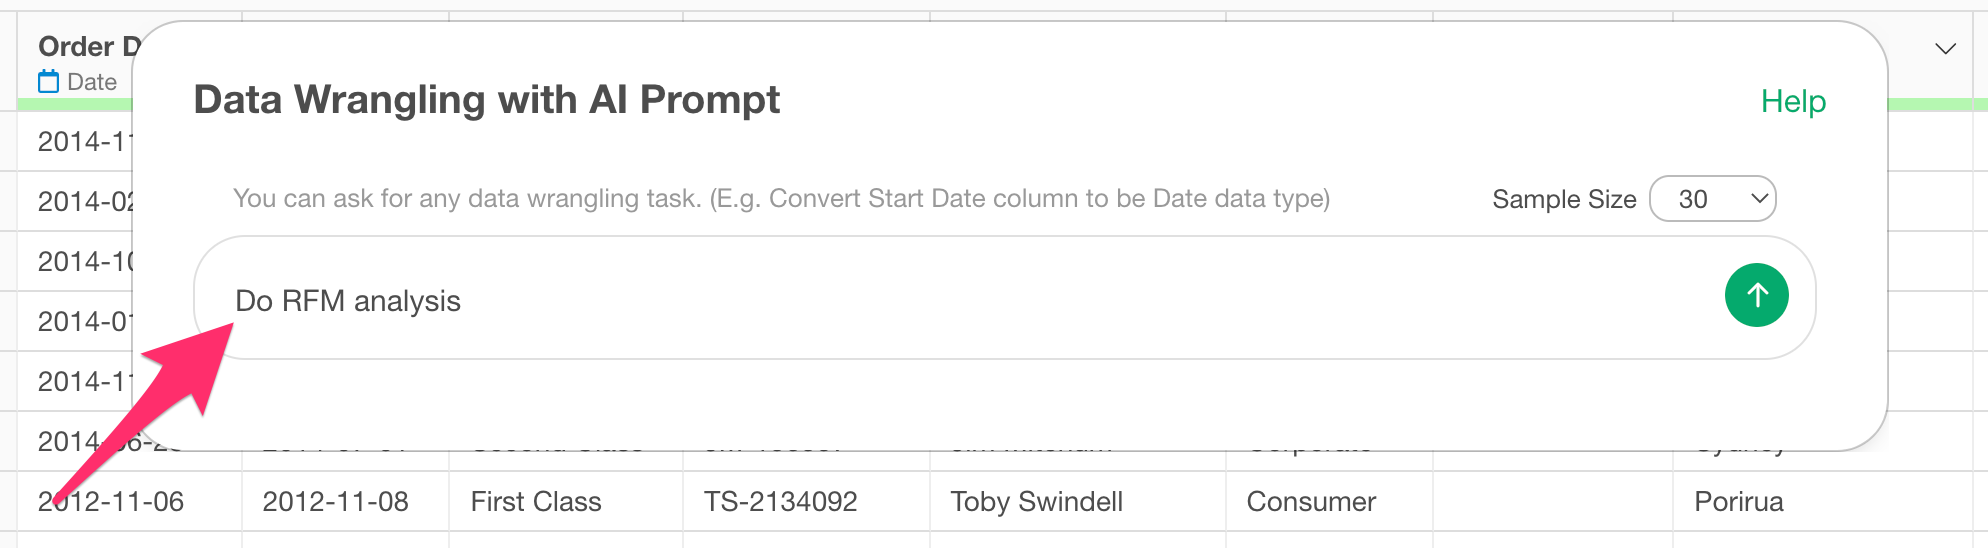
 After
opening the AI Prompt dialog, enter the following text and execute:
After
opening the AI Prompt dialog, enter the following text and execute:
Do RFM analysis
This generates code to execute RFM analysis.
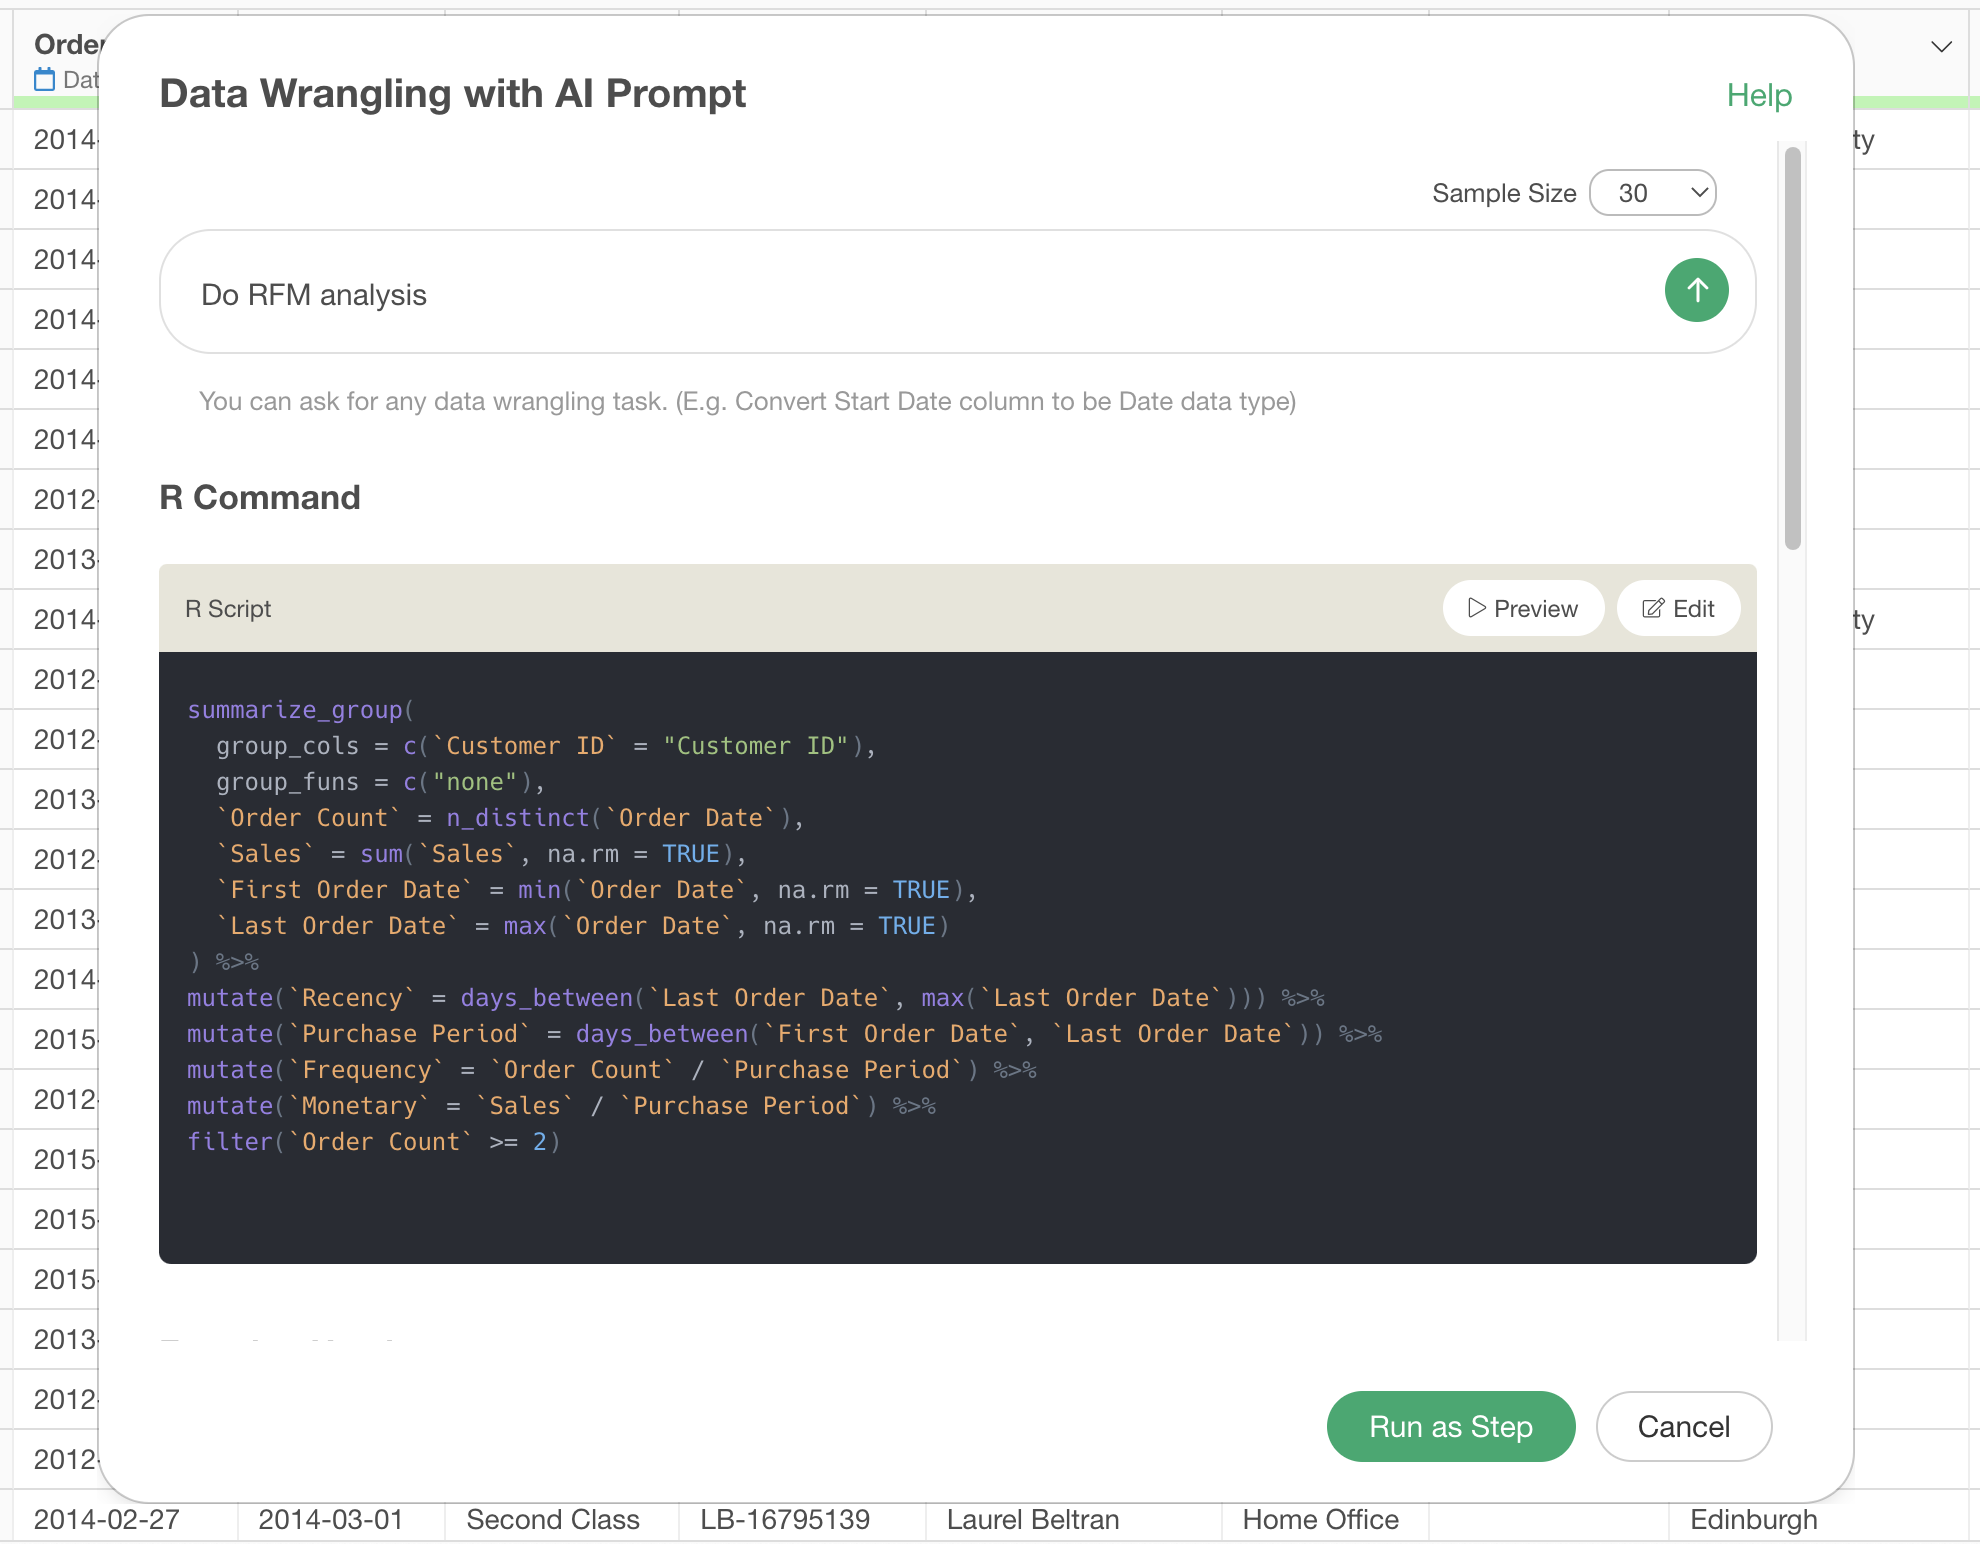
Review the explanation of the functions used and the expected results, then click the “Run as Step” button.
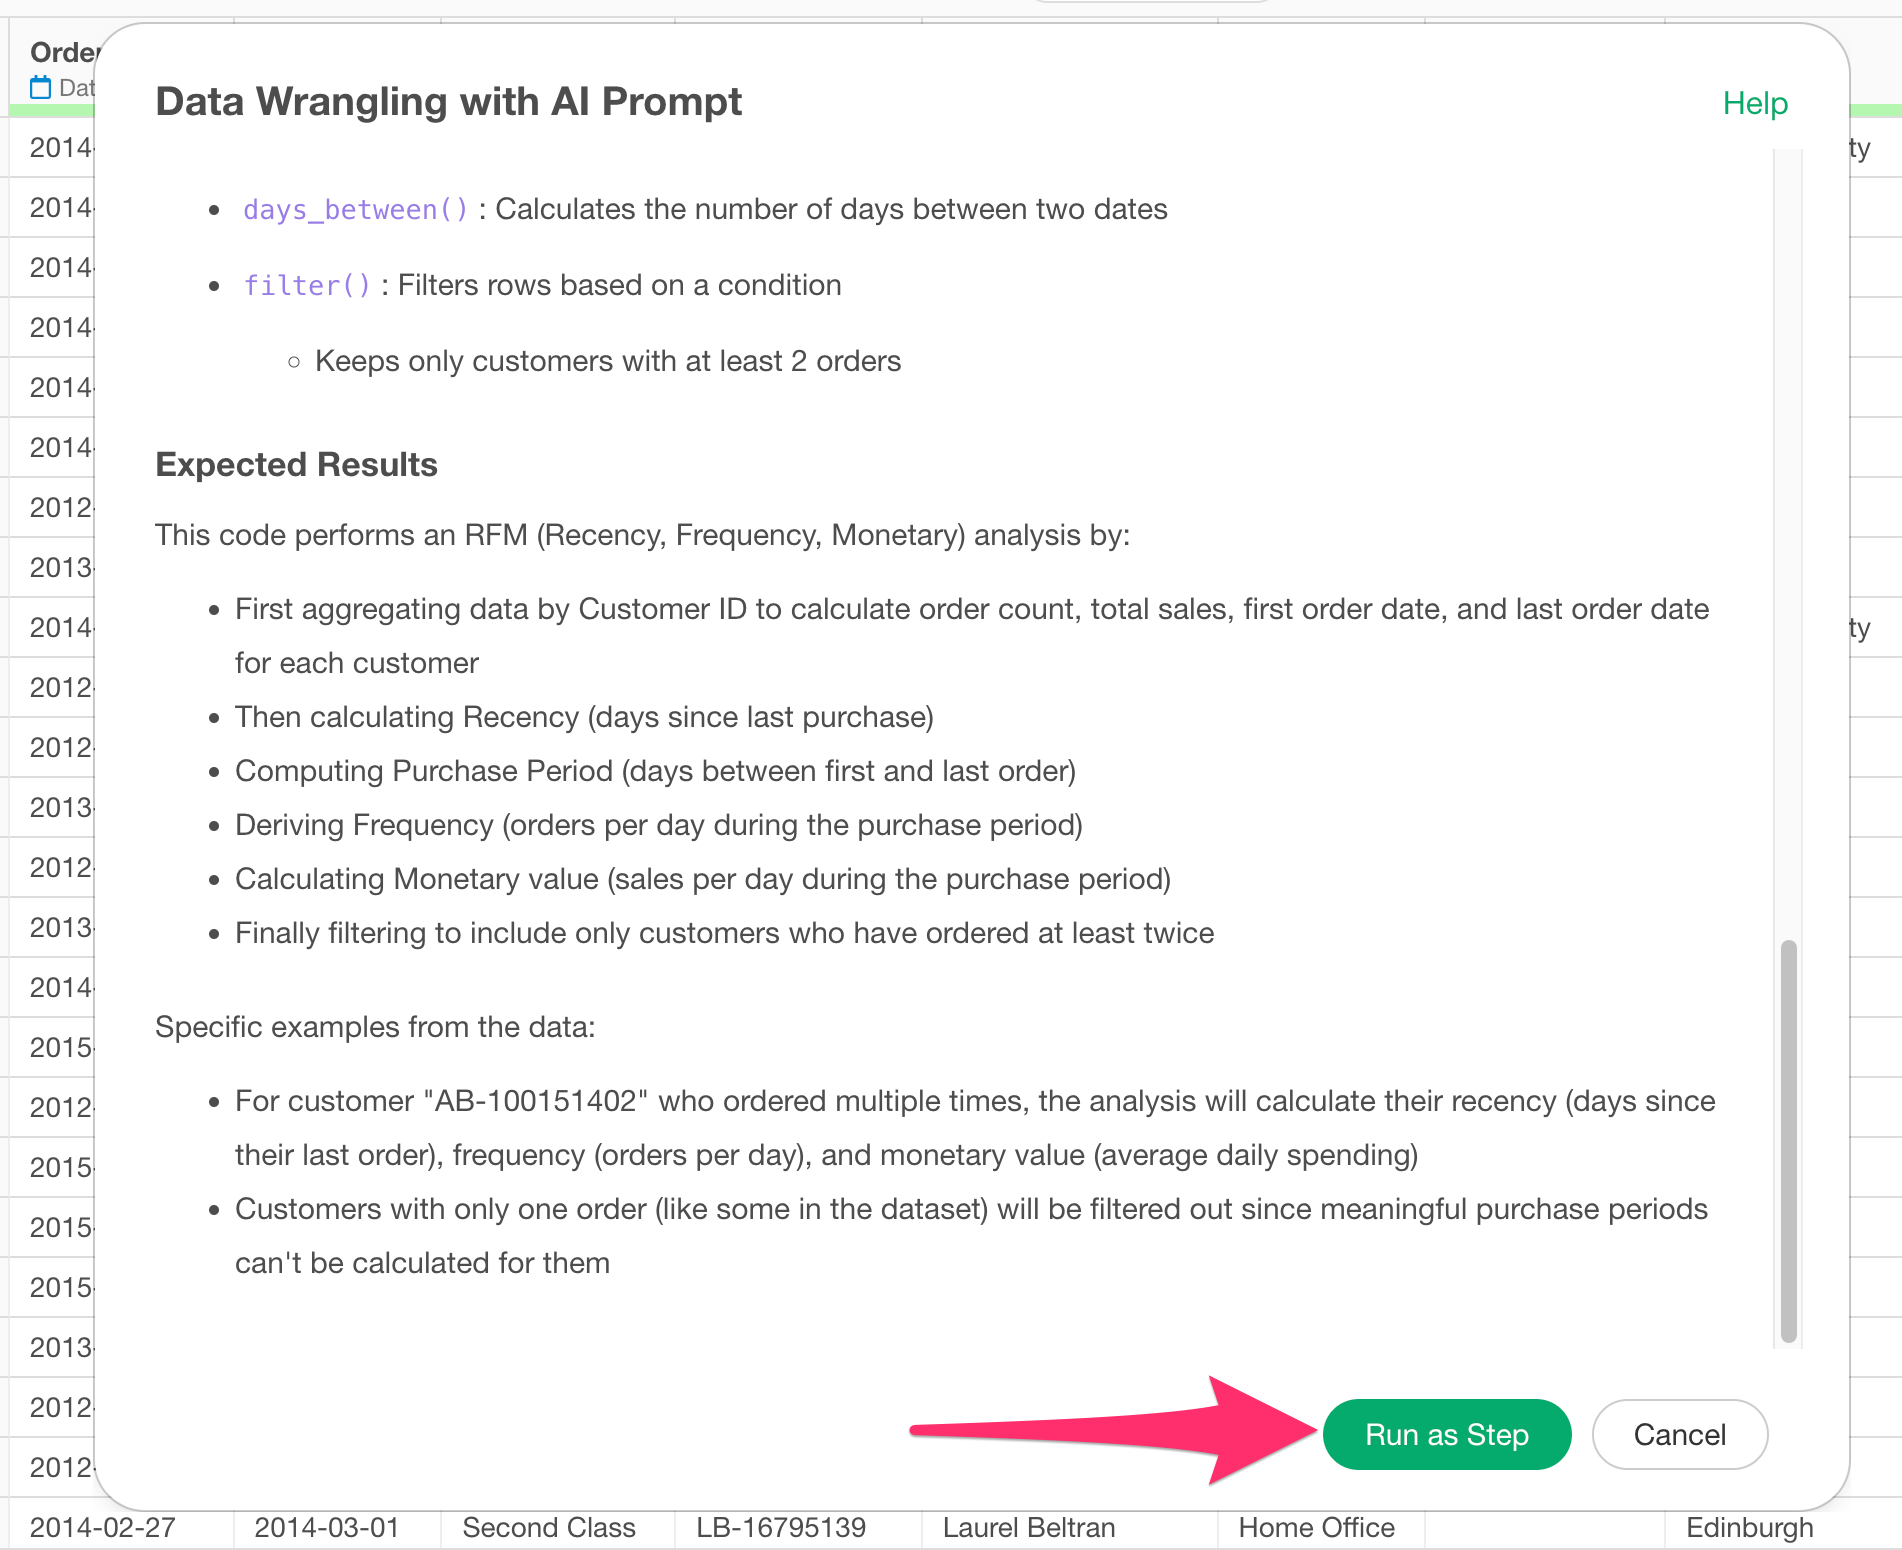
The step is added, and data for RFM analysis has been created.
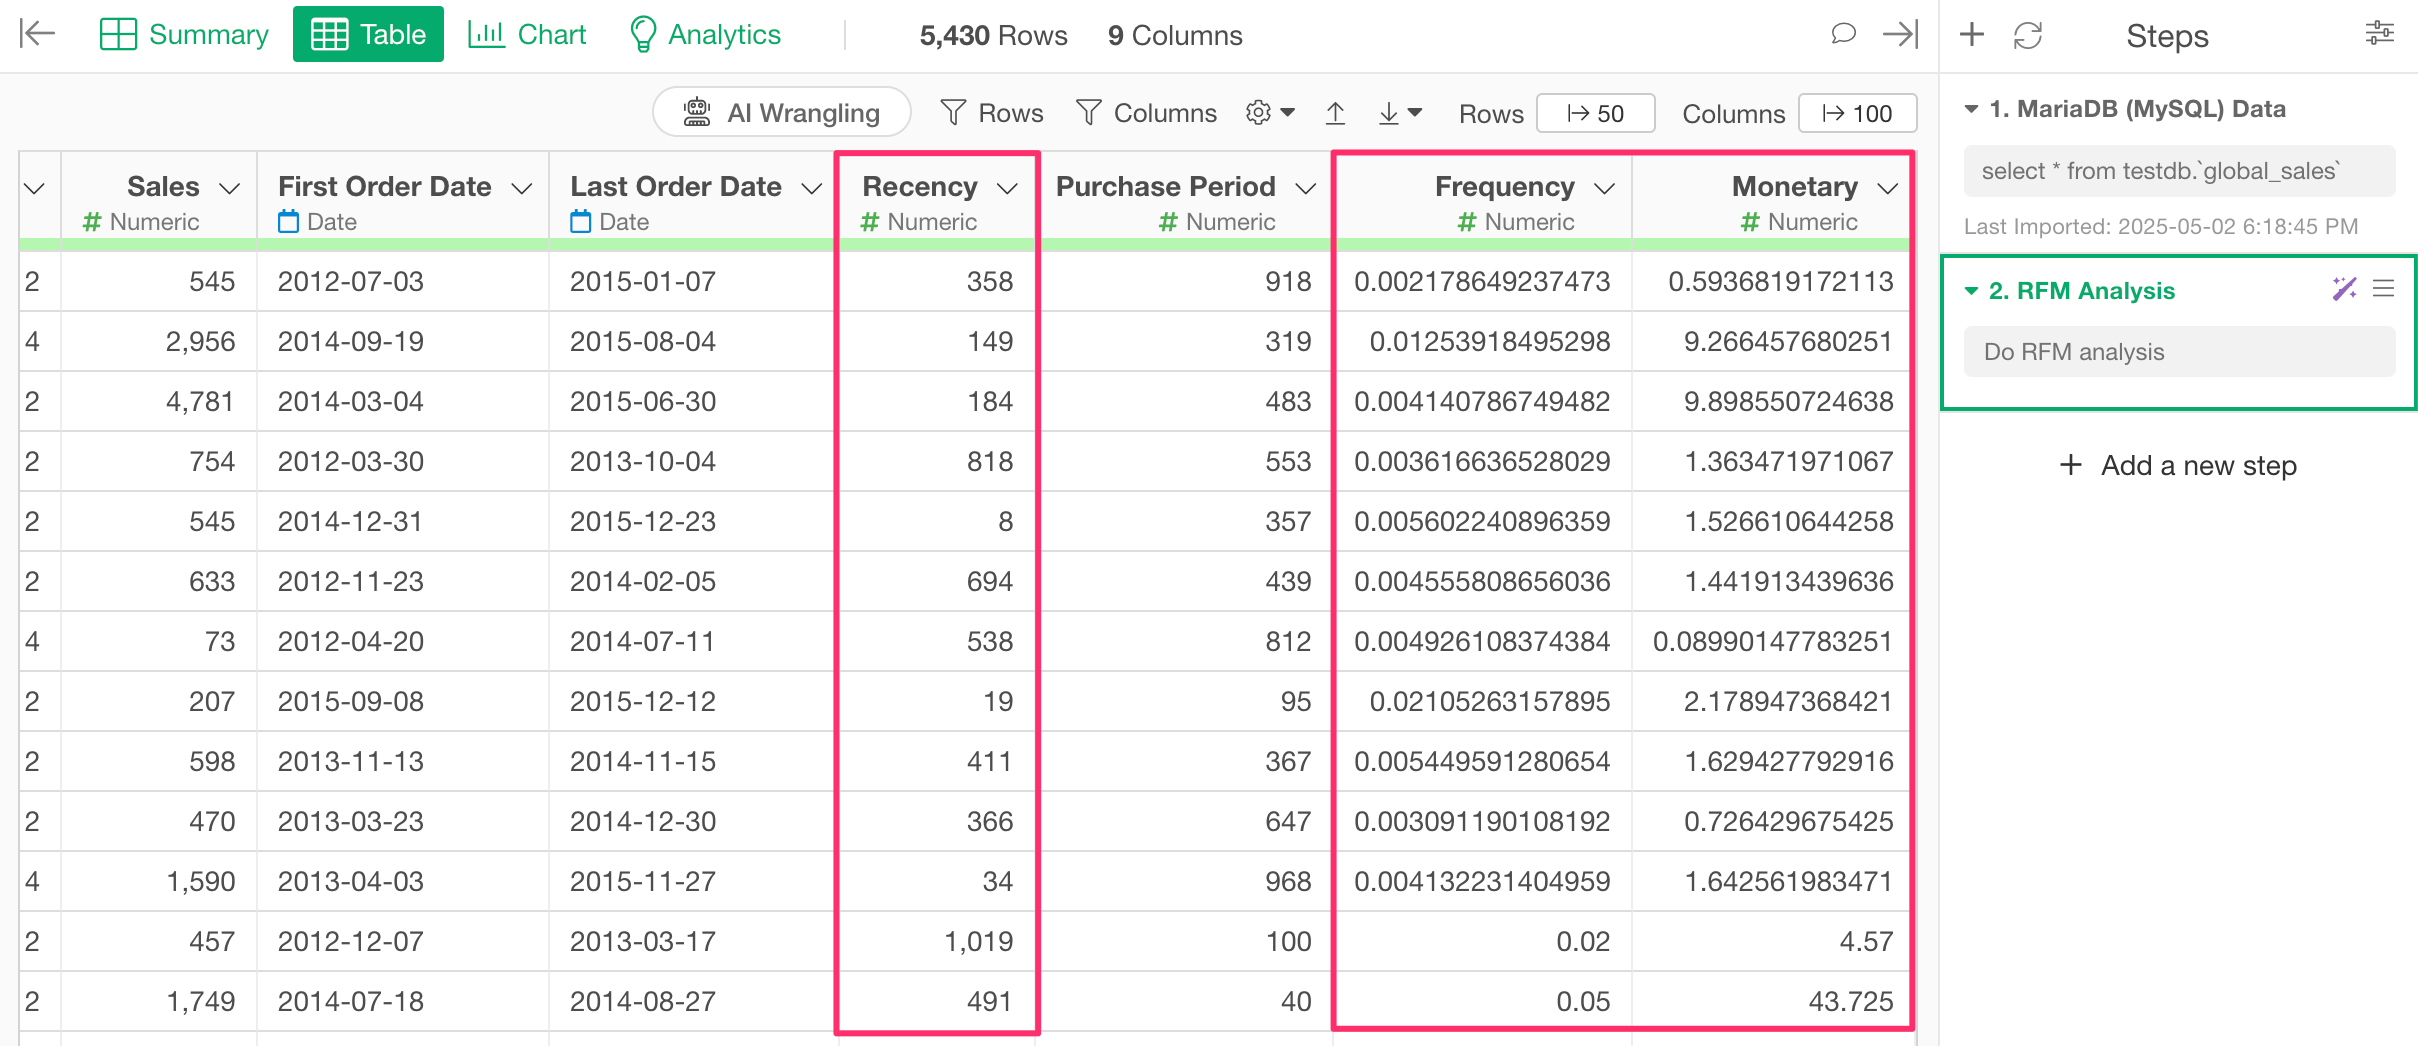
At this stage, the R, F, and M indicators have been calculated, but the grouping of each indicator is not yet complete.
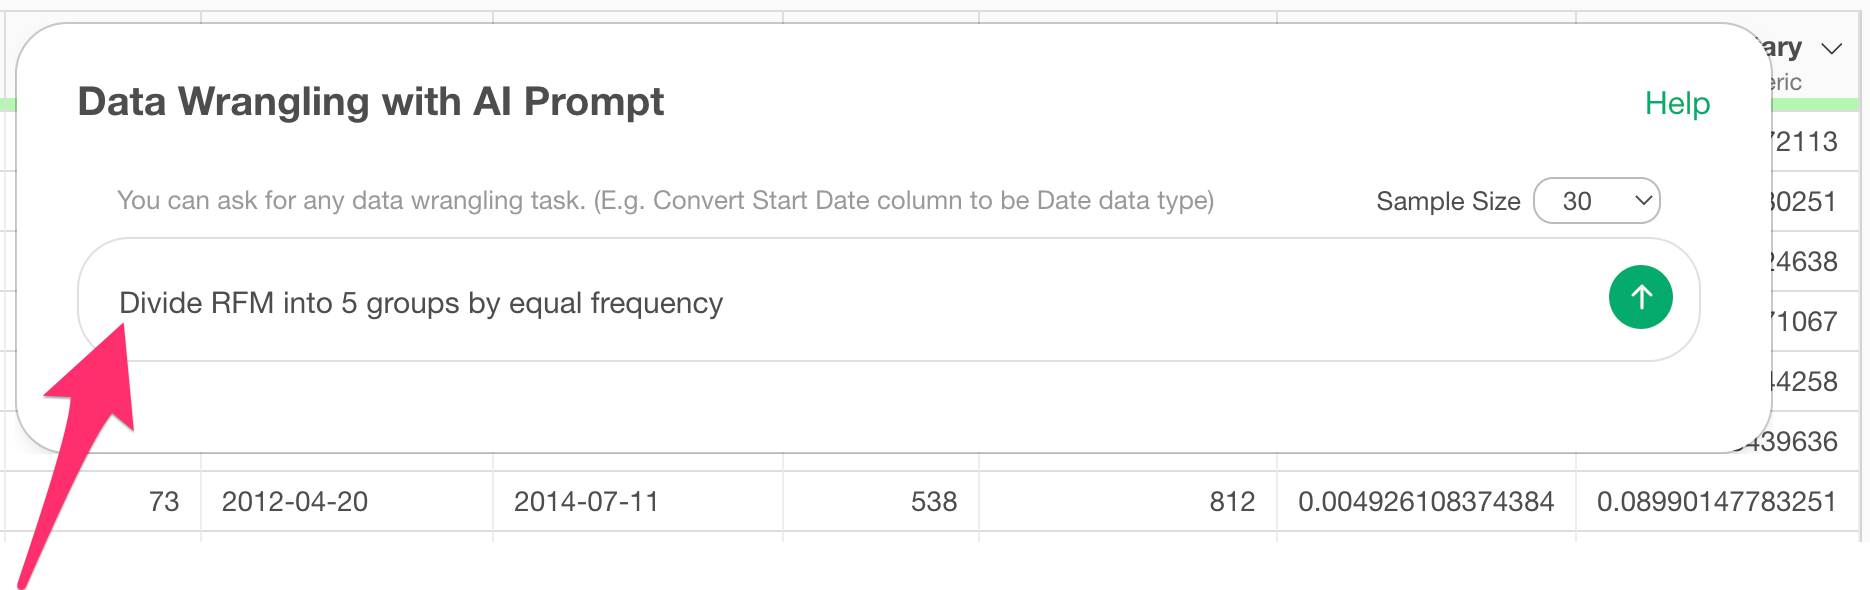
To divide each indicator into groups, click the “AI Wrangling” button again and enter the following text:
Divide RFM into 5 groups by equal frequency
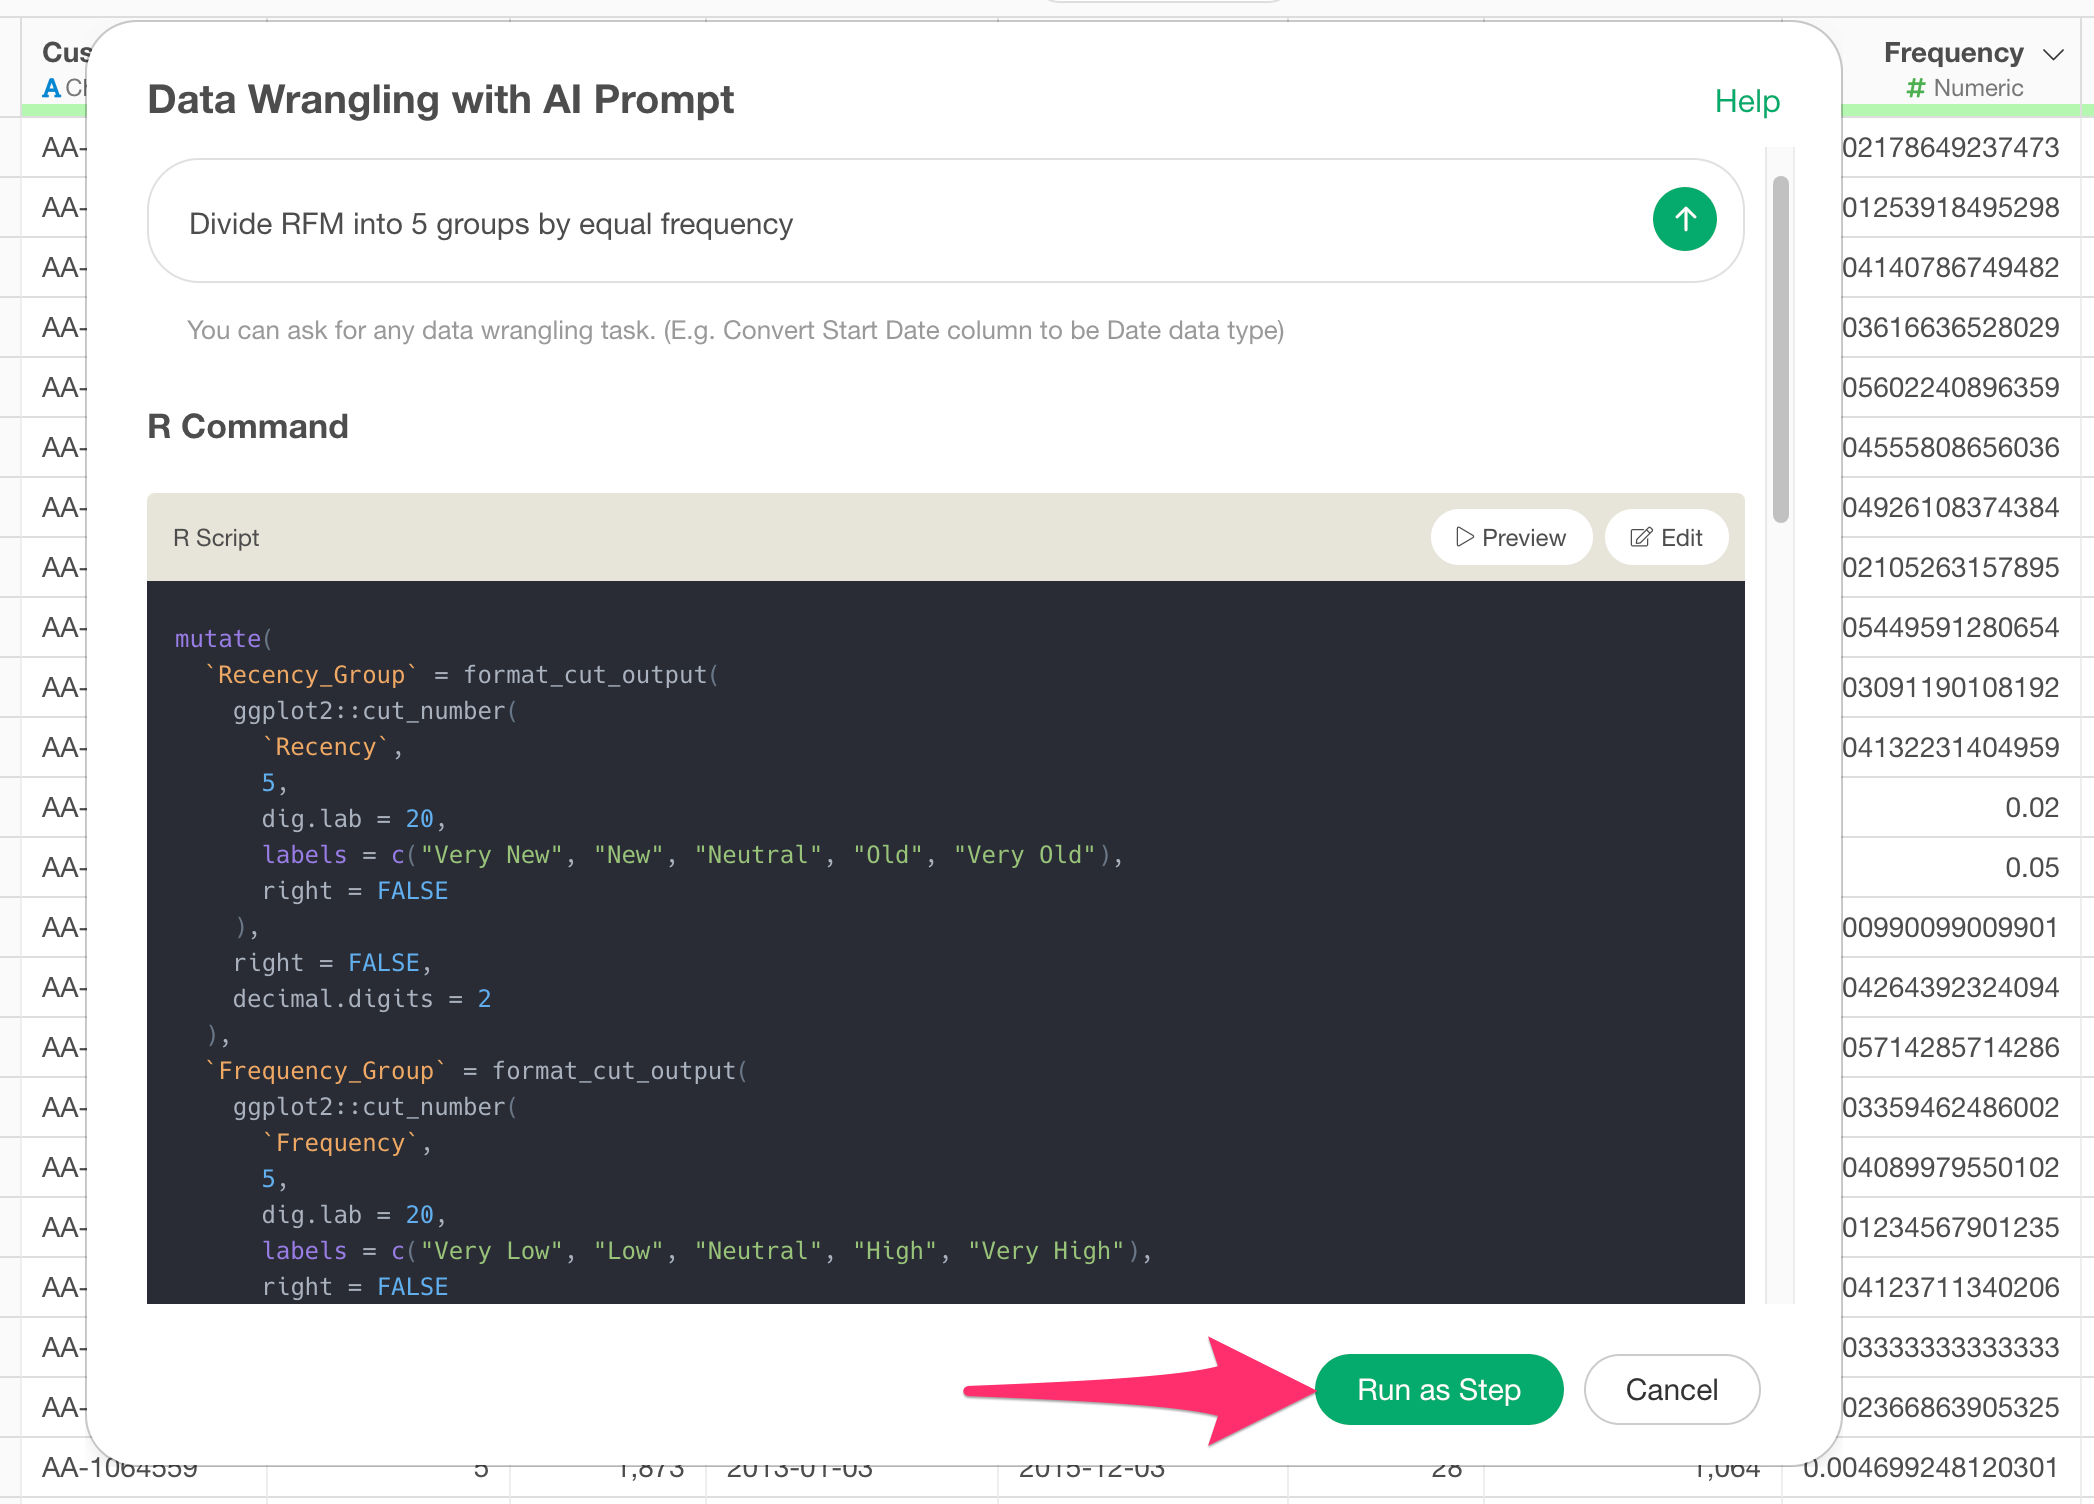
Confirm the generation of code to divide each indicator into 5 groups by equal frequency, then click the “Run as Step” button.
Now each indicator has been divided into 5 groups.
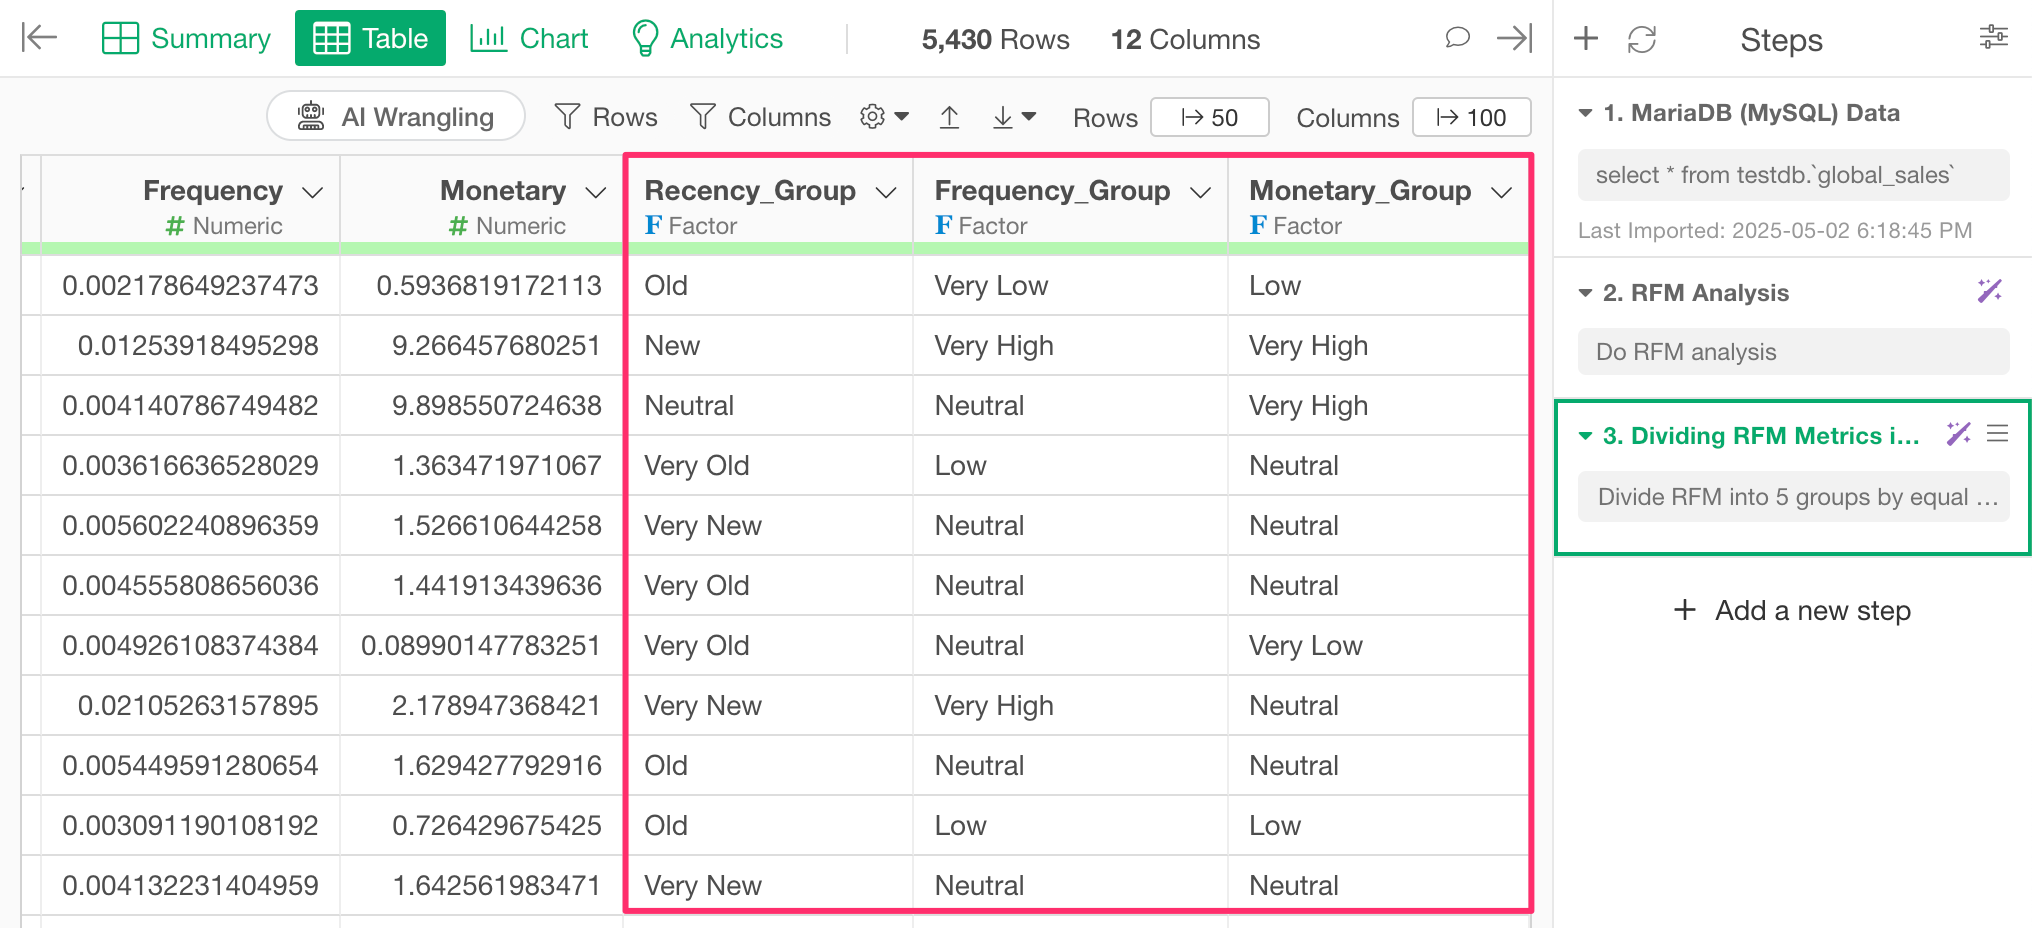
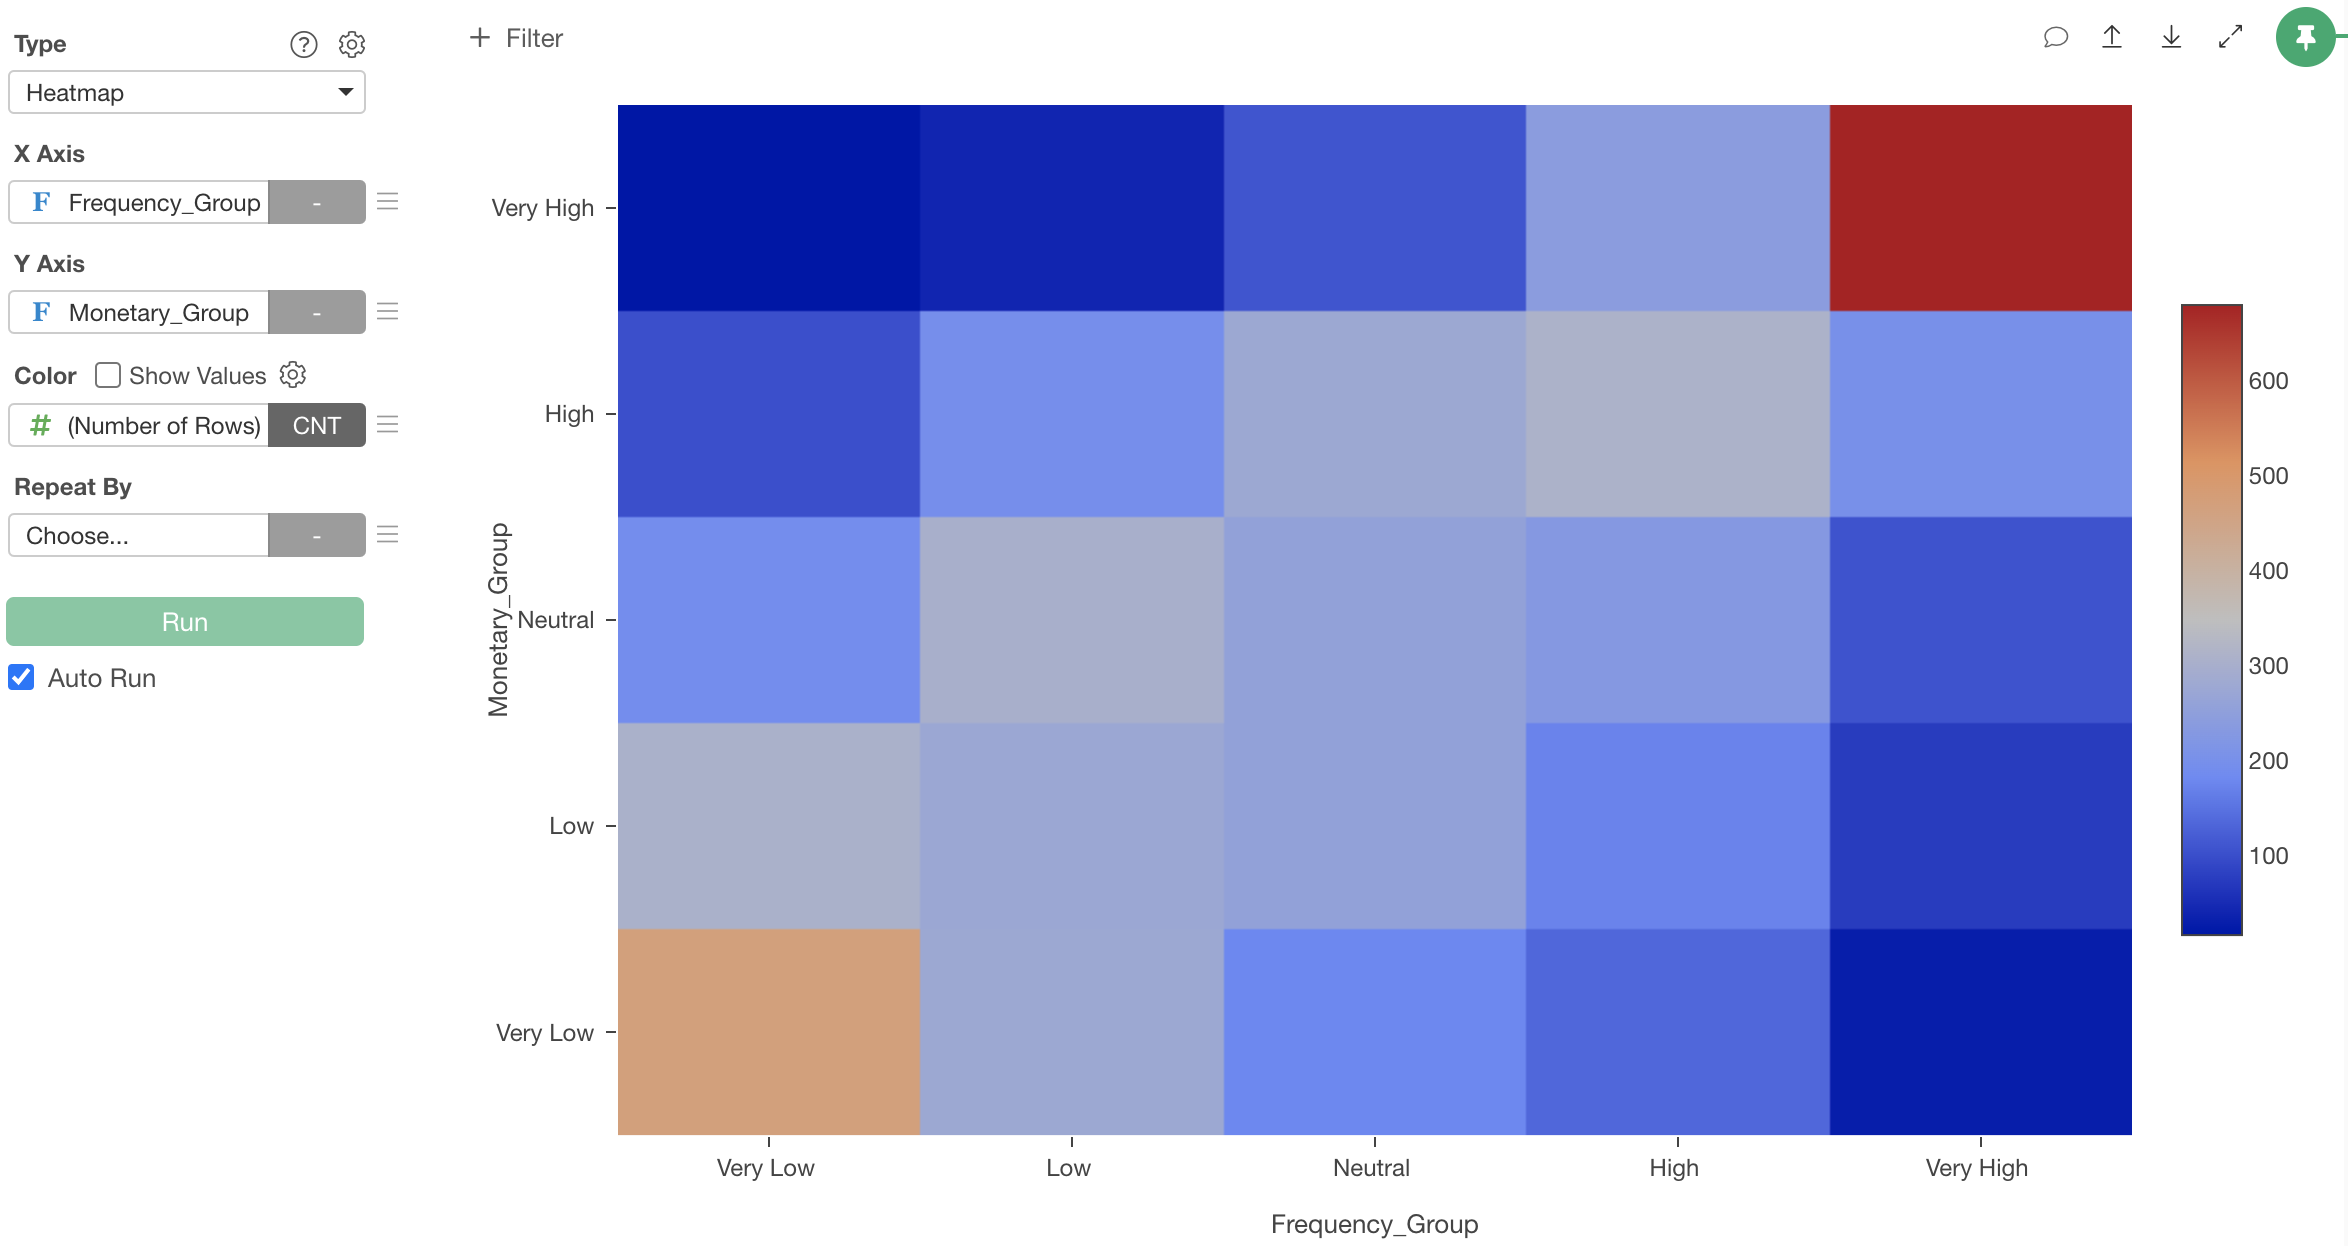
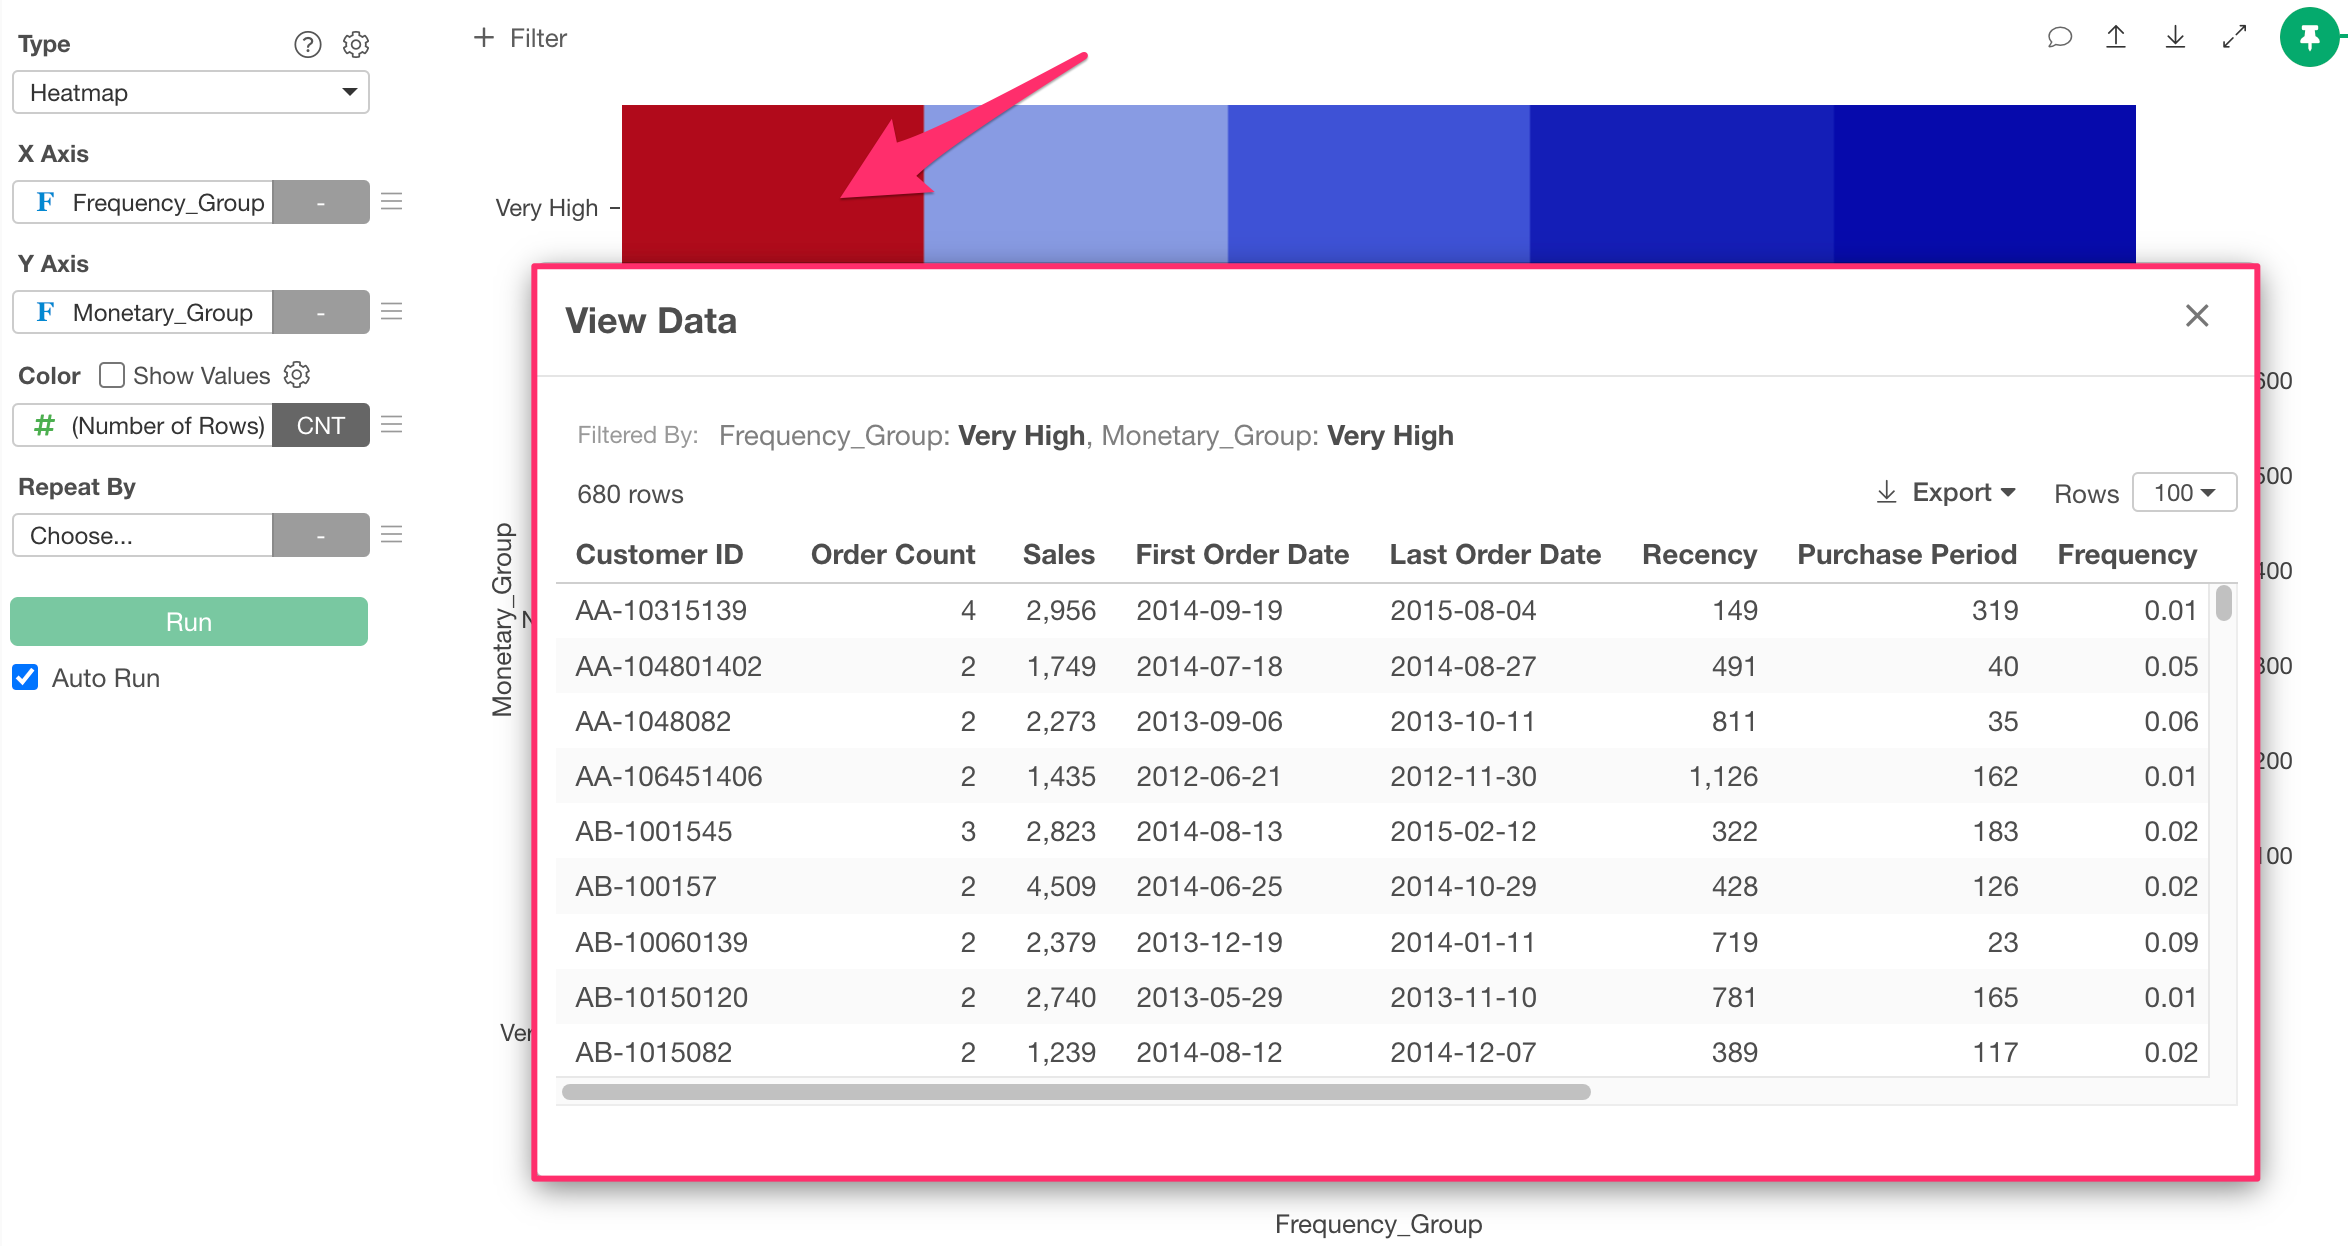
Next, you can visualize the customer segmentation results using a “Heat Map” chart to see which segments have the highest concentration of customers.
Furthermore, by clicking on each segment, you can check the information of customers in that segment or export the data.
Summary
In this article, we introduced how to execute RFM analysis using Exploratory’s AI feature, “AI Prompt.”
Previously, implementing RFM analysis required knowledge of data processing methods and the skills to put them into practice. With Exploratory, you can easily execute RFM analysis simply by giving instructions in natural language!
If you haven’t used Exploratory before, please try the 30-day free trial!