Introducing “AI Summary” - Interpreting Analysis Results with AI
The AI Summary feature is a function that summarizes analysis results from certain analytics, such as K-Means Clustering, Factor Analysis, and Text Analysis, and presents them in natural language.
The supported analytics are as follows.
- K-Means Clustering
- Factor Analysis
- Correspondence Analysis
- Text Analysis - Word Count
- Text Analysis - Topic Model
With this AI Summary, the analysis results are automatically summarized by AI and explained in natural language that anyone can understand, solving the problem of “I have the results, but I don’t know what they mean.”
This time, we will introduce the results of “AI Summary” for “Text Analysis - Word Count” and “K-Means Clustering.”
Text Analysis - Word Count
For example, in “Word Count,” you can analyze what kind of word groups exist using charts like co-occurrence networks.
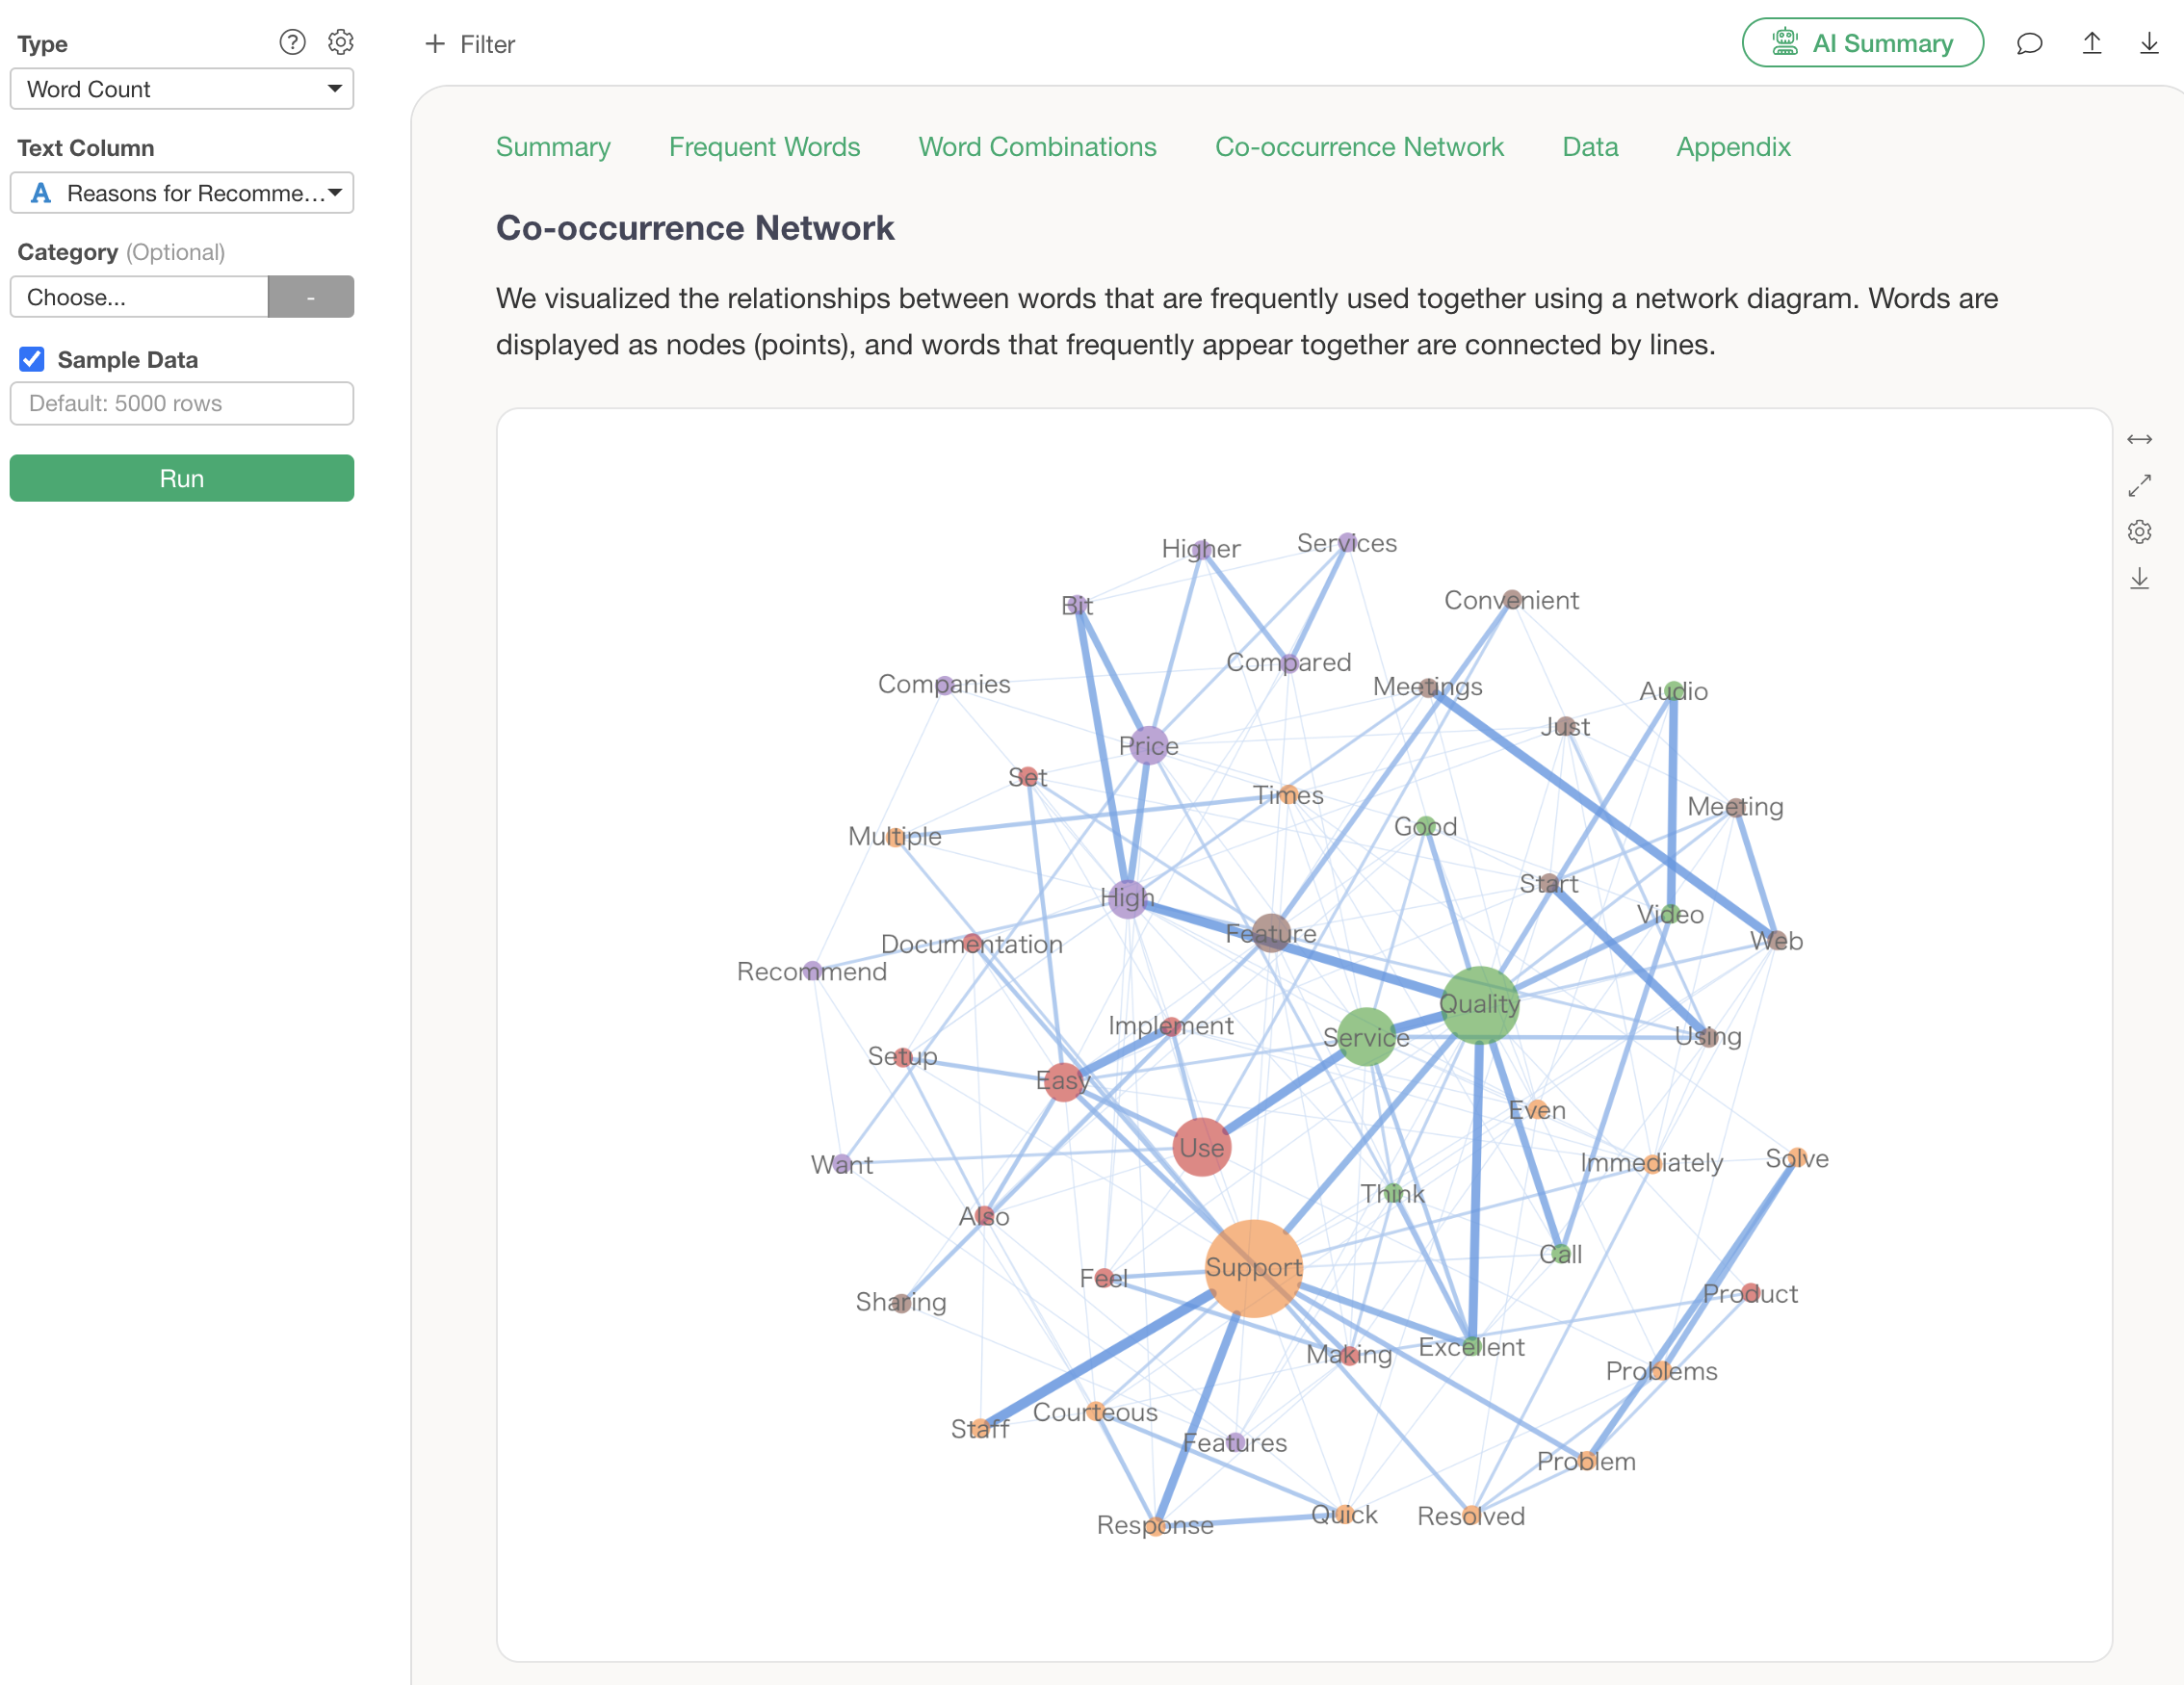
The analytics guide explains how to interpret the chart, so even those new to text analysis are guided on how to view it.
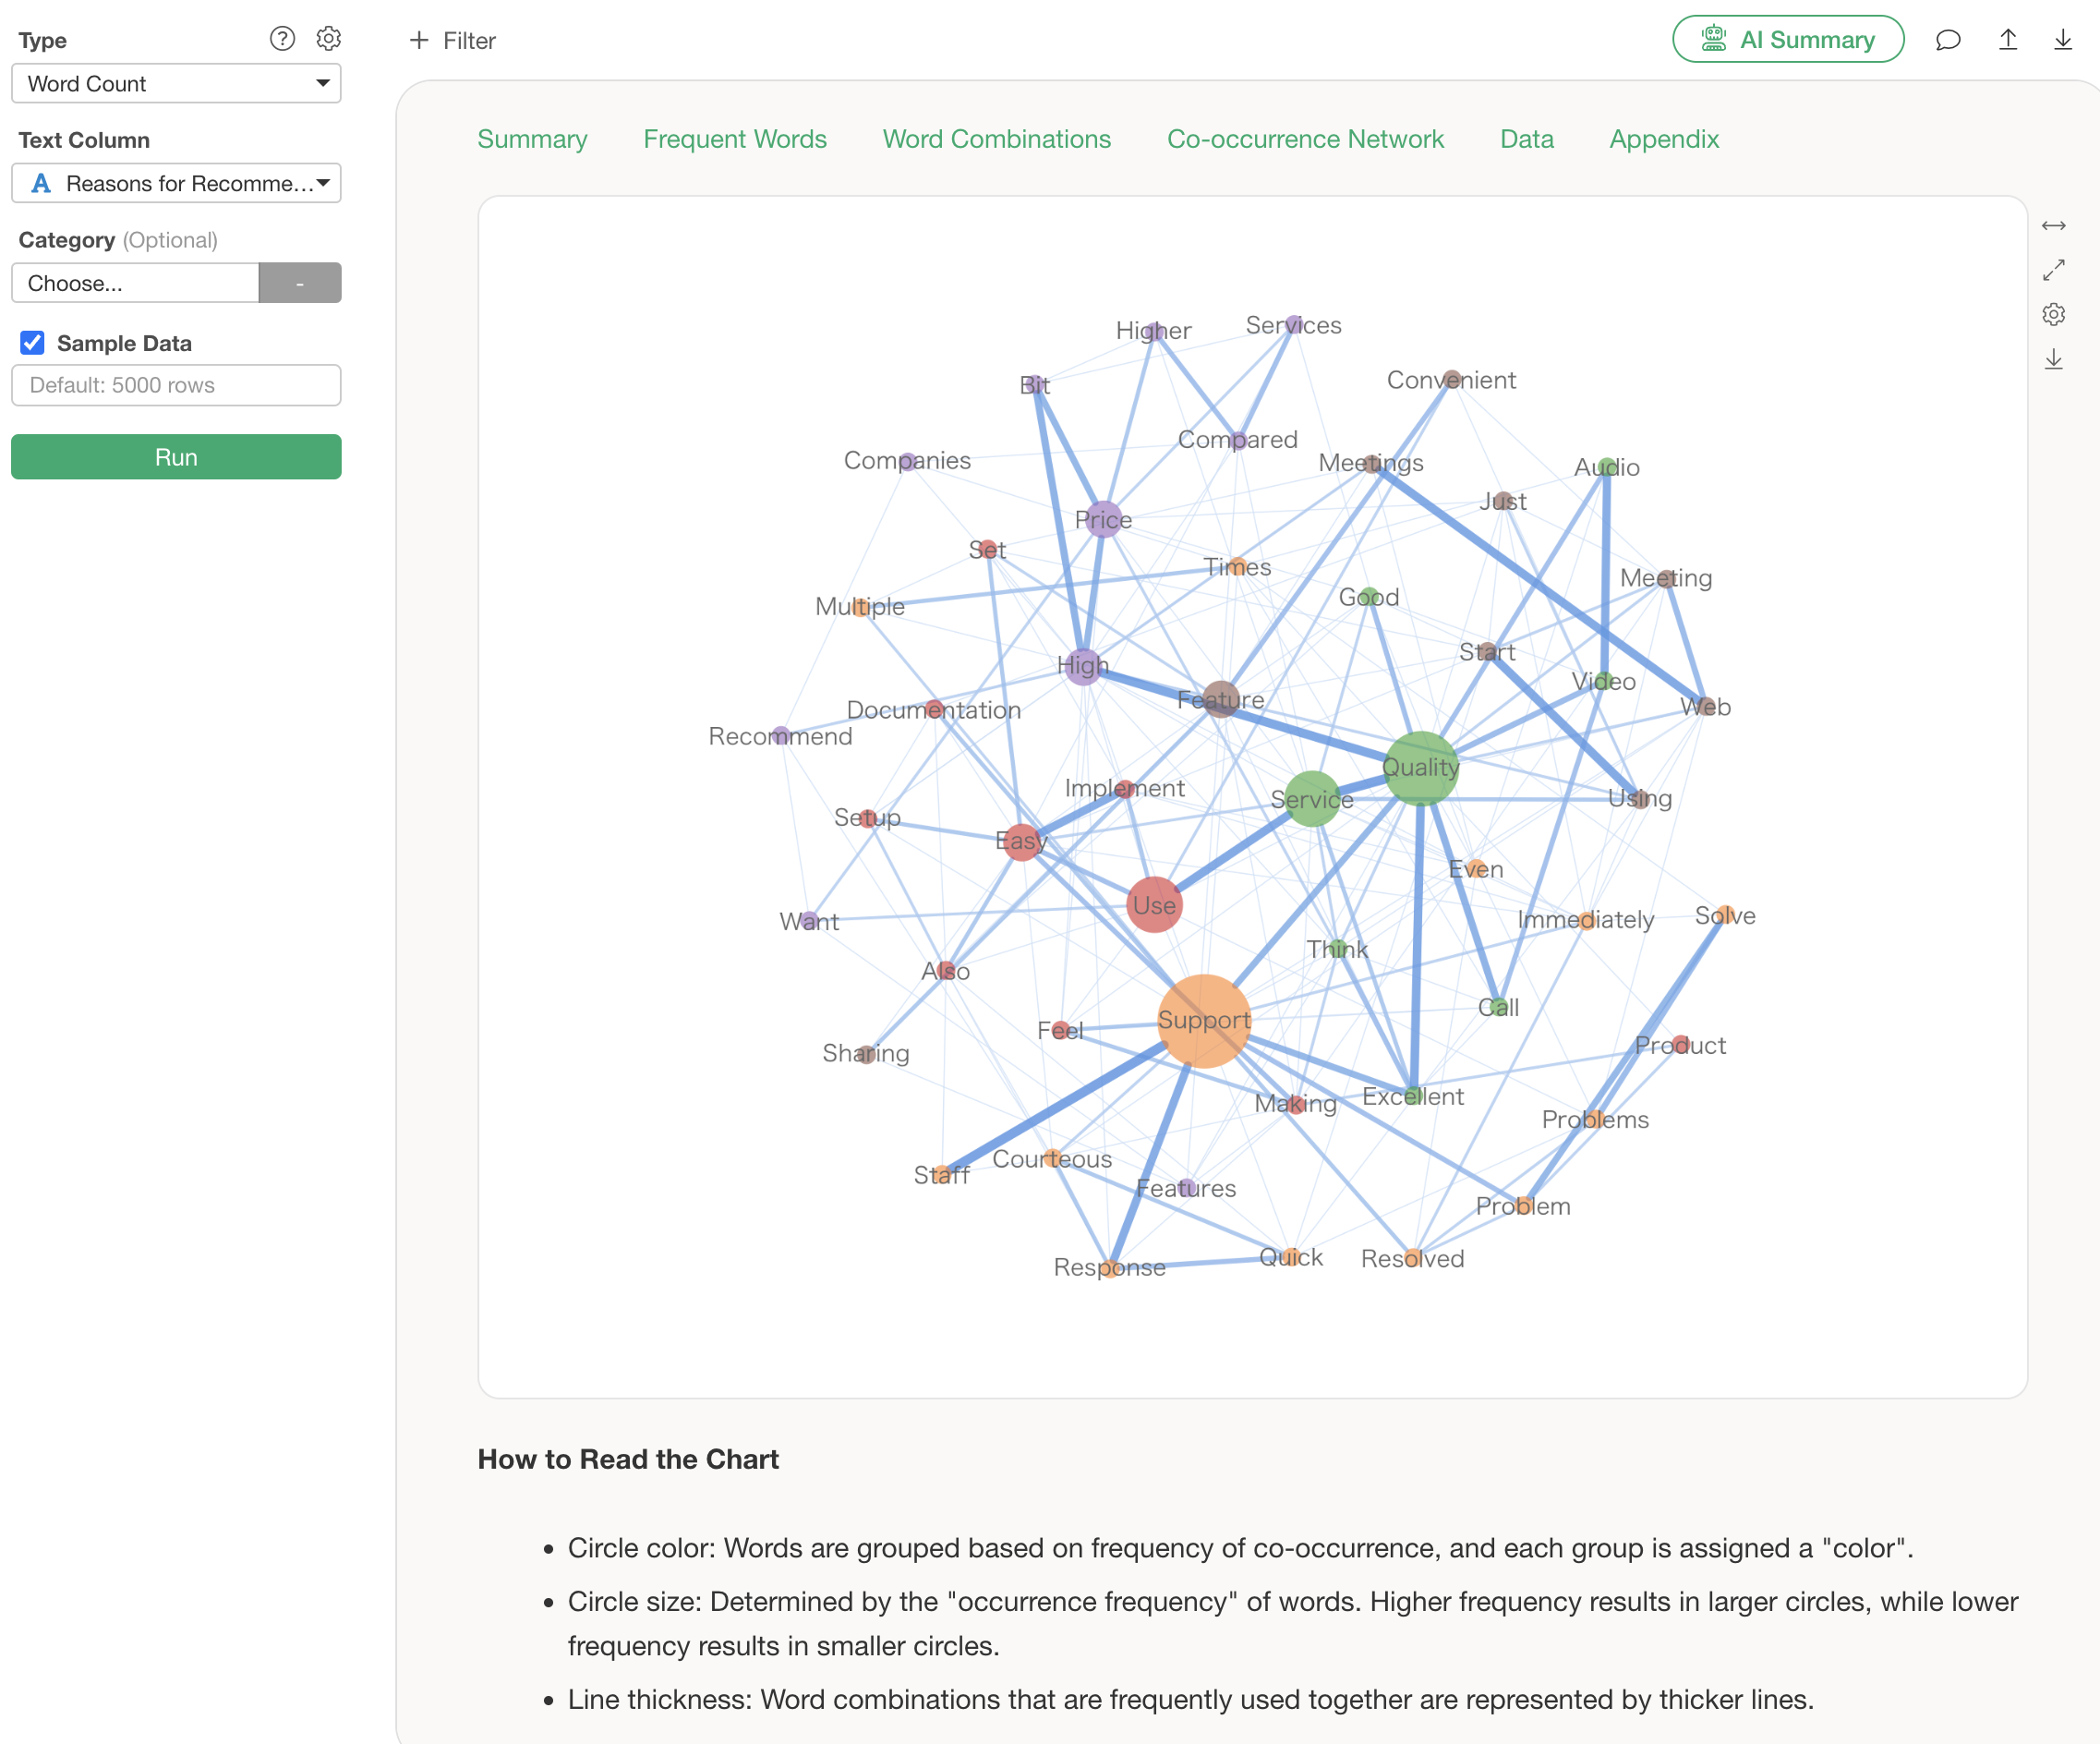
However, when interpreting the results of this co-occurrence network, there are the following problems:
- You have to learn how to read the chart.
- It takes time to view because you have to identify groups yourself.
- You don’t know the actual context in which the words were used.
By using the “AI Summary” feature, you can solve these problems!
The usage is surprisingly simple: just click the “AI Summary” button after running the analysis.

This outputs “Summary” information, which summarizes the overall trend of the text, and “Frequent Word Grouping” information, which summarizes the characteristics of each group and actual sentences.

Just by looking at this AI Summary, you can immediately determine what groups exist as a result of text analysis. Furthermore, examples of actual sentences are displayed, allowing you to understand the background of customer voices that cannot be seen from numerical data alone.
K-Means Clustering
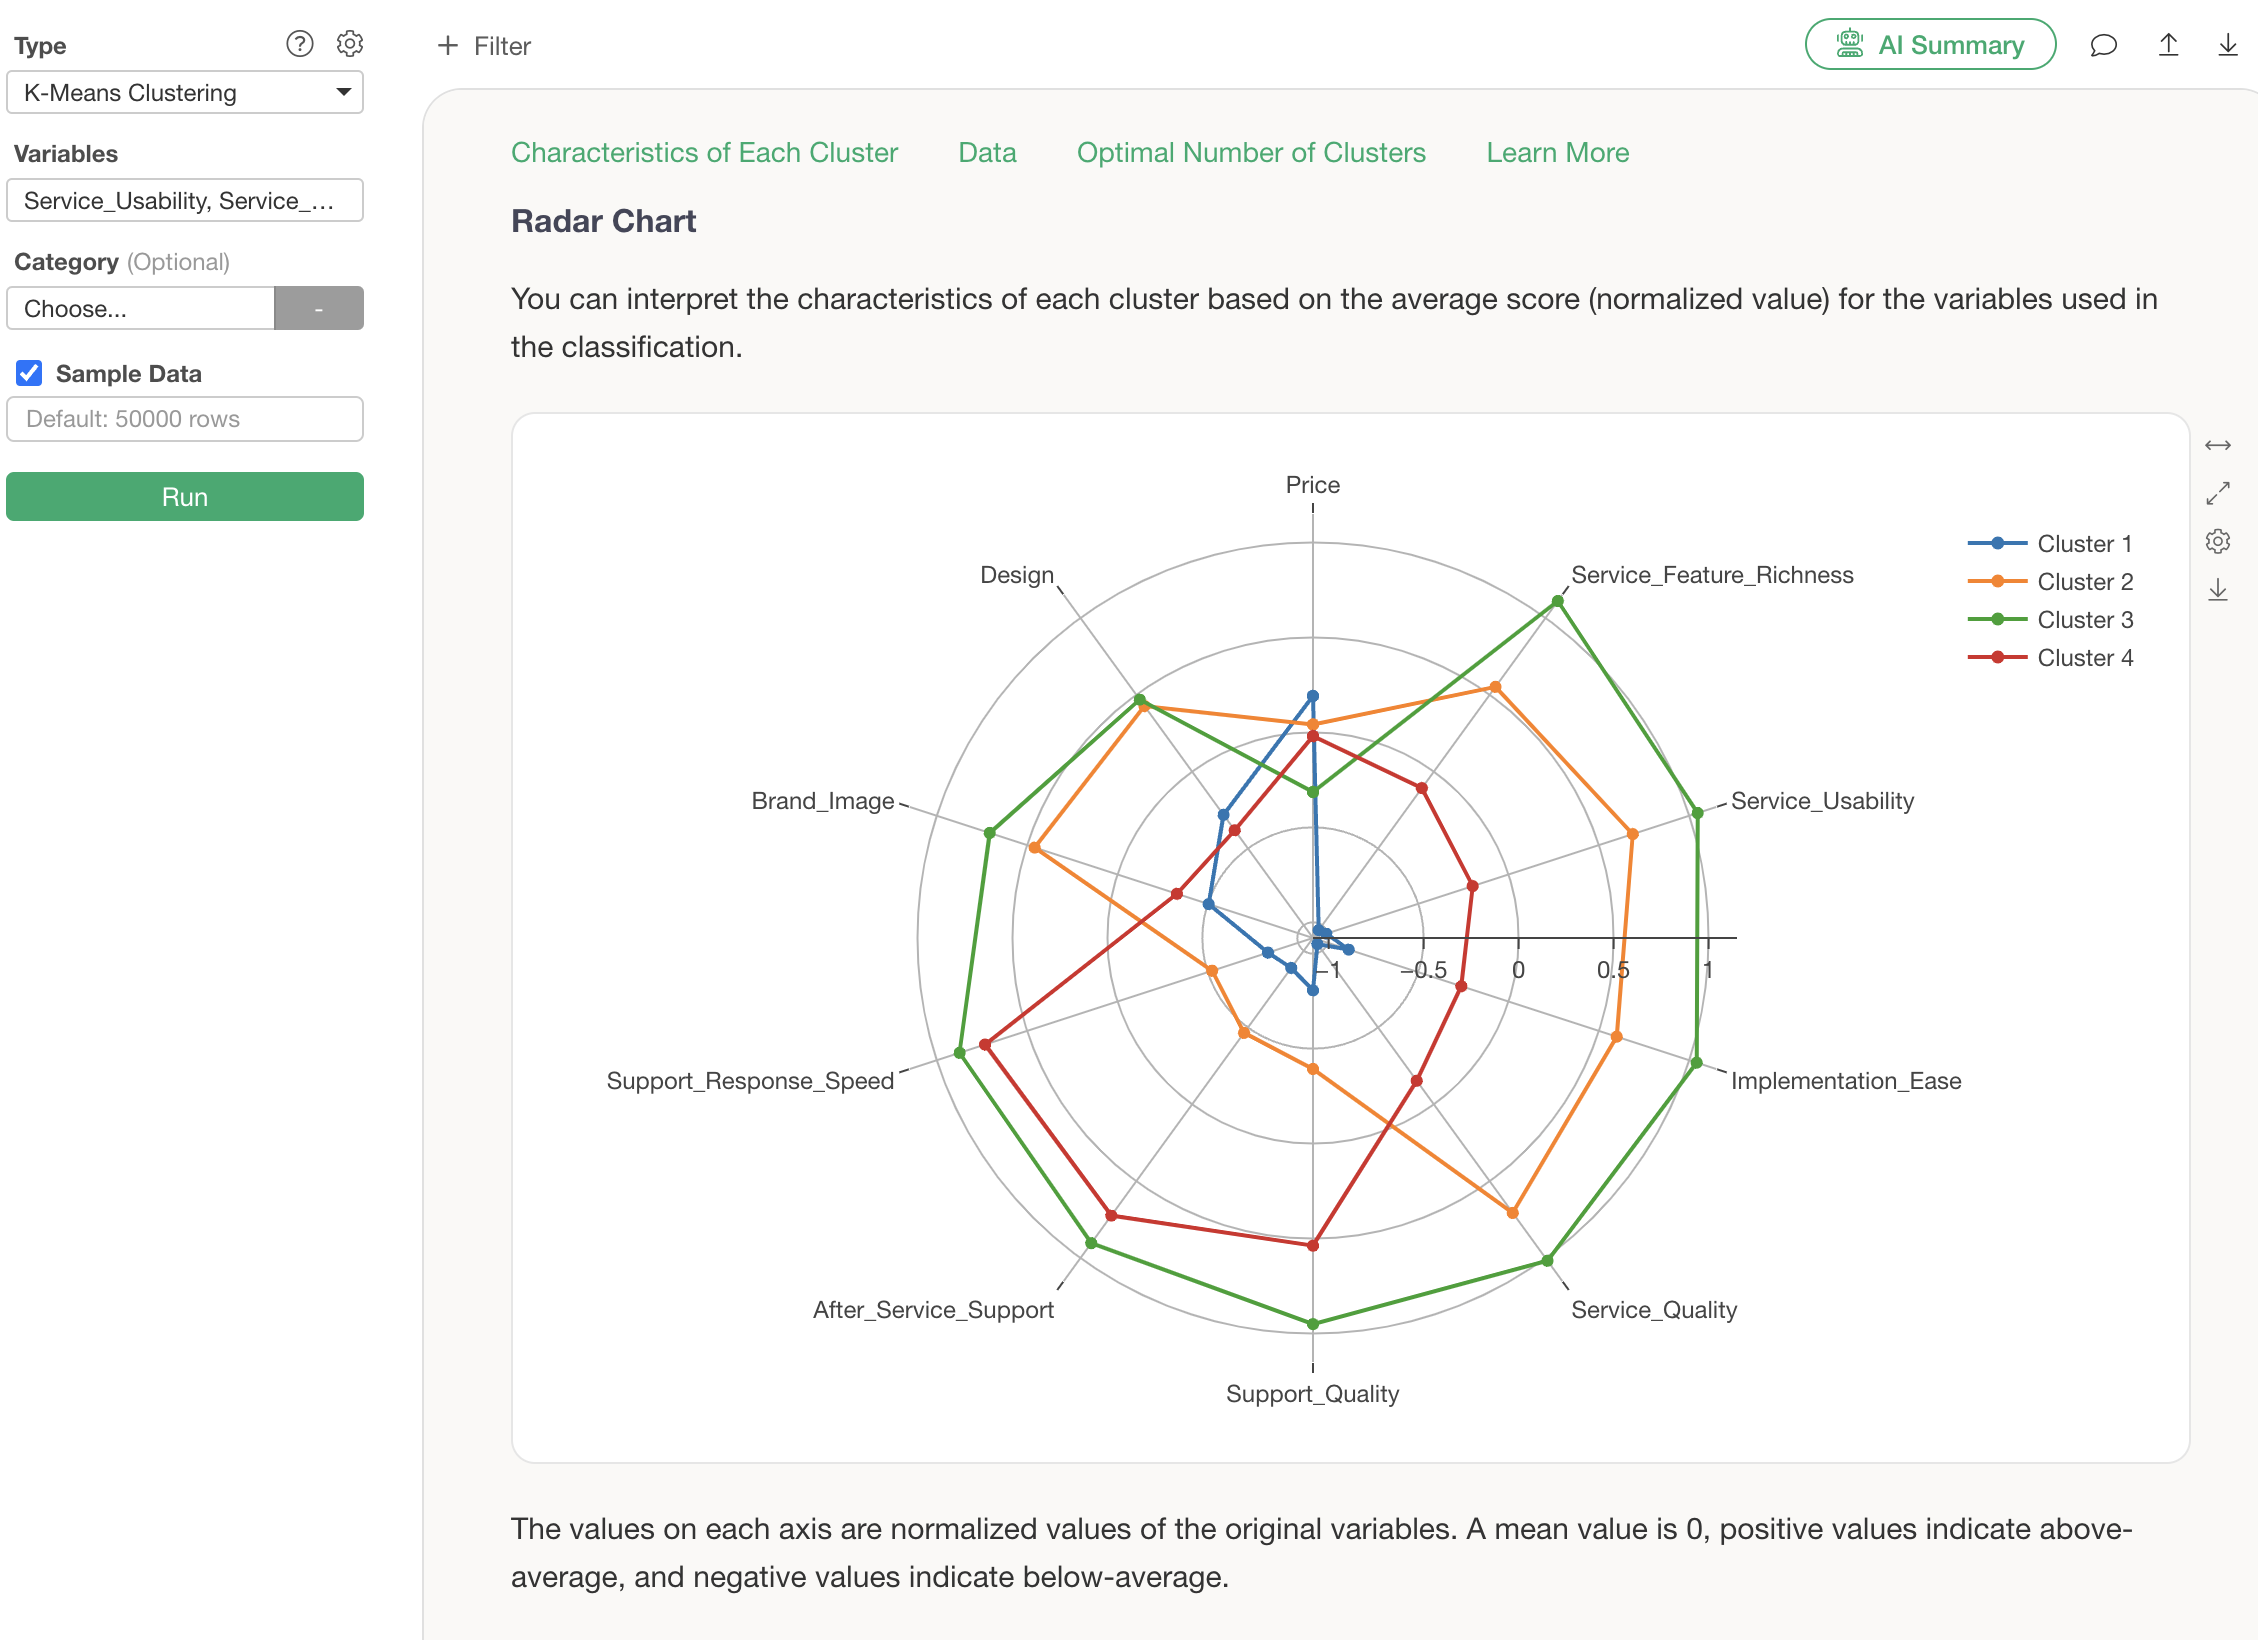
In K-Means Clustering, you can check the characteristics of each cluster using several charts such as radar charts and scatter plots (biplots).
The following is a radar chart, which shows that Cluster 3 generally has high ratings, and Cluster 1 generally has low ratings. The Guided Analytics also provides detailed explanations on how to read the charts.
However, even when looking at these charts, there are the following challenges:
- When using K-Means Clustering for the first time, interpretation can be difficult despite the explanations provided by Guided Analytics.
- It takes time because you have to interpret the characteristics of each cluster yourself.
- You don’t know how to label the characteristics of each cluster.
This is where “AI Summary” comes in!
After running K-Means Clustering, click the “AI Summary” button.
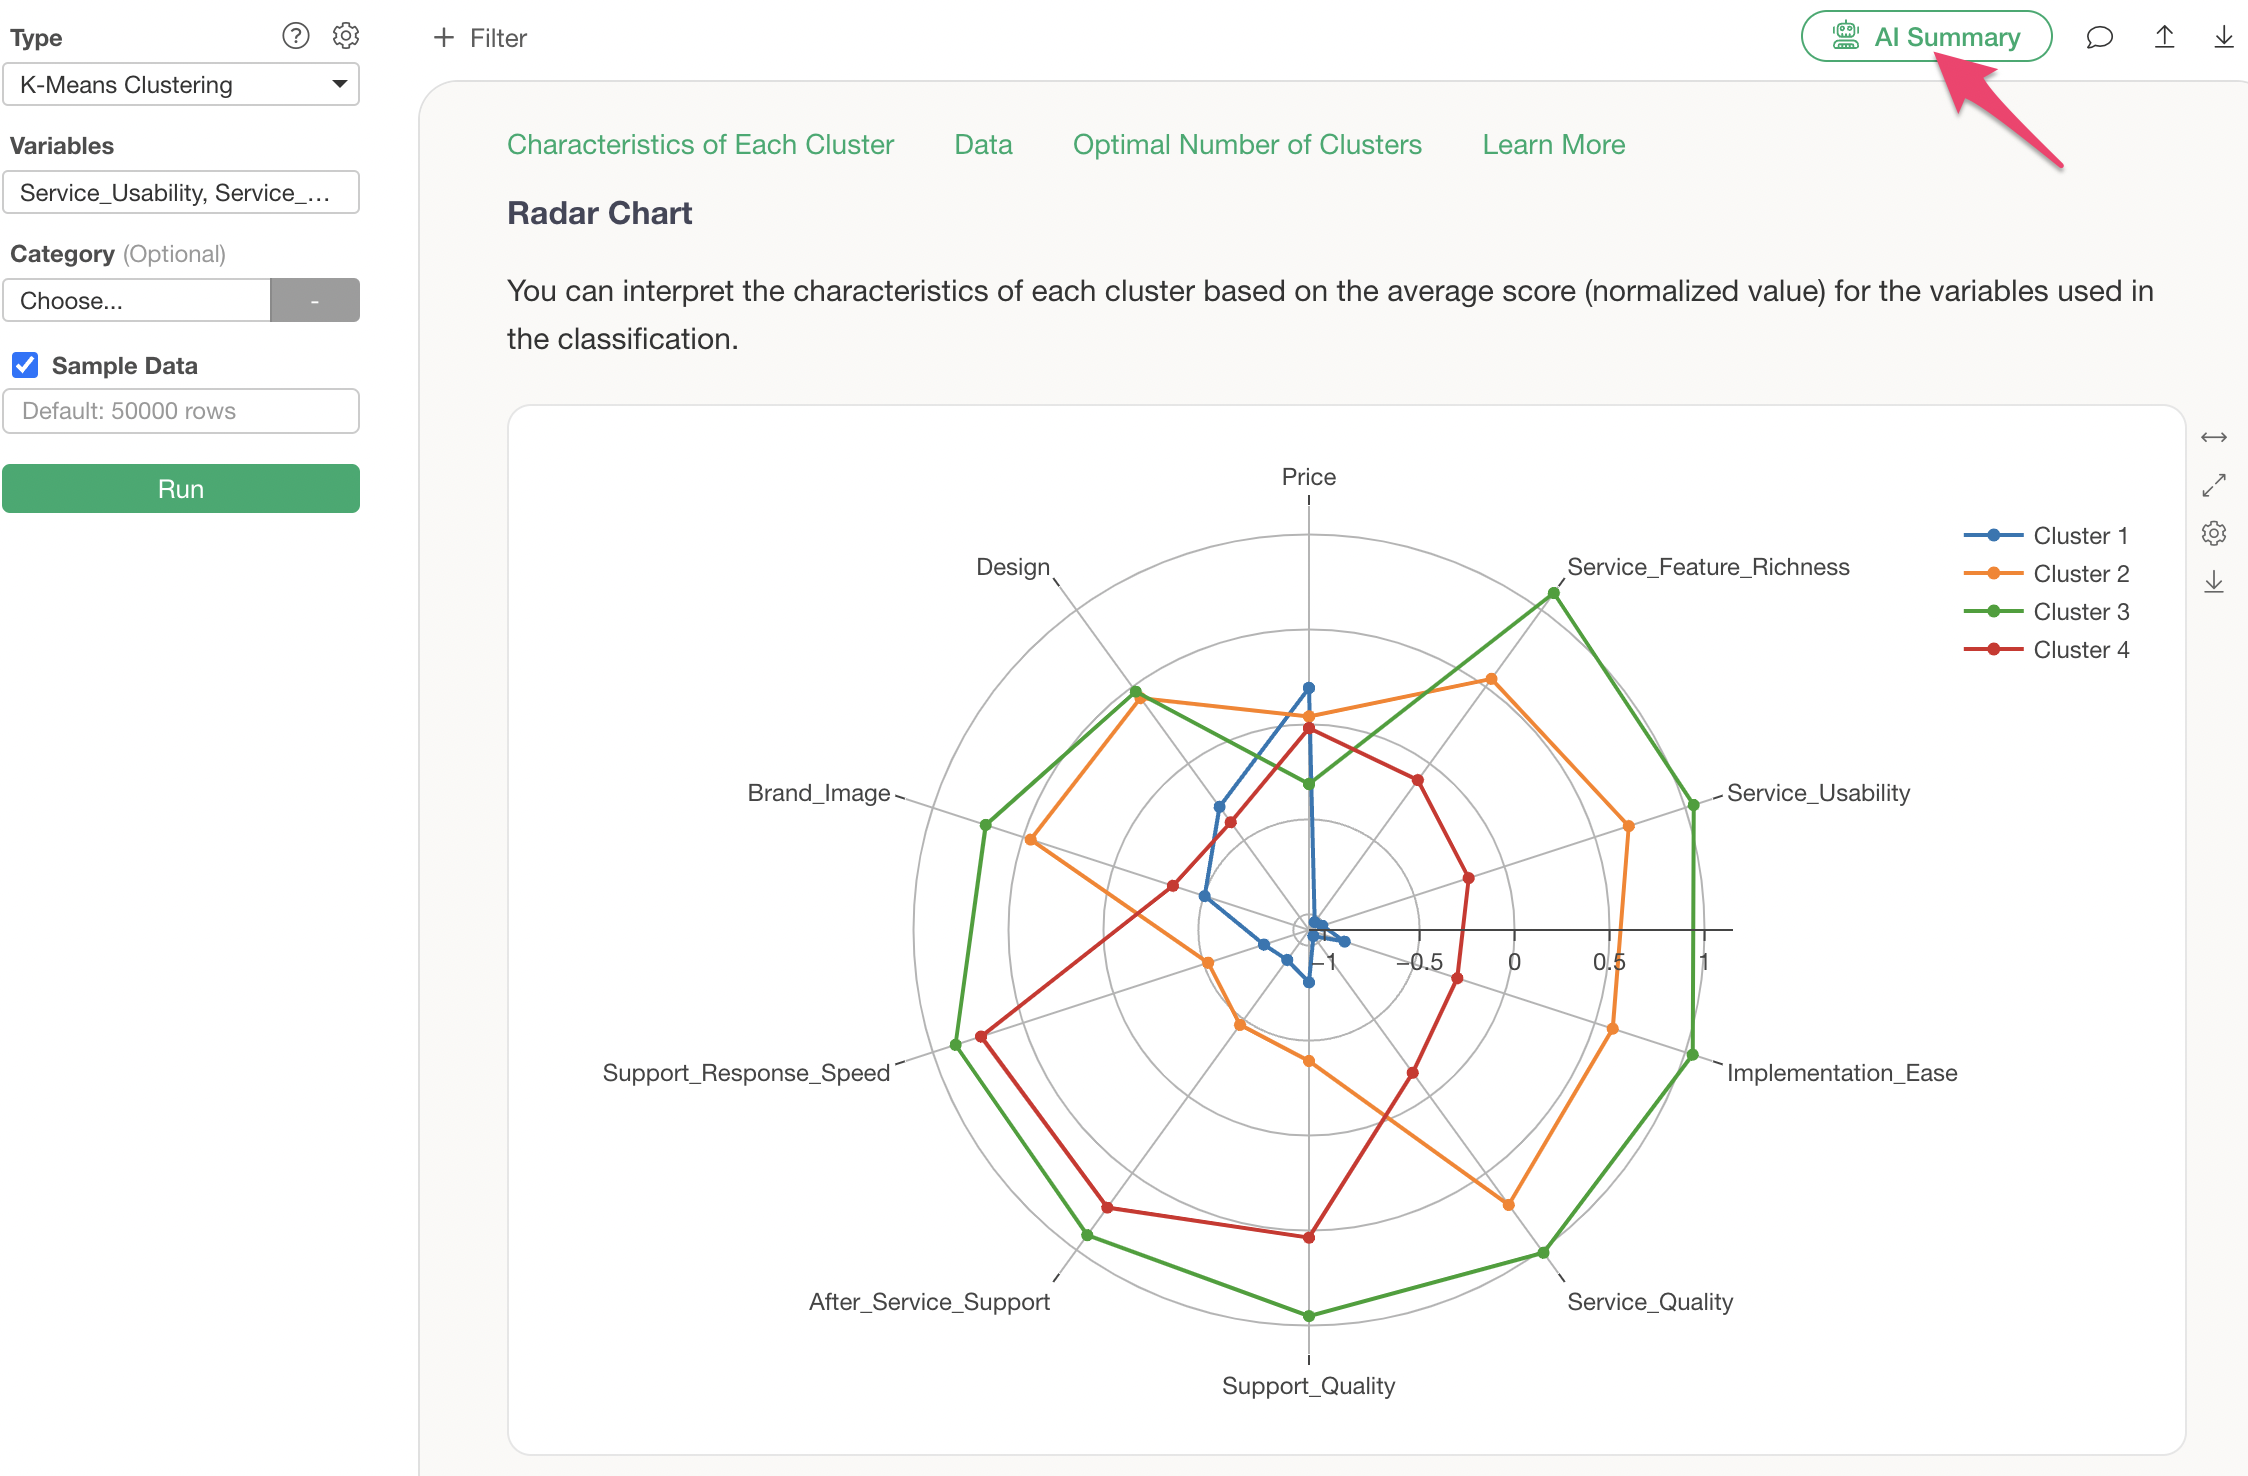
This outputs information summarizing the cluster names and characteristics of each cluster (group).
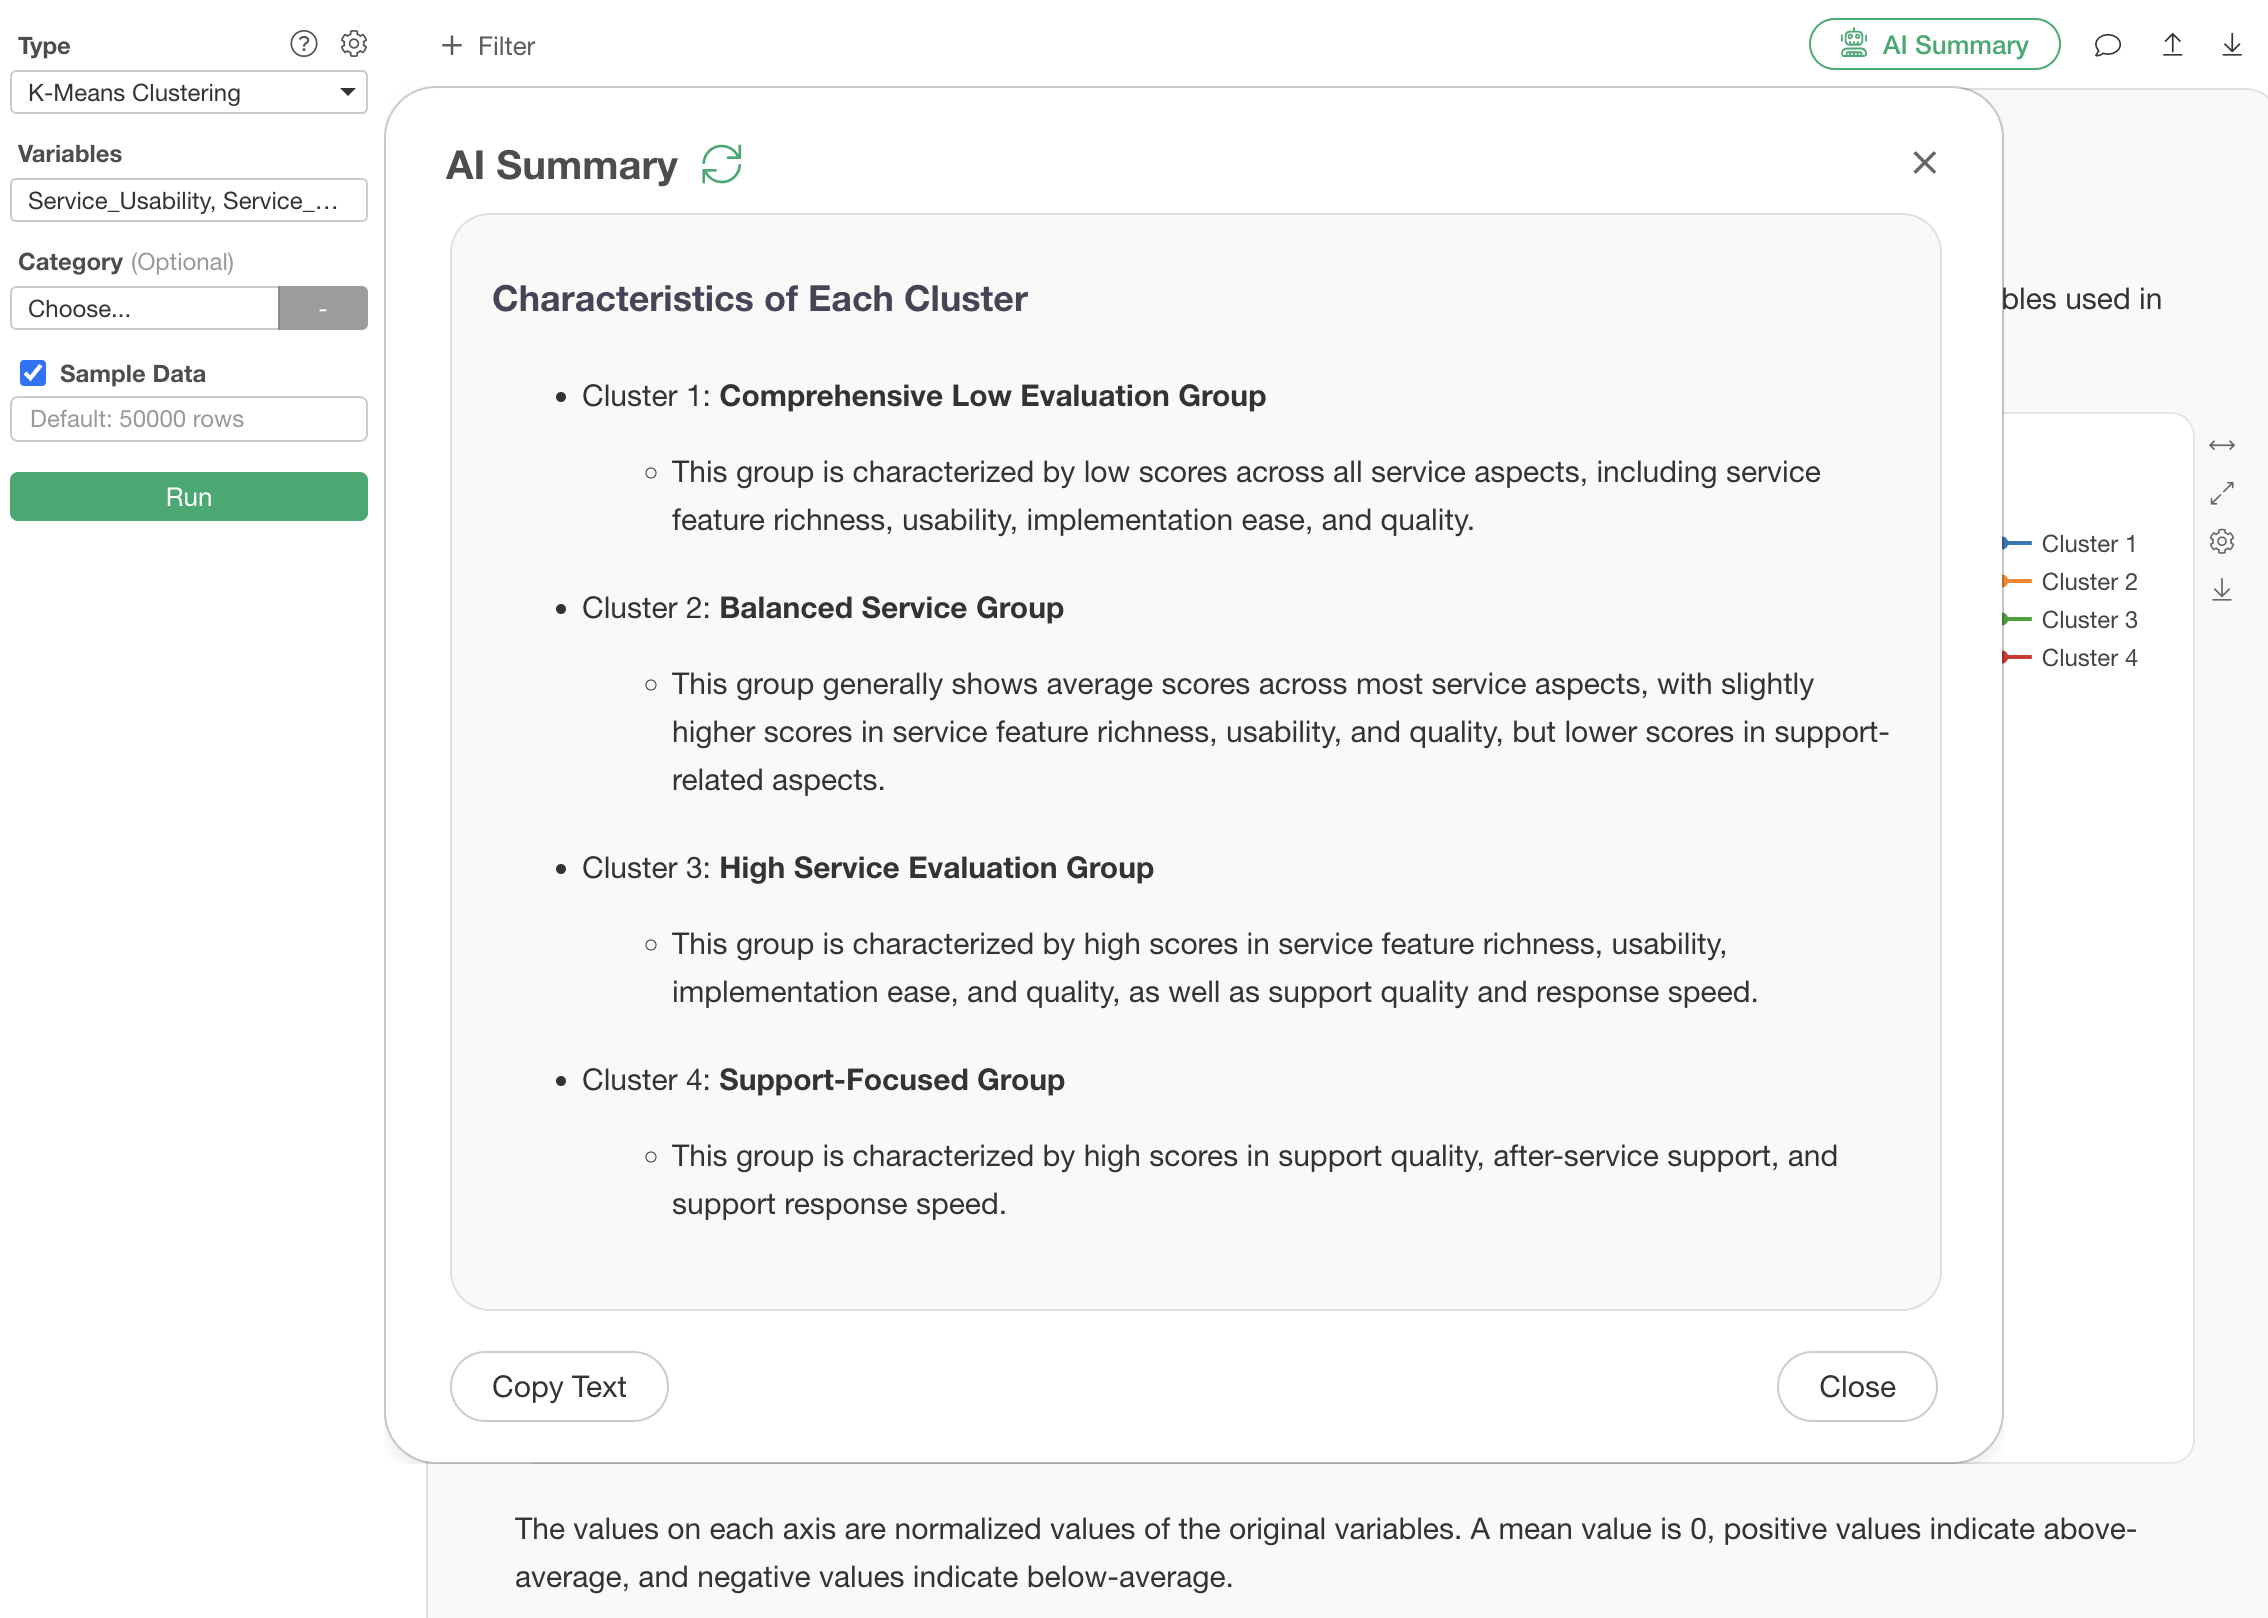
For this clustering, the AI summarizes that the groups are classified as follows:
Characteristics of Each Cluster
- Cluster 1: Price-sensitive group with low ratings
- Cluster 2: Balanced group
- Cluster 3: Highly-rated group
- Cluster 4: Support-focused group
By simply looking at this AI Summary, anyone can easily use K-Means Clustering because the AI determines and tells you what characteristics each divided group possesses.
AI Summary Results for Other Analytics
Below, we will introduce the AI Summary results for analytics other than “Text Analysis - Word Count” and “K-Means Clustering” that were introduced this time.
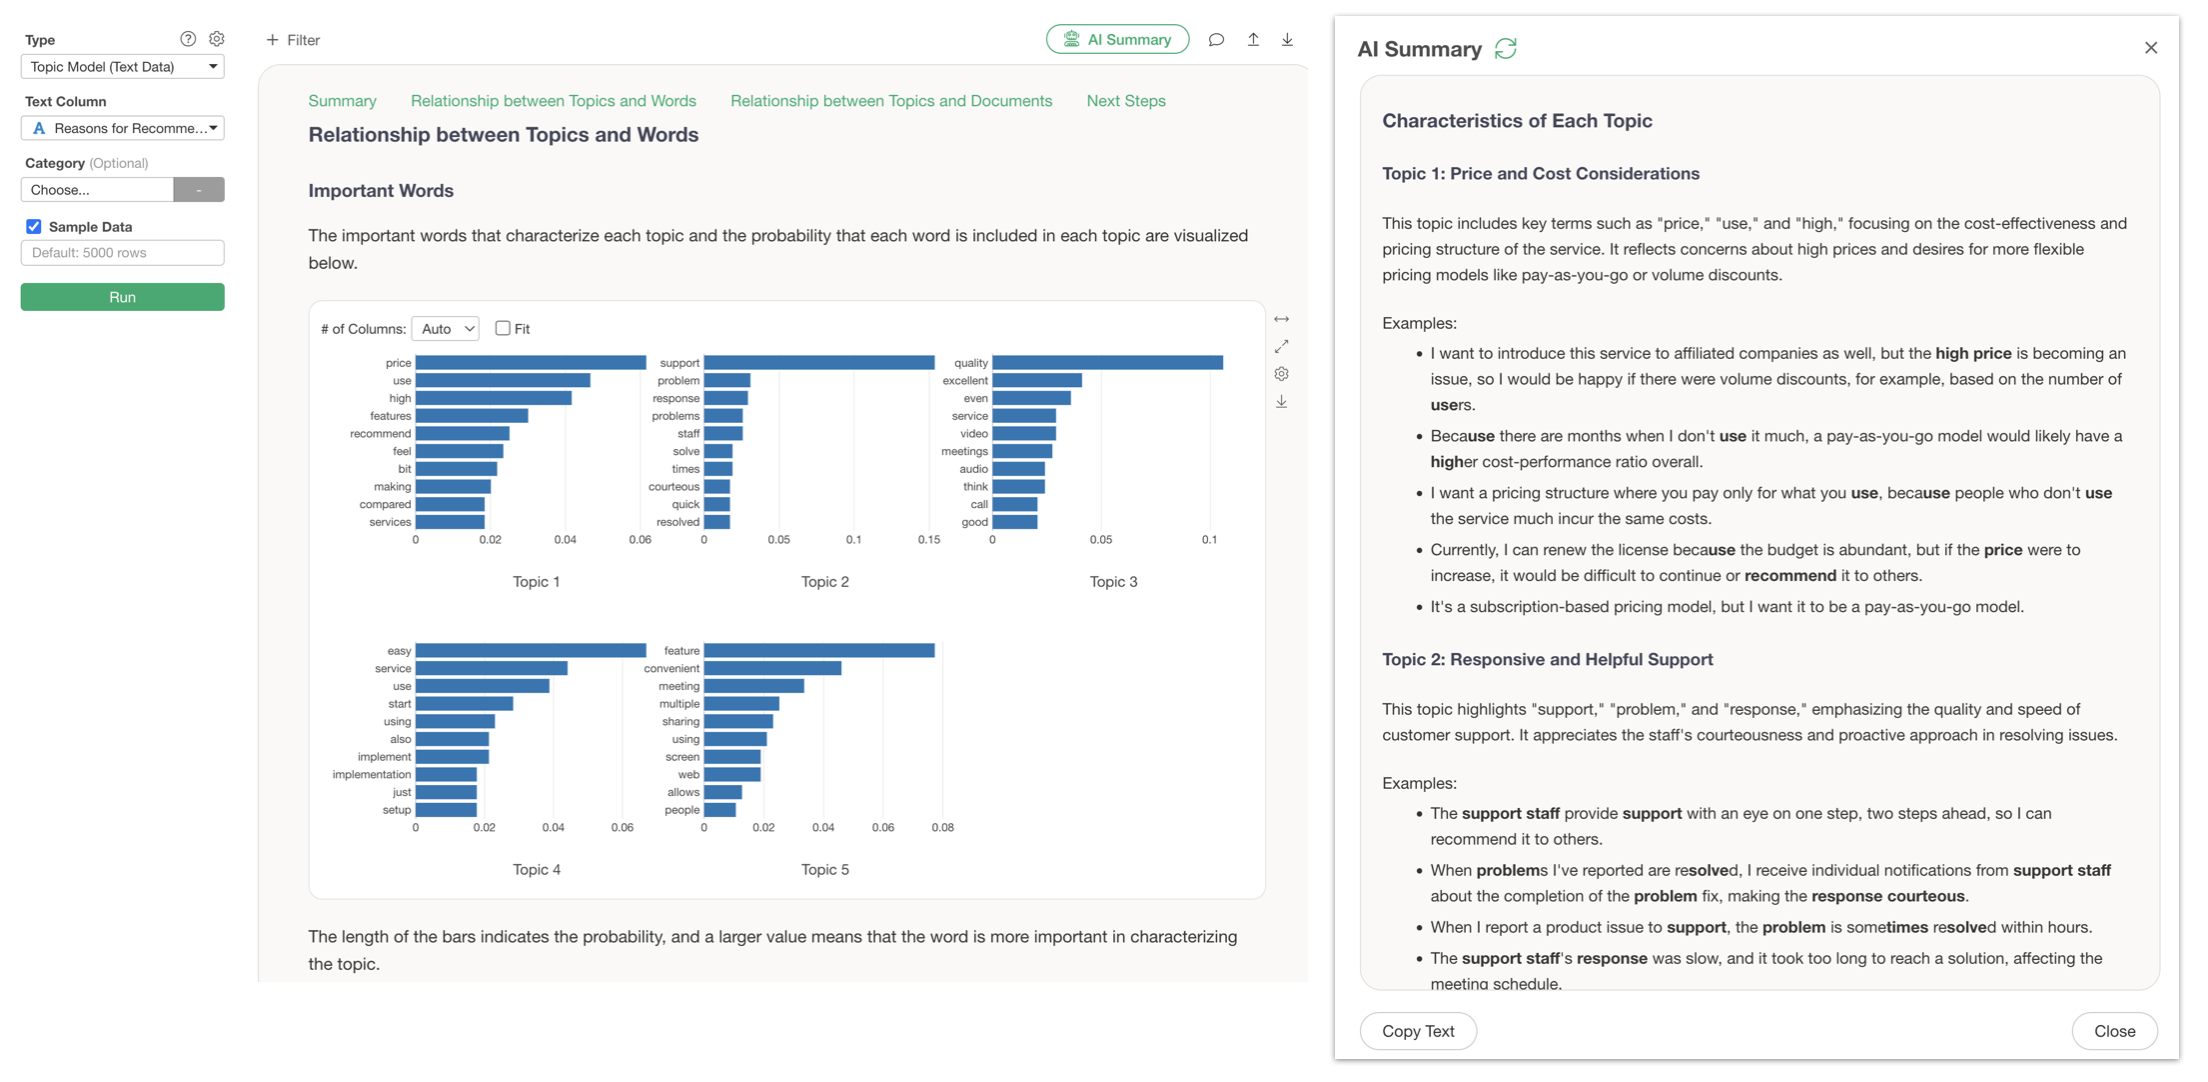
Topic Model
For Topic Models, it summarizes the characteristics of each topic and explains them along with actual sentences.
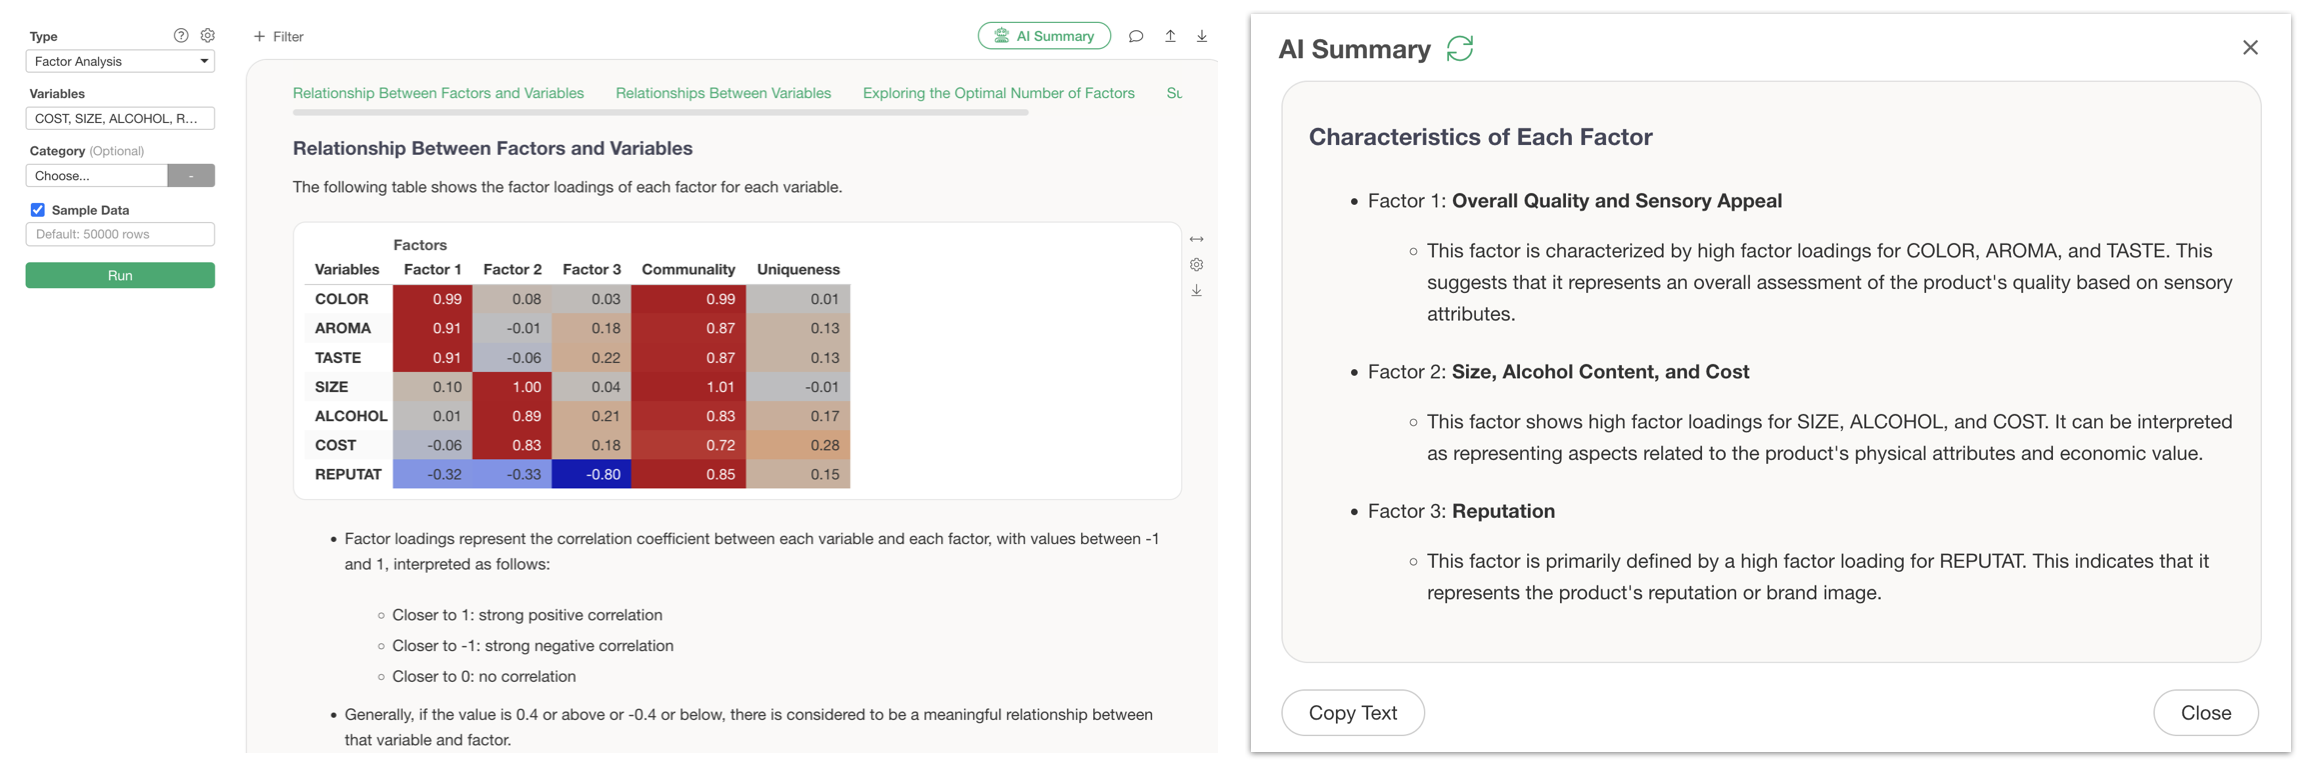
Factor Analysis
For Factor Analysis, it explains the characteristics of each factor based on factor loadings.
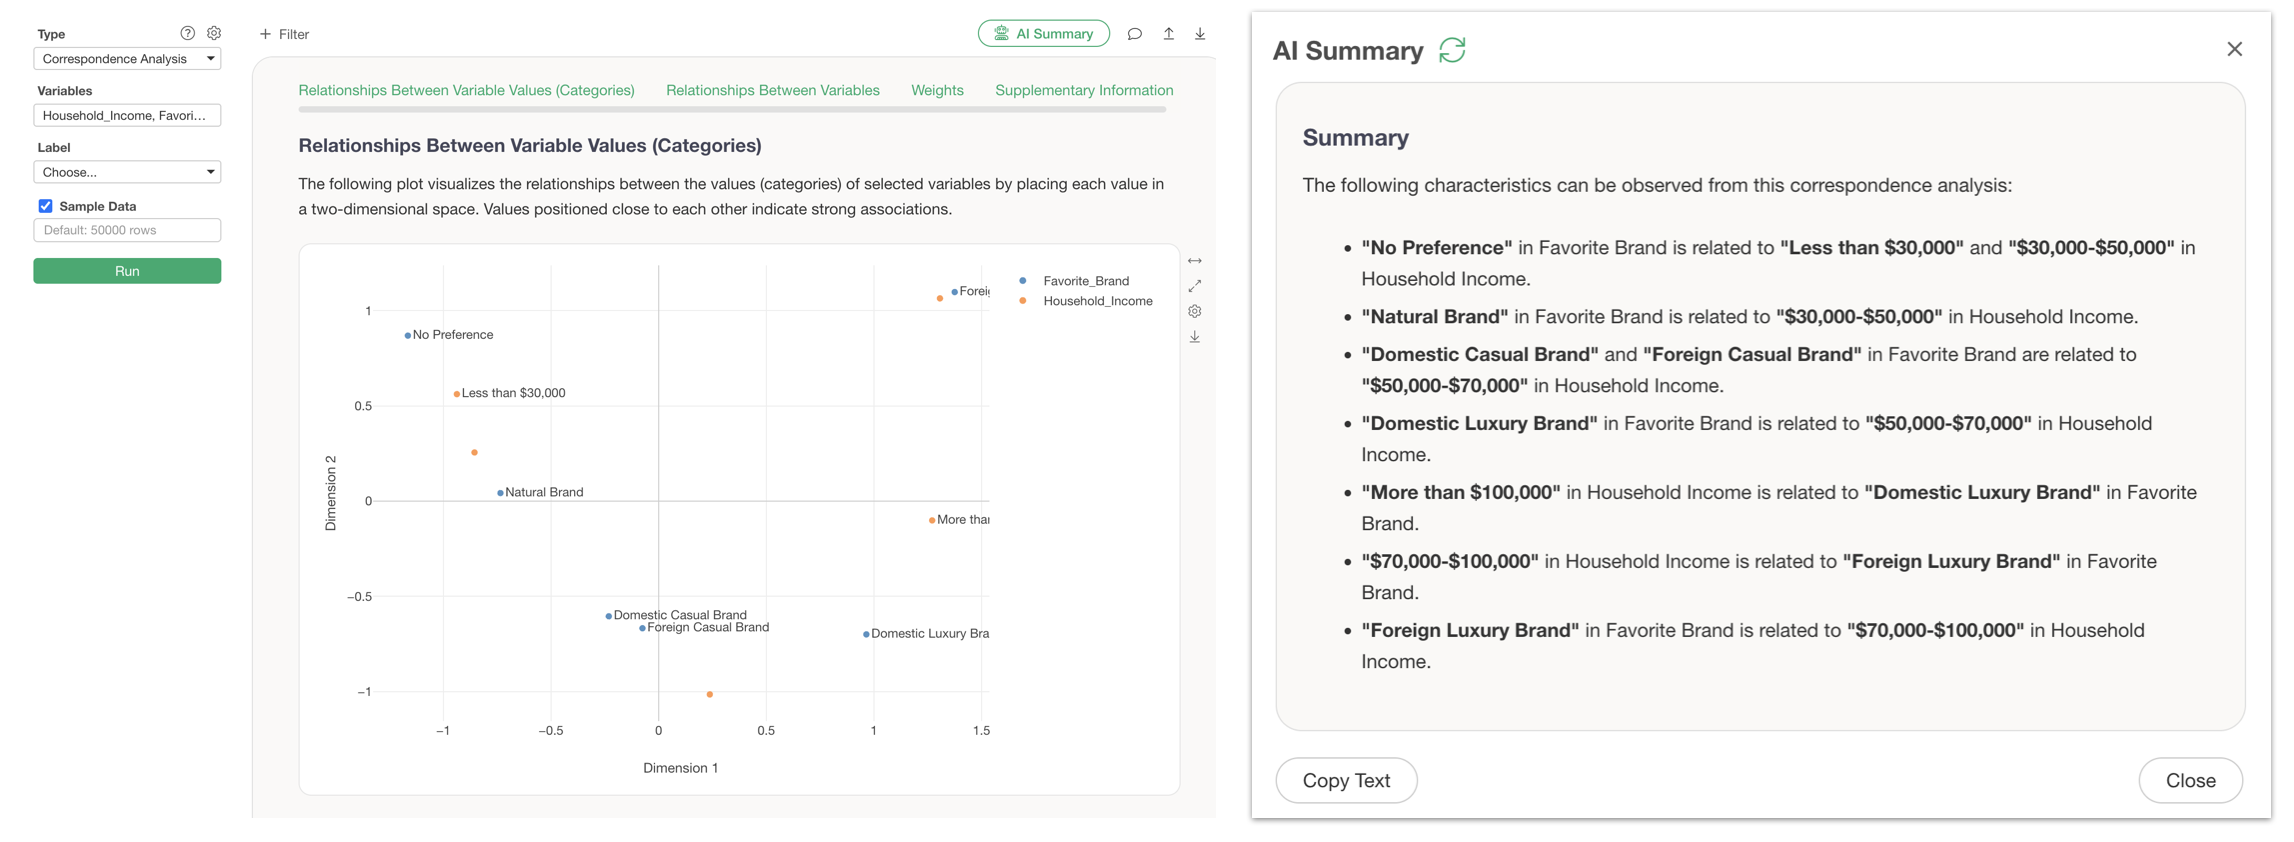
Correspondence Analysis
For Correspondence Analysis, it explains the relationships between variable values (categories) in text.
Summary
The AI Summary feature is a function that allows AI to explain complex analysis results in a way that anyone can understand.
Traditionally, even when results from K-Means Clustering, Factor Analysis, or Text Analysis were output, specialized skills were required, such as “learning how to read charts,” “interpreting results yourself,” and “labeling the characteristics of each group.”
With the AI Summary feature, all these tasks are performed by AI with just one button click.
You can quickly understand analysis results and utilize them for business decision-making without spending time deciphering charts or acquiring specialized knowledge when running analytics.
For those who are not confident in interpreting data analysis results or who want to gain insights without spending a lot of time on analysis, AI Summary will be a powerful partner.
Want to experience it now?
Please experience new features like AI Summary for yourself!
New Guided Analytics and AI Summary will surely support your data analysis.
If you haven’t used Exploratory yet, please try our 30-day free trial!