Survey Data Analysis: Trial Tour
Having conducted a survey, you might end up simply calculating the average of 5-point (or 10-point) scale responses. Or perhaps you read through free-text responses, experience momentary reactions, but fail to leverage these insights for business improvement.
However, survey data is actually a treasure trove of analysis that can provide insights leading to concrete actions for improving your business or service when various analytical methods are utilized.
This trial tour allows you to experience recommended operations and features for survey data analysis.
Please bookmark this page and try Exploratory!
Installing Exploratory
If you haven’t installed Exploratory yet, please refer to the installation guide below:
- Installation Guide - Link
If you have trouble with installation, please email support@exploratory.io or contact us through the chat window on our website.
4 Steps
1. Correlation (Estimated time: 20 minutes)
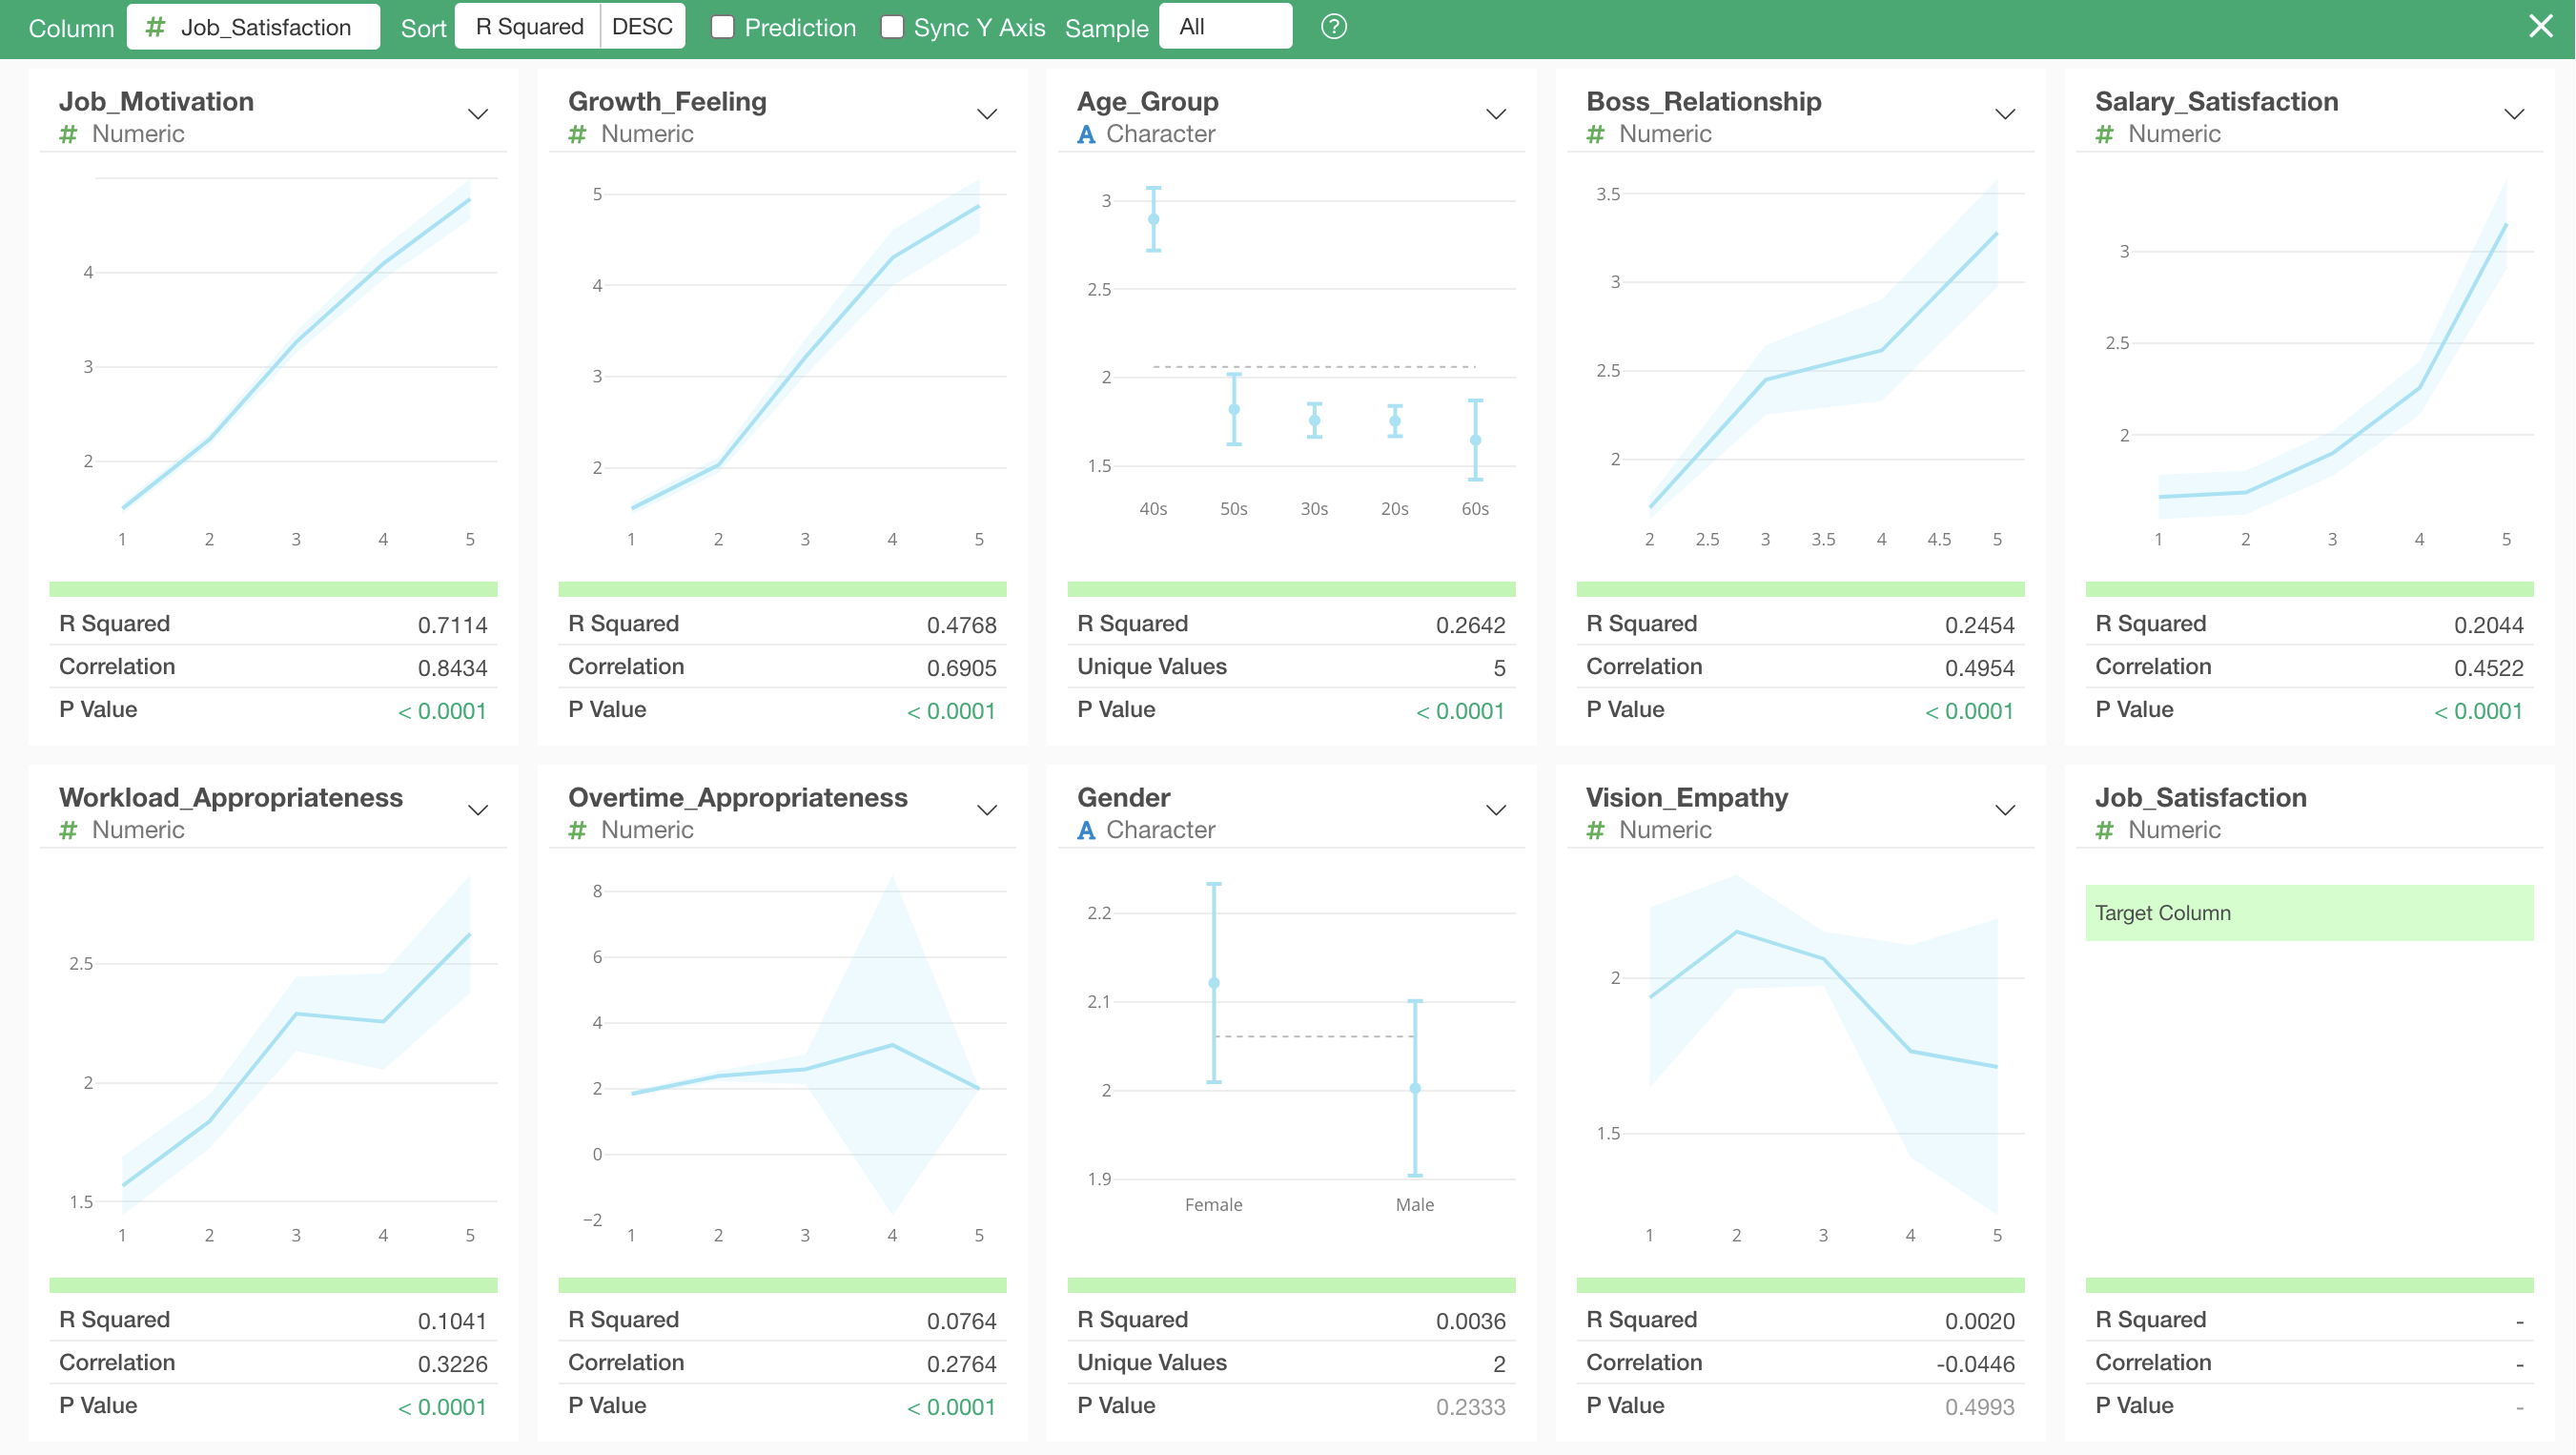
For example, when conducting a survey about employee job satisfaction, you’ll likely ask various questions related to job satisfaction beyond just the direct question.
In such cases, identifying questions that have a strong correlation (when one increases, the other changes) with “job satisfaction” can help you start thinking about actions to improve job satisfaction.
You’ll experience the “Correlation Mode” which allows you to identify questions strongly correlated with job satisfaction in just a few clicks using employee job satisfaction survey response data.
- Correlation - Link
2. Text Analysis (Estimated time: 20 minutes)
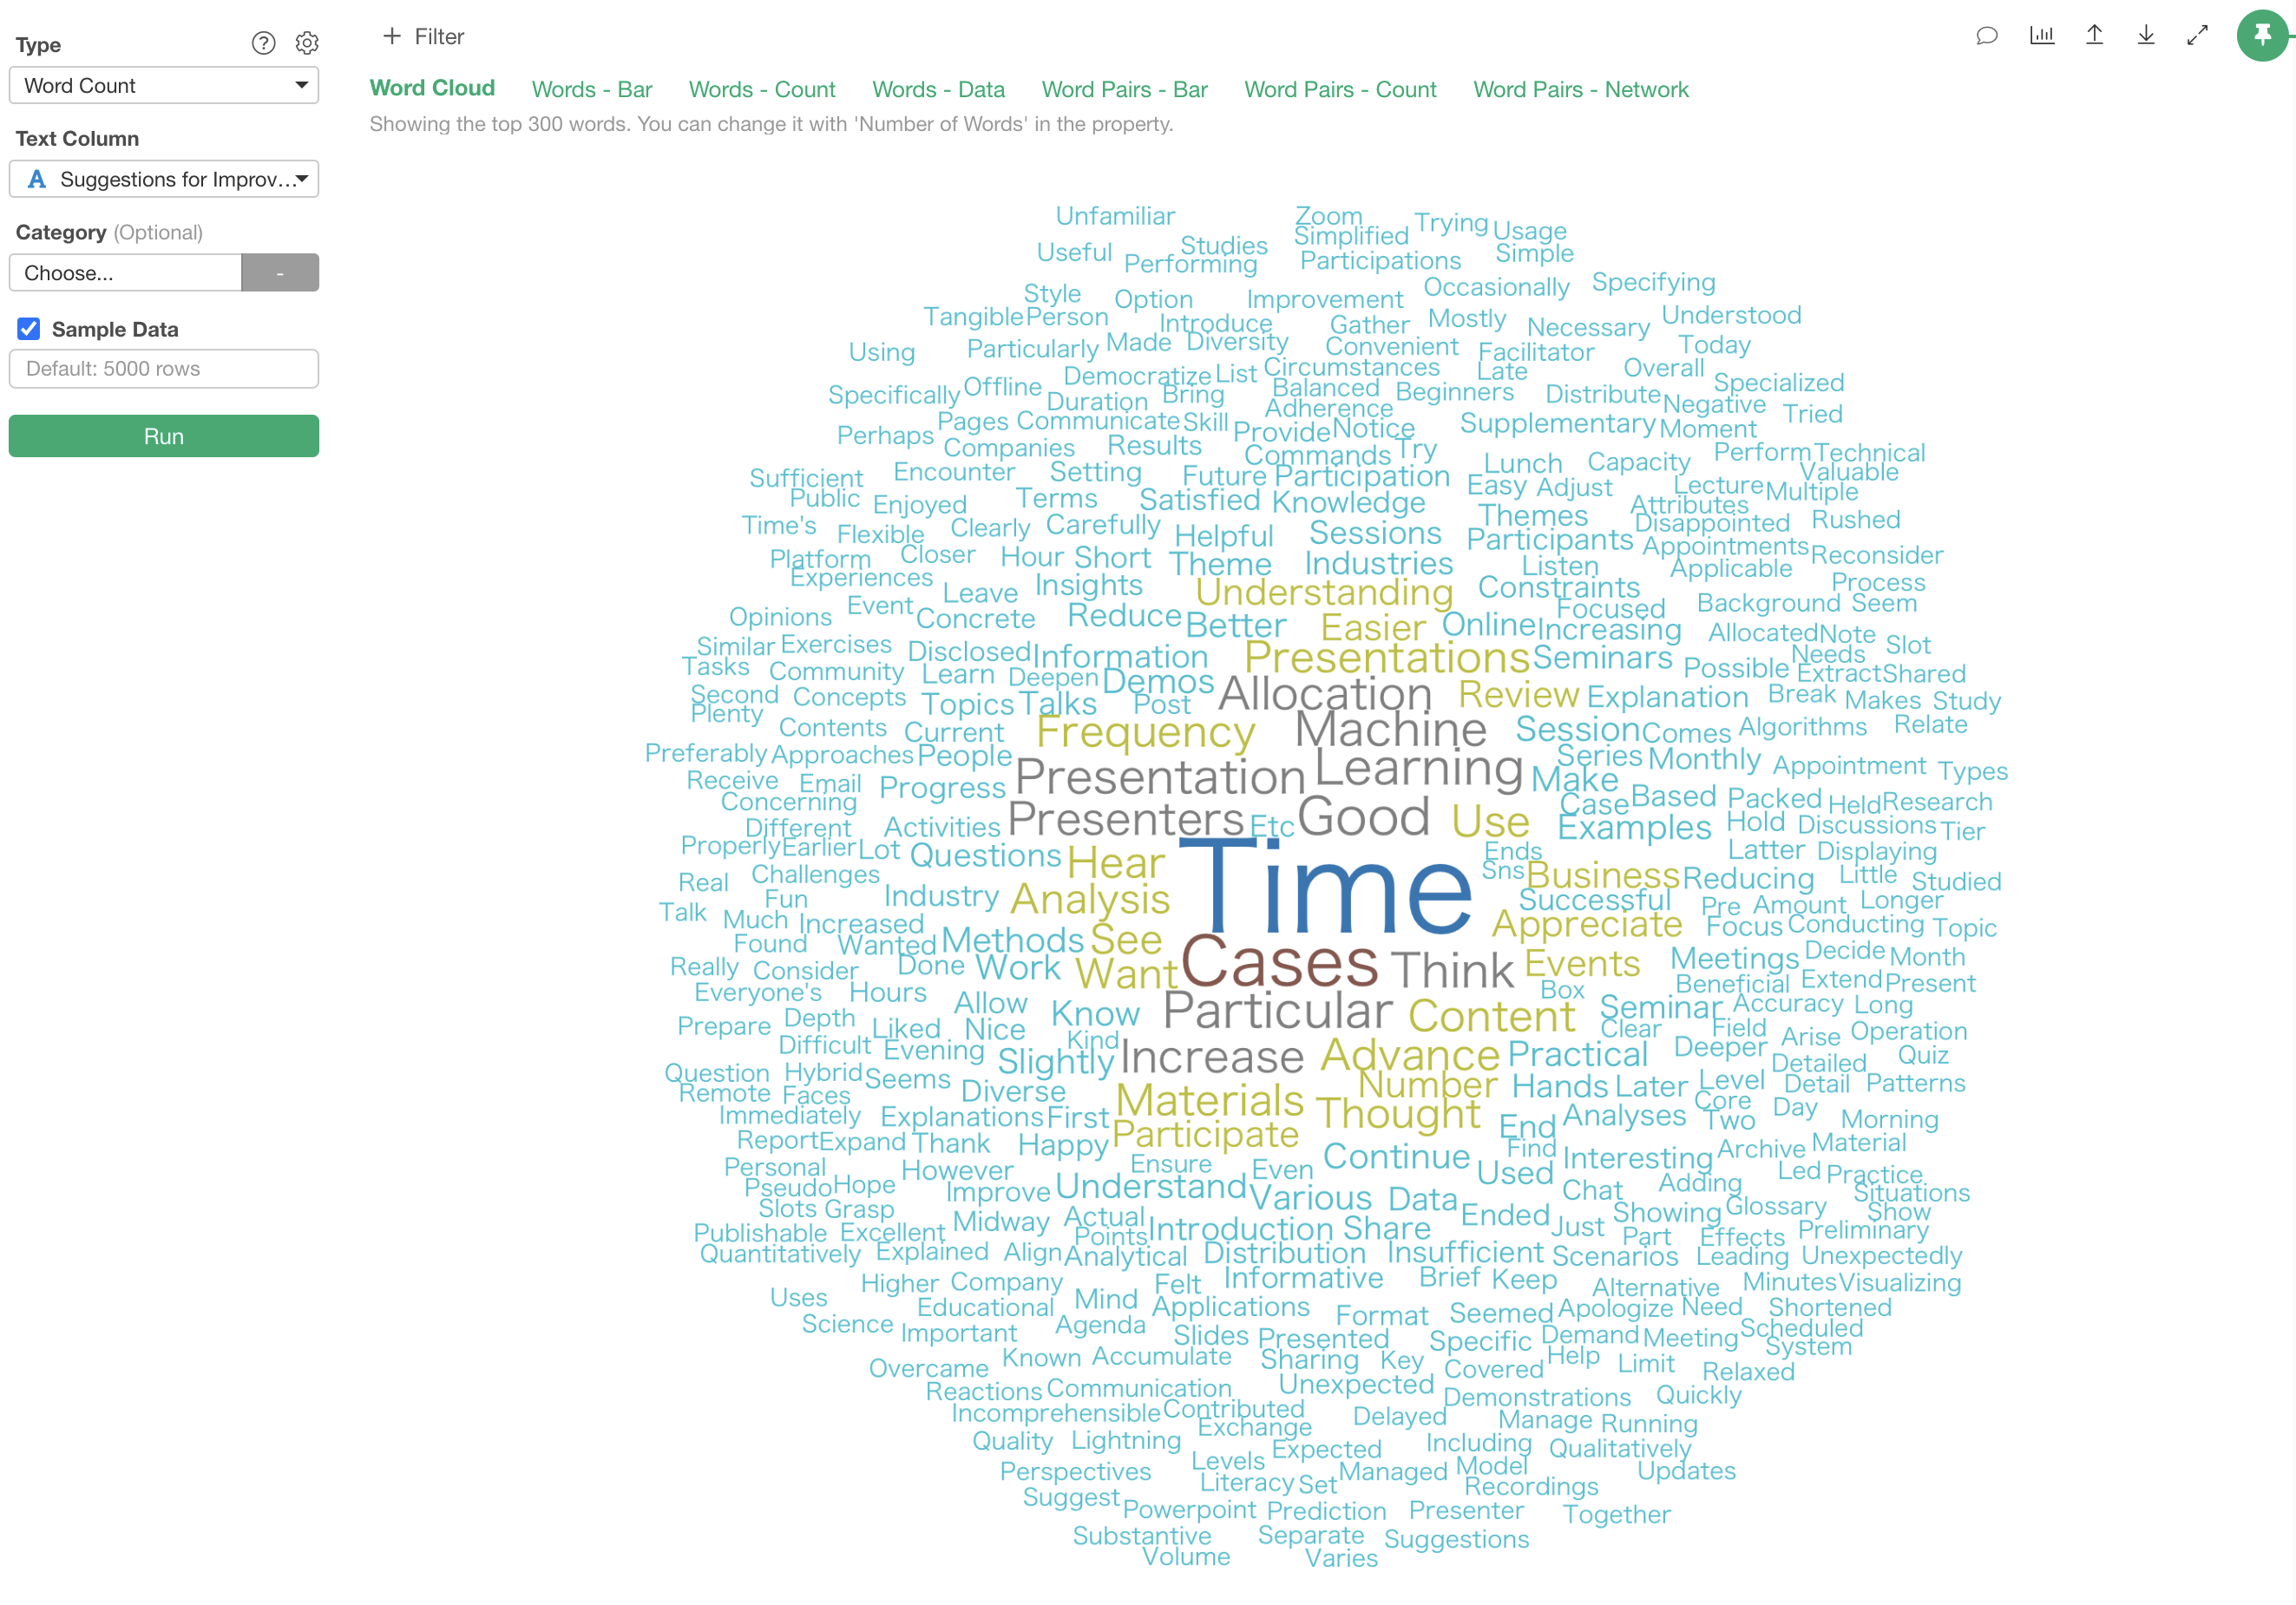
Including “free-text” questions in surveys is common, but free-text data can be difficult to quantify, leading to varying interpretations and challenges in objectively capturing overall characteristics and trends.
However, by breaking text into “words” and tallying the frequency of each word (quantification), you can identify patterns and characteristics within the data.
You’ll experience methods for analyzing free-text survey data to discover “which words are commonly used” or “what characteristics exist among words used together.”
- Text Analysis - Link
3. Factor Analysis (Estimated time: 20 minutes)
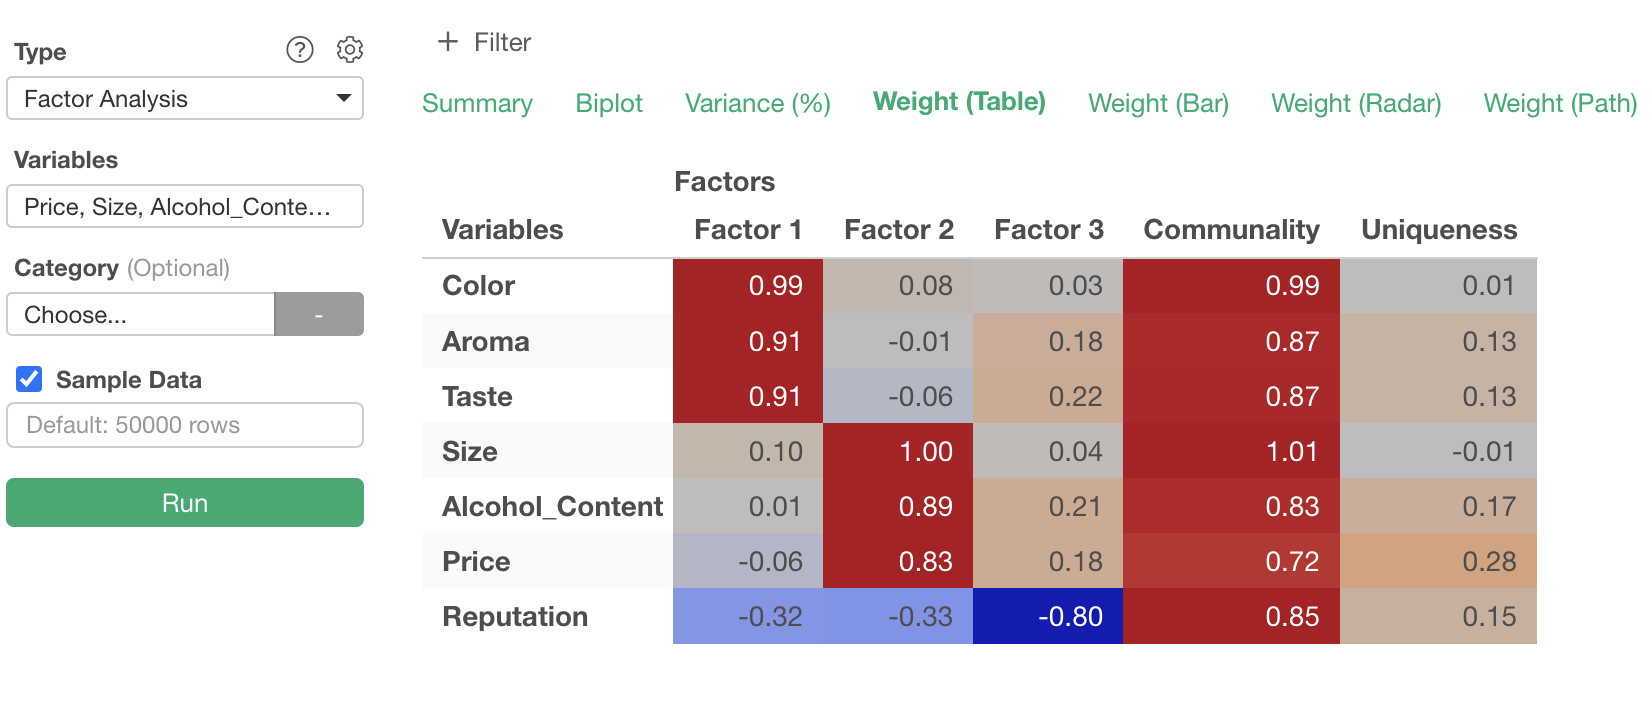
For example, when conducting a survey about “what people want from beer,” it’s common to ask questions about individual elements like “Color” and “Taste.”
When analyzing such data, rather than focusing on responses to individual questions, you might want to look at the survey responses as a whole to explore the underlying motivations behind those responses.
In the beer example, understanding that respondents prioritize “Price” or “Taste” can inform product development or help with targeting and communication in marketing activities.
You’ll experience using “Factor Analysis” to explore hidden consumer motivations using survey data about “what people want from beer.”
- Factor Analysis - Link
4. Response Aggregation (Estimated time: 10 minutes)
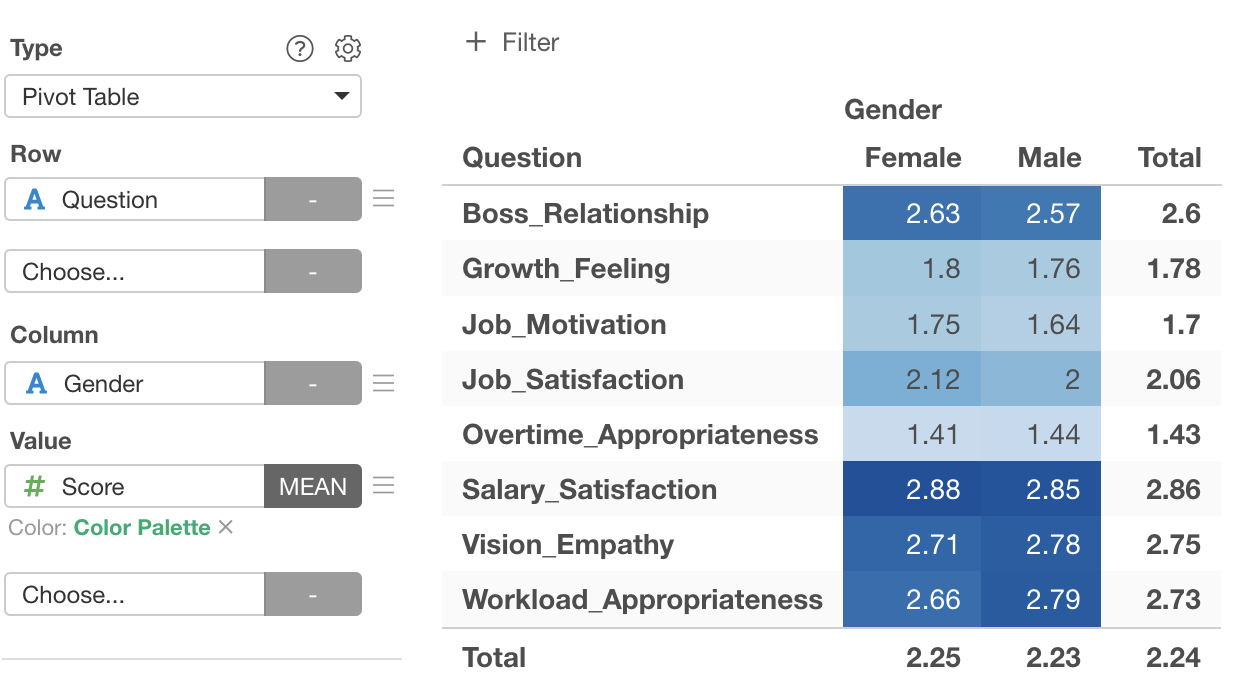
When conducting surveys with 5-point or 10-point scale questions, it’s common to calculate average scores for each question or compare scores across different groups.
However, survey response data often comes in a “wide format” where data expands horizontally as questions increase, which is not ideal for aggregation and visualization.
Converting “wide format” data to “long format” enables easier and more flexible aggregation and visualization.
You’ll experience how to convert wide format data to long format and aggregate response scores using employee survey data.
- Response Aggregation - Link
Consult with Exploratory Staff
We also offer free online consultation opportunities with specialized staff.
- Learn how to proceed with trials and utilize the service for your company
- Discuss whether Exploratory is the optimal service for your company
- Get advice on solving data analysis challenges
We’ll answer these and other questions related to data utilization. If you’re interested, please feel free to contact us before or during the tour.