Calculating Marketing Metrics (KPIs) Using AI Prompts
To measure the effectiveness of marketing activities, it’s necessary to monitor appropriate metrics. Some business metrics specific to marketing include:
- Brand awareness rate
- Number of trials
- Conversion rate
- CPA (Cost per Acquisition)
- Number of referrals
- NPS (Net Promoter Score)
However, calculating these metrics or creating charts to monitor them can be quite challenging. This is often because various data processing and calculations are required.
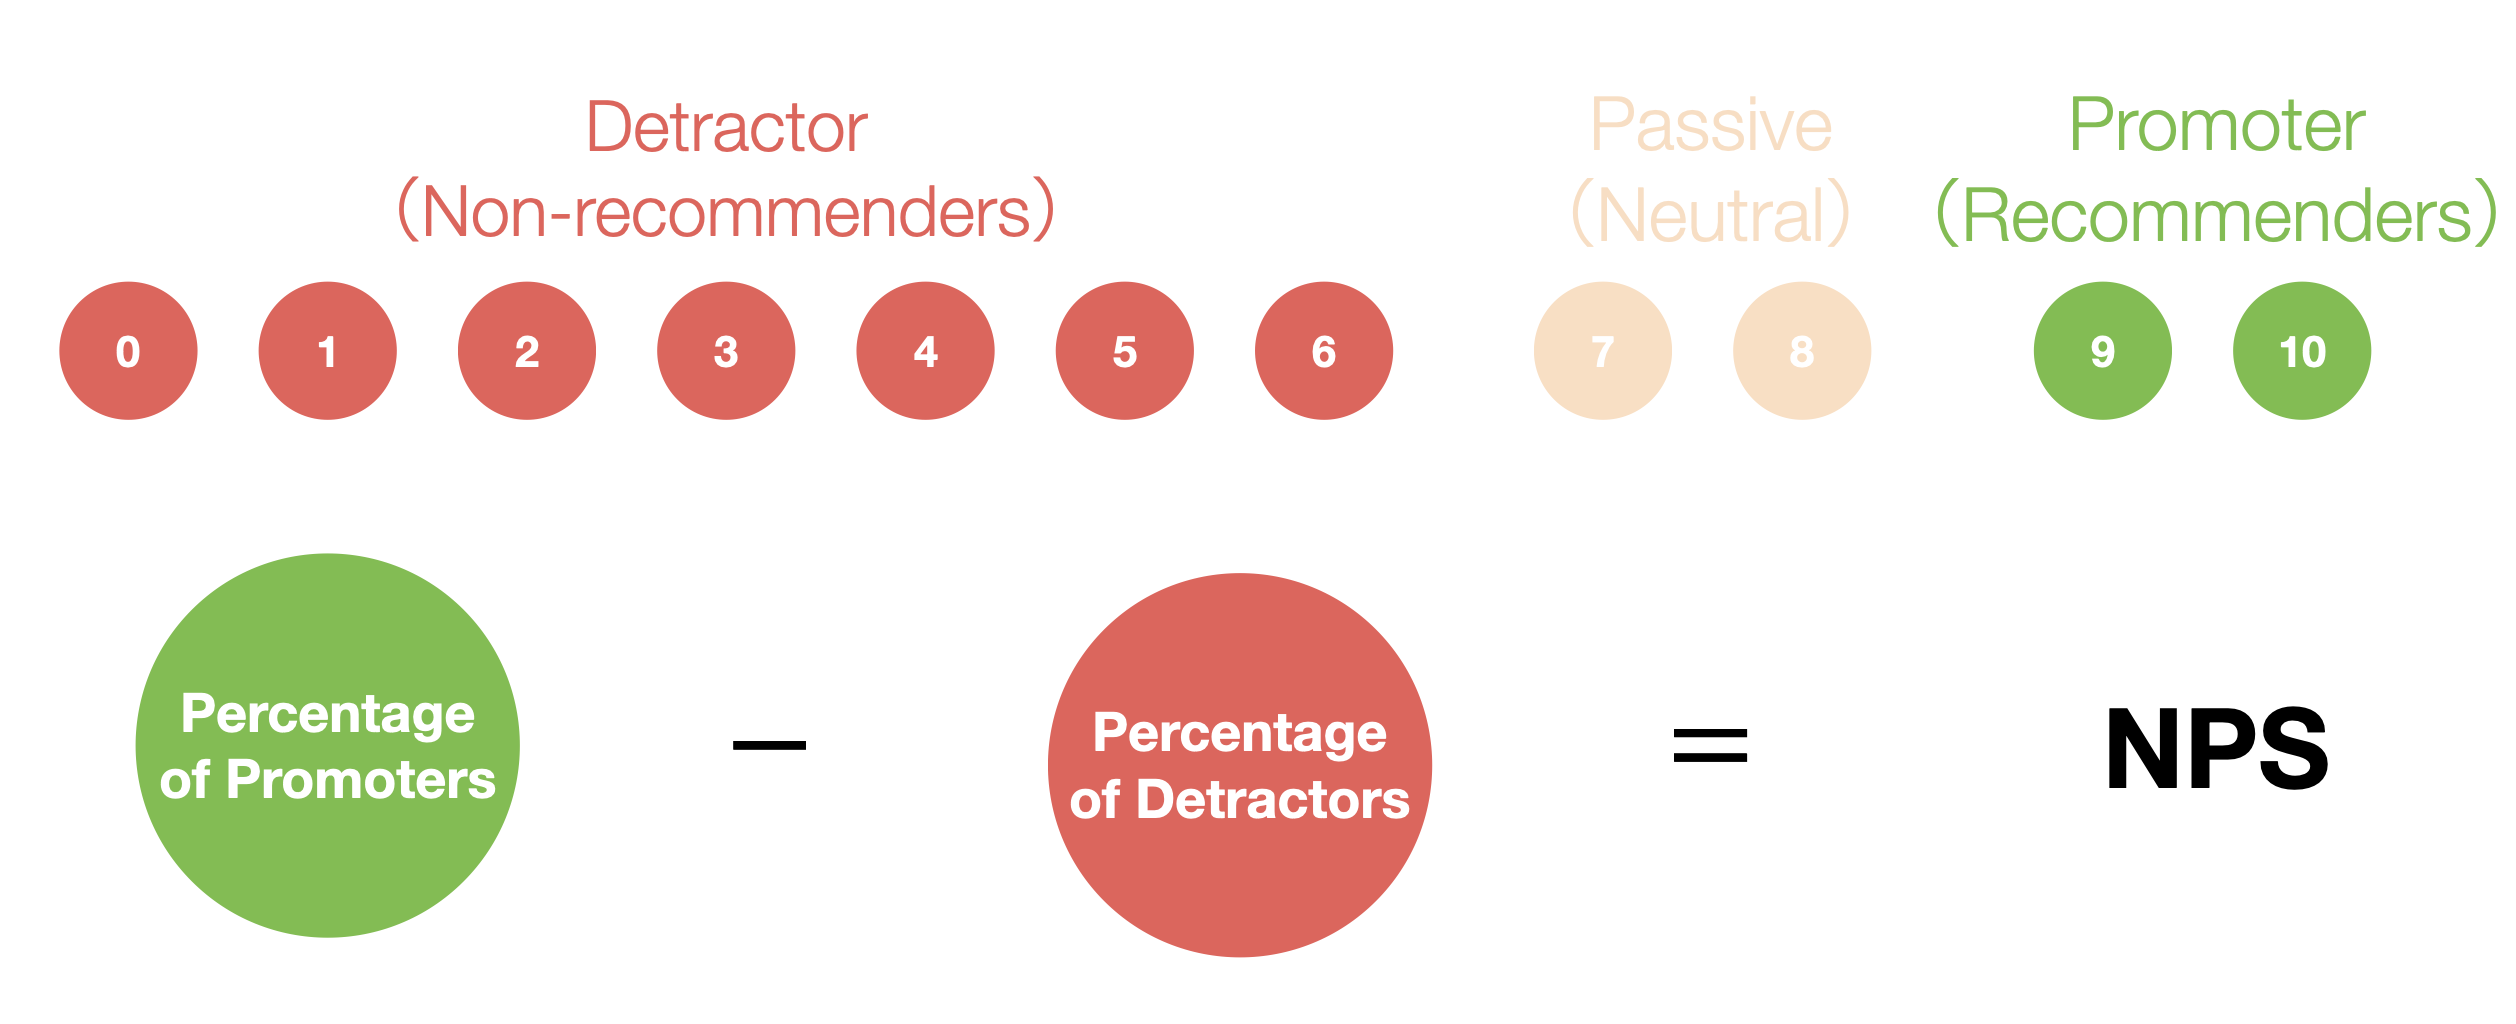
For example, let’s focus on the NPS (Net Promoter Score), which is a measure of customer loyalty and can be a leading indicator of word-of-mouth spread.
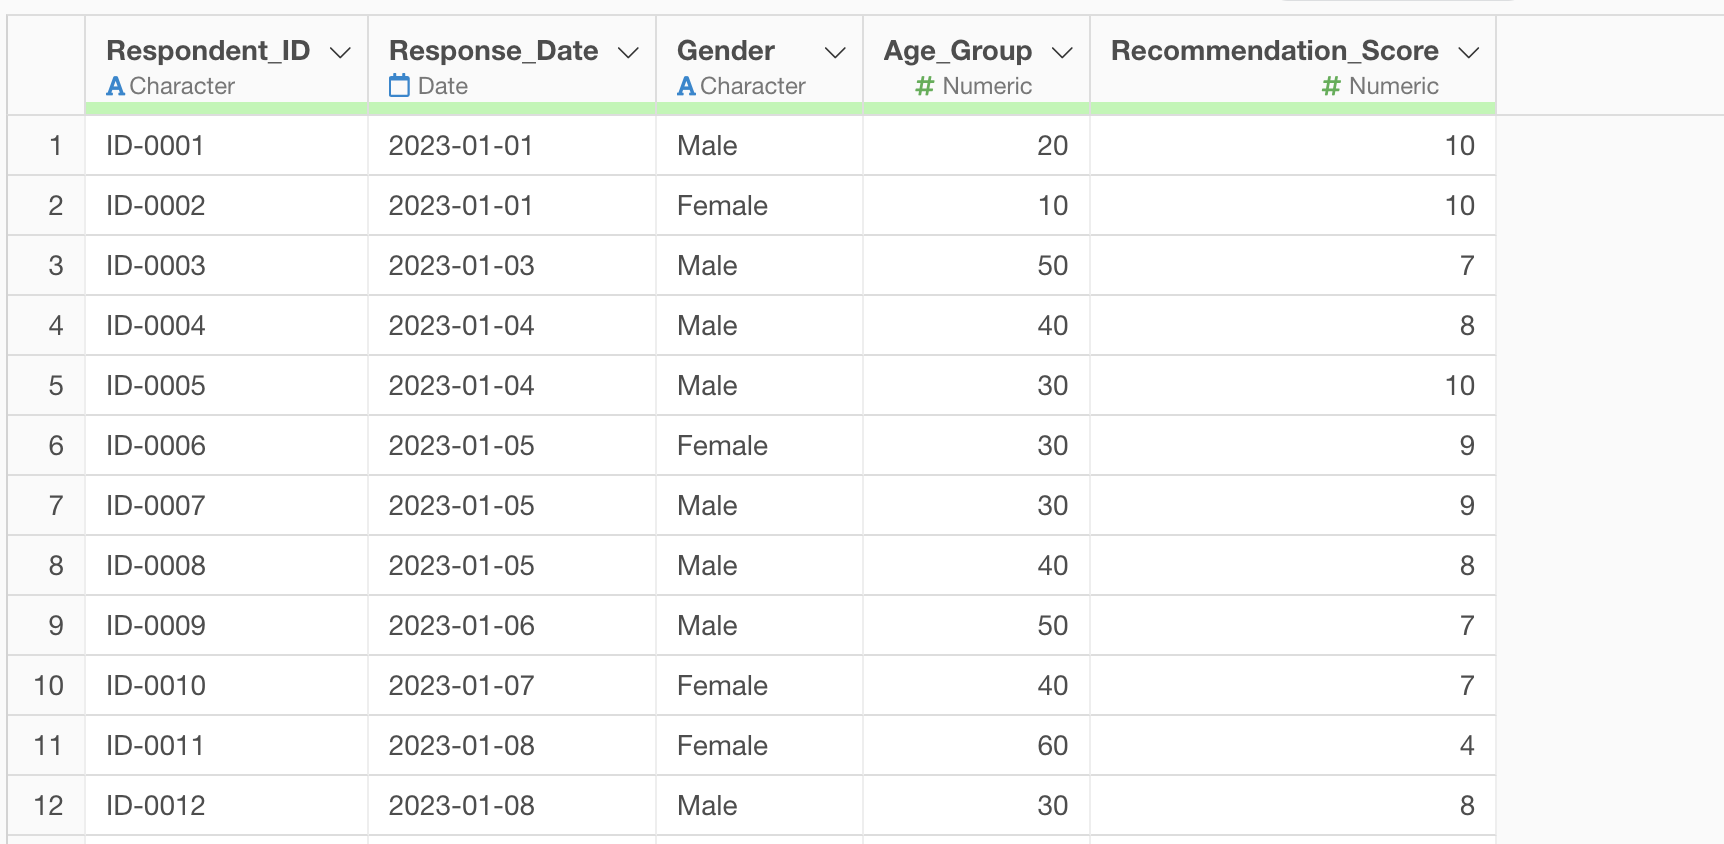
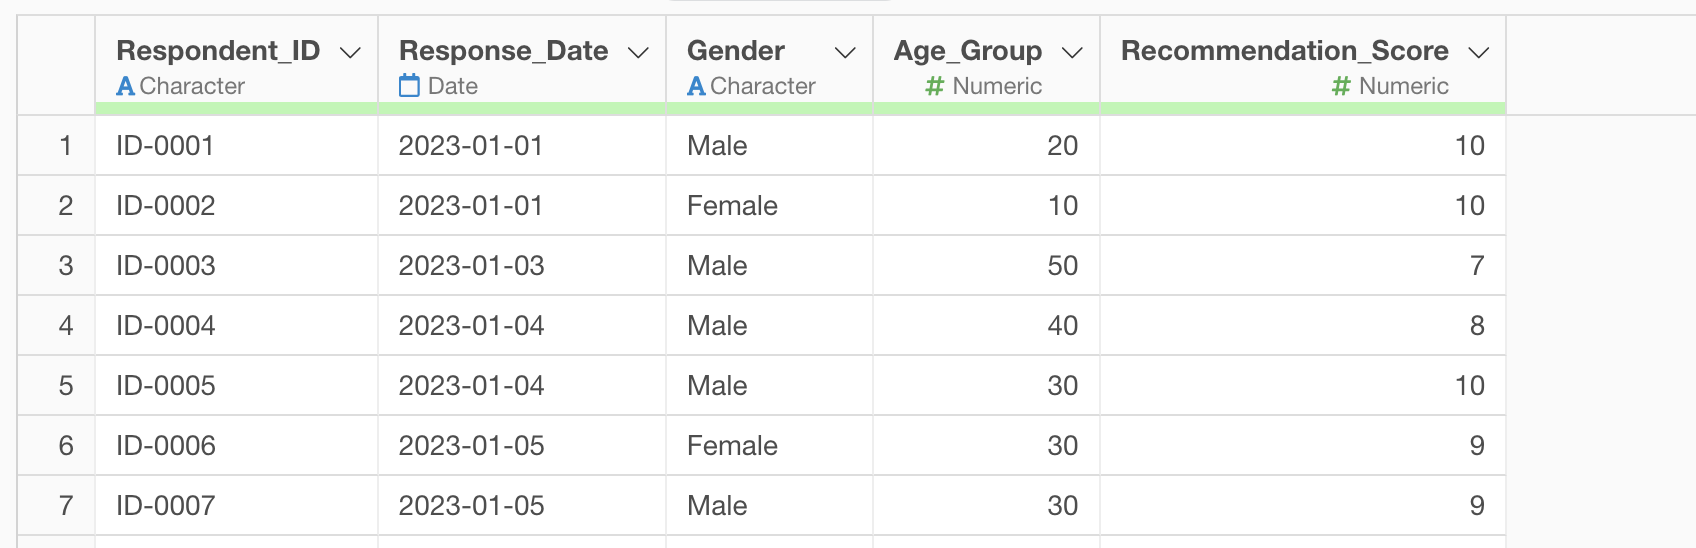
If you have NPS survey data where each row represents one respondent, as shown below, you need to use this data to calculate the NPS.
This calculation typically involves the following steps:
- Classify respondents as Promoters (9-10), Passives (7-8), or Detractors (0-6) based on the “recommendation” score (0-10)
- Calculate the percentage of Promoters and Detractors
- Calculate the NPS by subtracting the percentage of Detractors from the percentage of Promoters
As a result, many people give up midway and are unable to monitor such metrics.
Calculating Marketing Metrics Using AI Prompts
Here’s some Good News!
Since Exploratory v12, data wrangling (processing, formatting) can be done quickly and easily through the AI prompt interface.
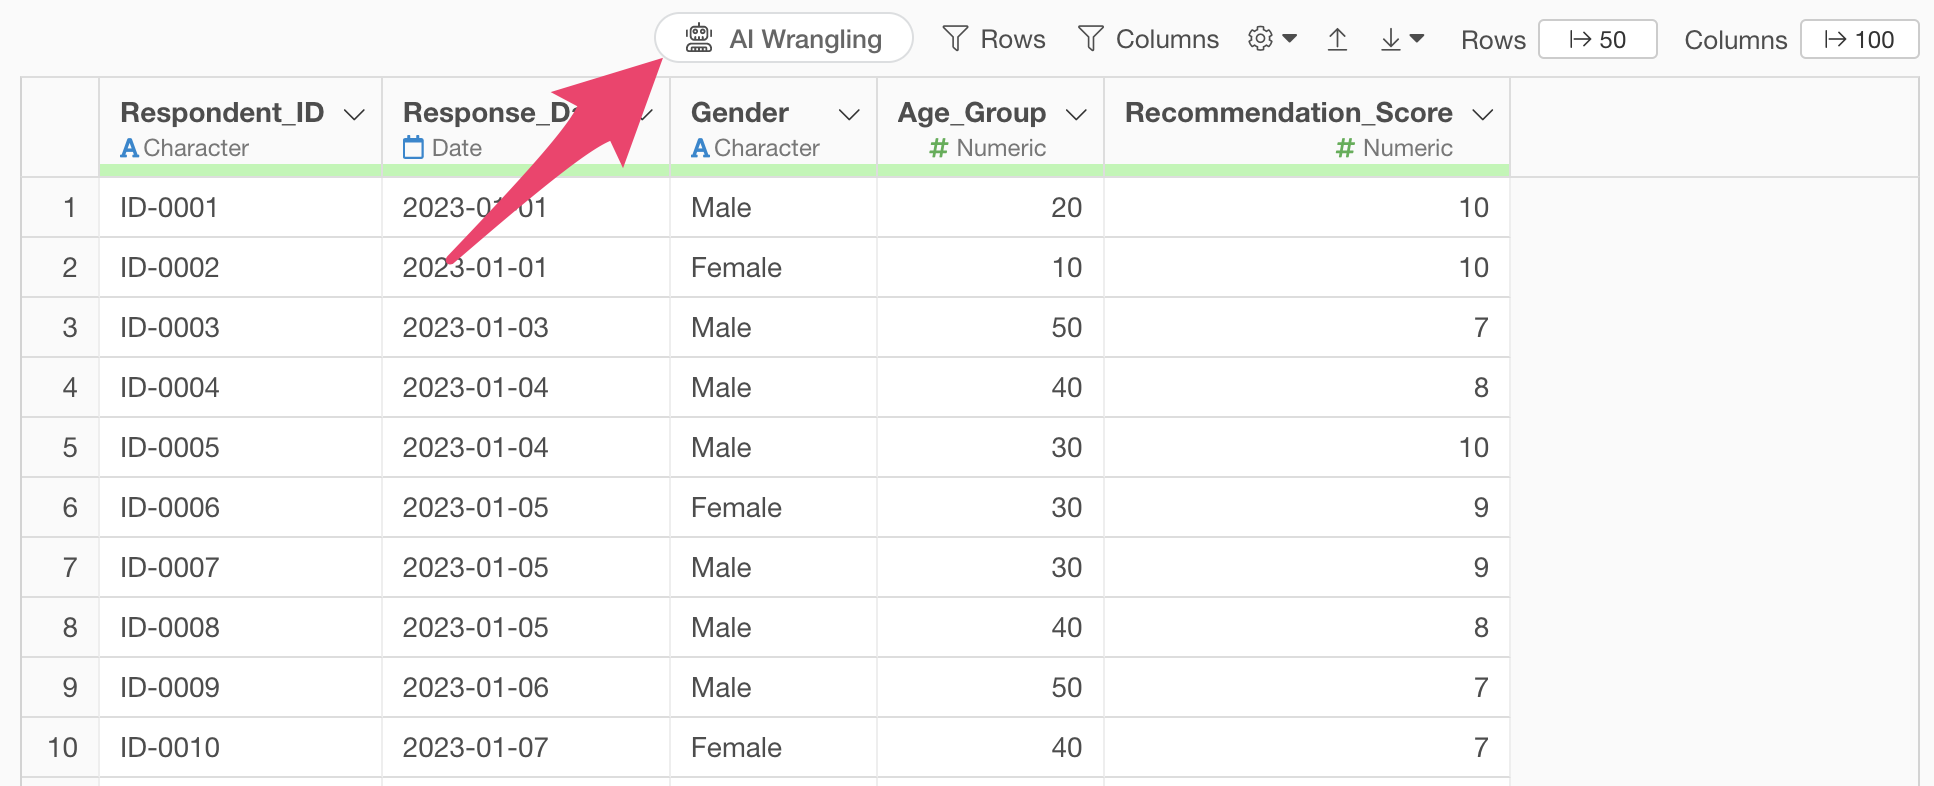
By simply clicking the “AI Wrangling” button and entering instructions for data wrangling in the prompt window that appears, you can automatically generate R code to create the expected data.
This data wrangling feature using AI prompts is not limited to general data processing. Surprisingly, it can quickly and easily create marketing metrics as well.
From here, we’ll introduce methods for calculating marketing metrics using AI prompts, divided into three patterns.
1. Creating NPS
The first pattern involves entering the name of the metric you want to calculate into the prompt window, which then generates a multi-step script to calculate the metric all at once.
Here, we’ll introduce the way to create NPS with the AI Prompt. The sample data used this time can be downloaded from here.
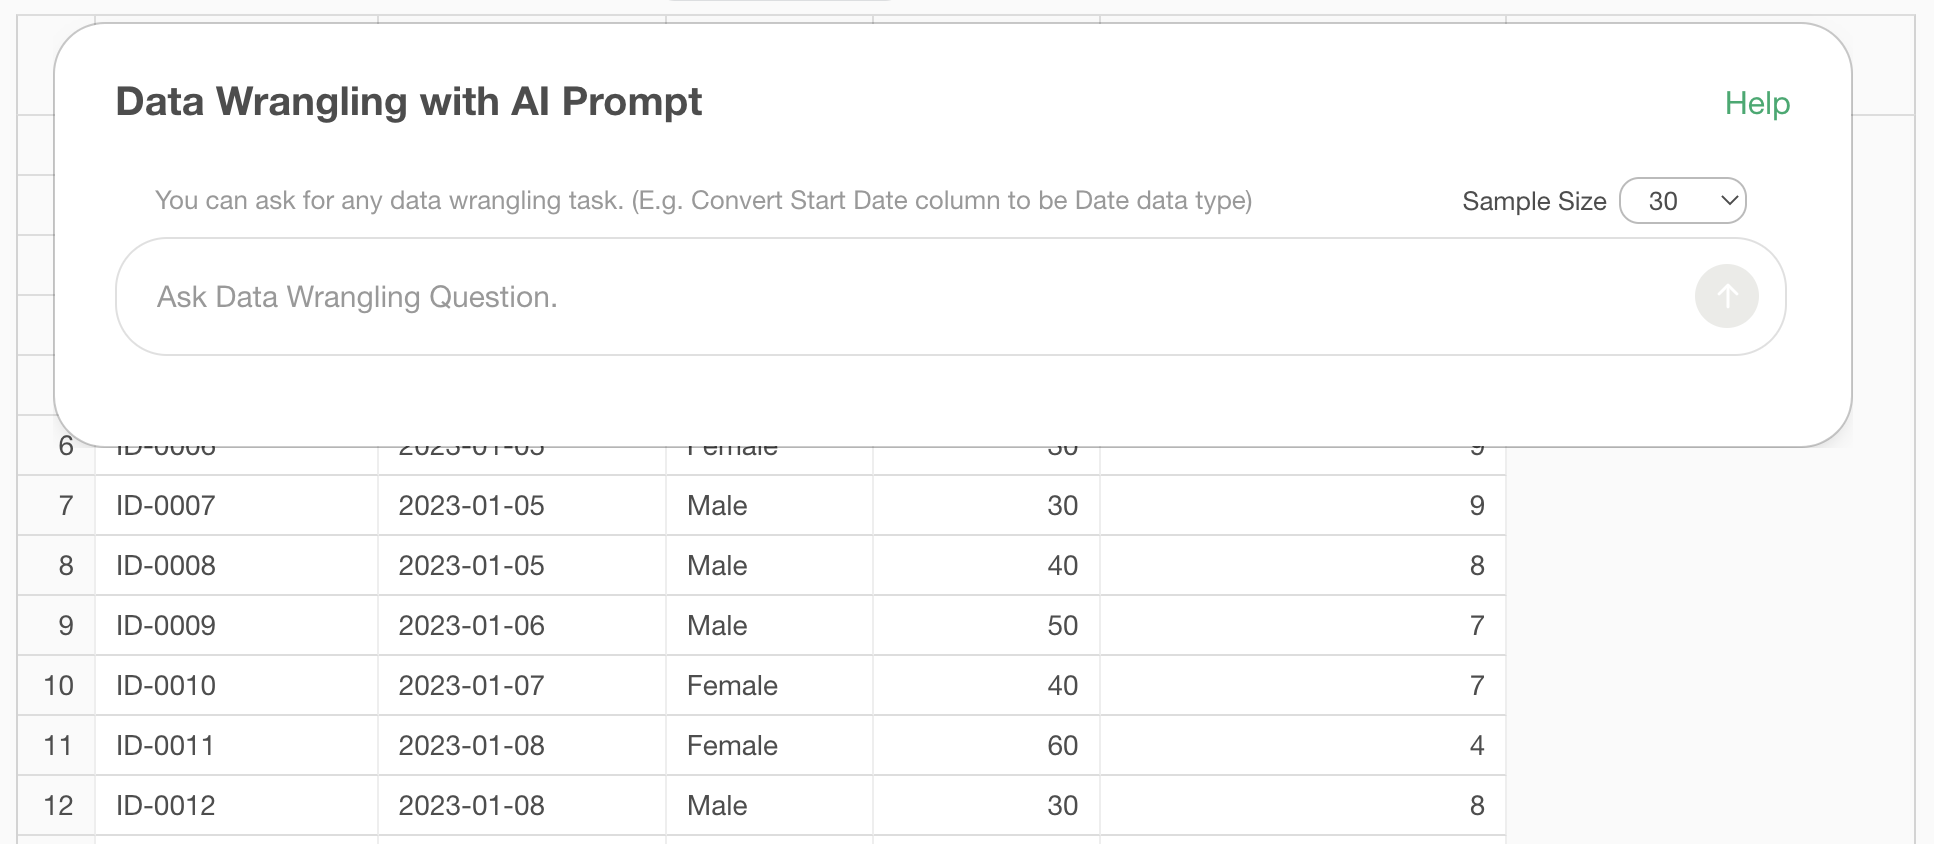
After displaying the prompt window, enter the following text in the window and execute as follows.
Calculate NPS by month
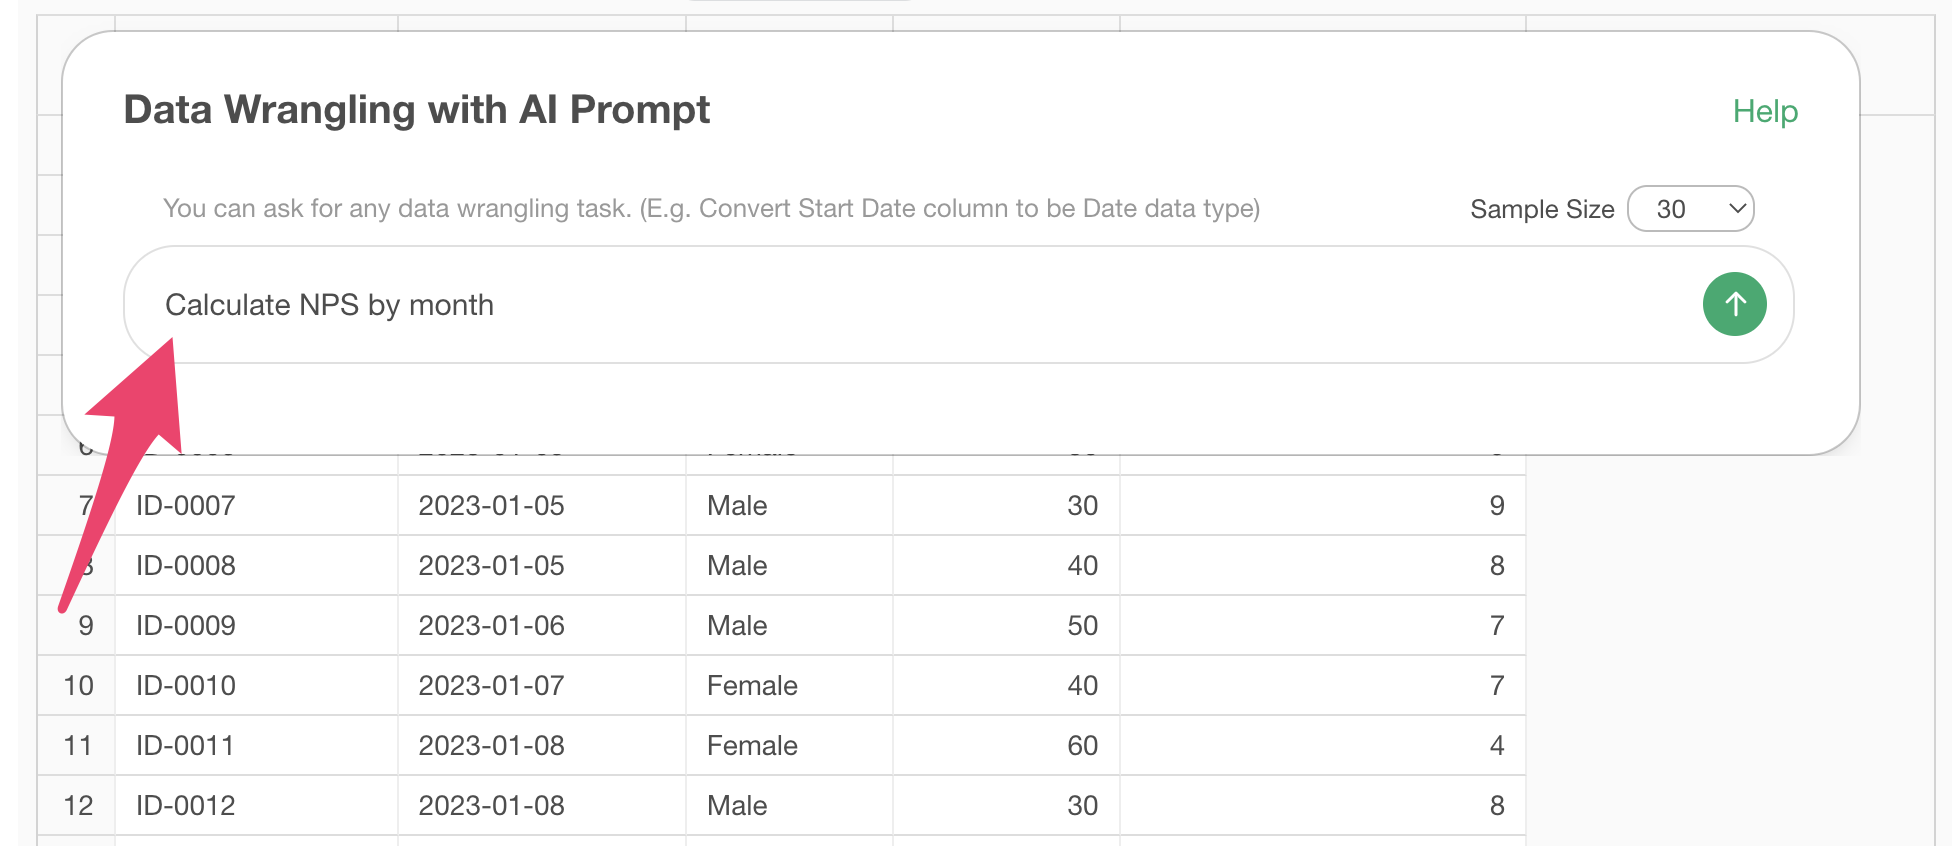
This will generate the R code needed to fulfill your input request. All you need to do is press the “Run as Step” button.
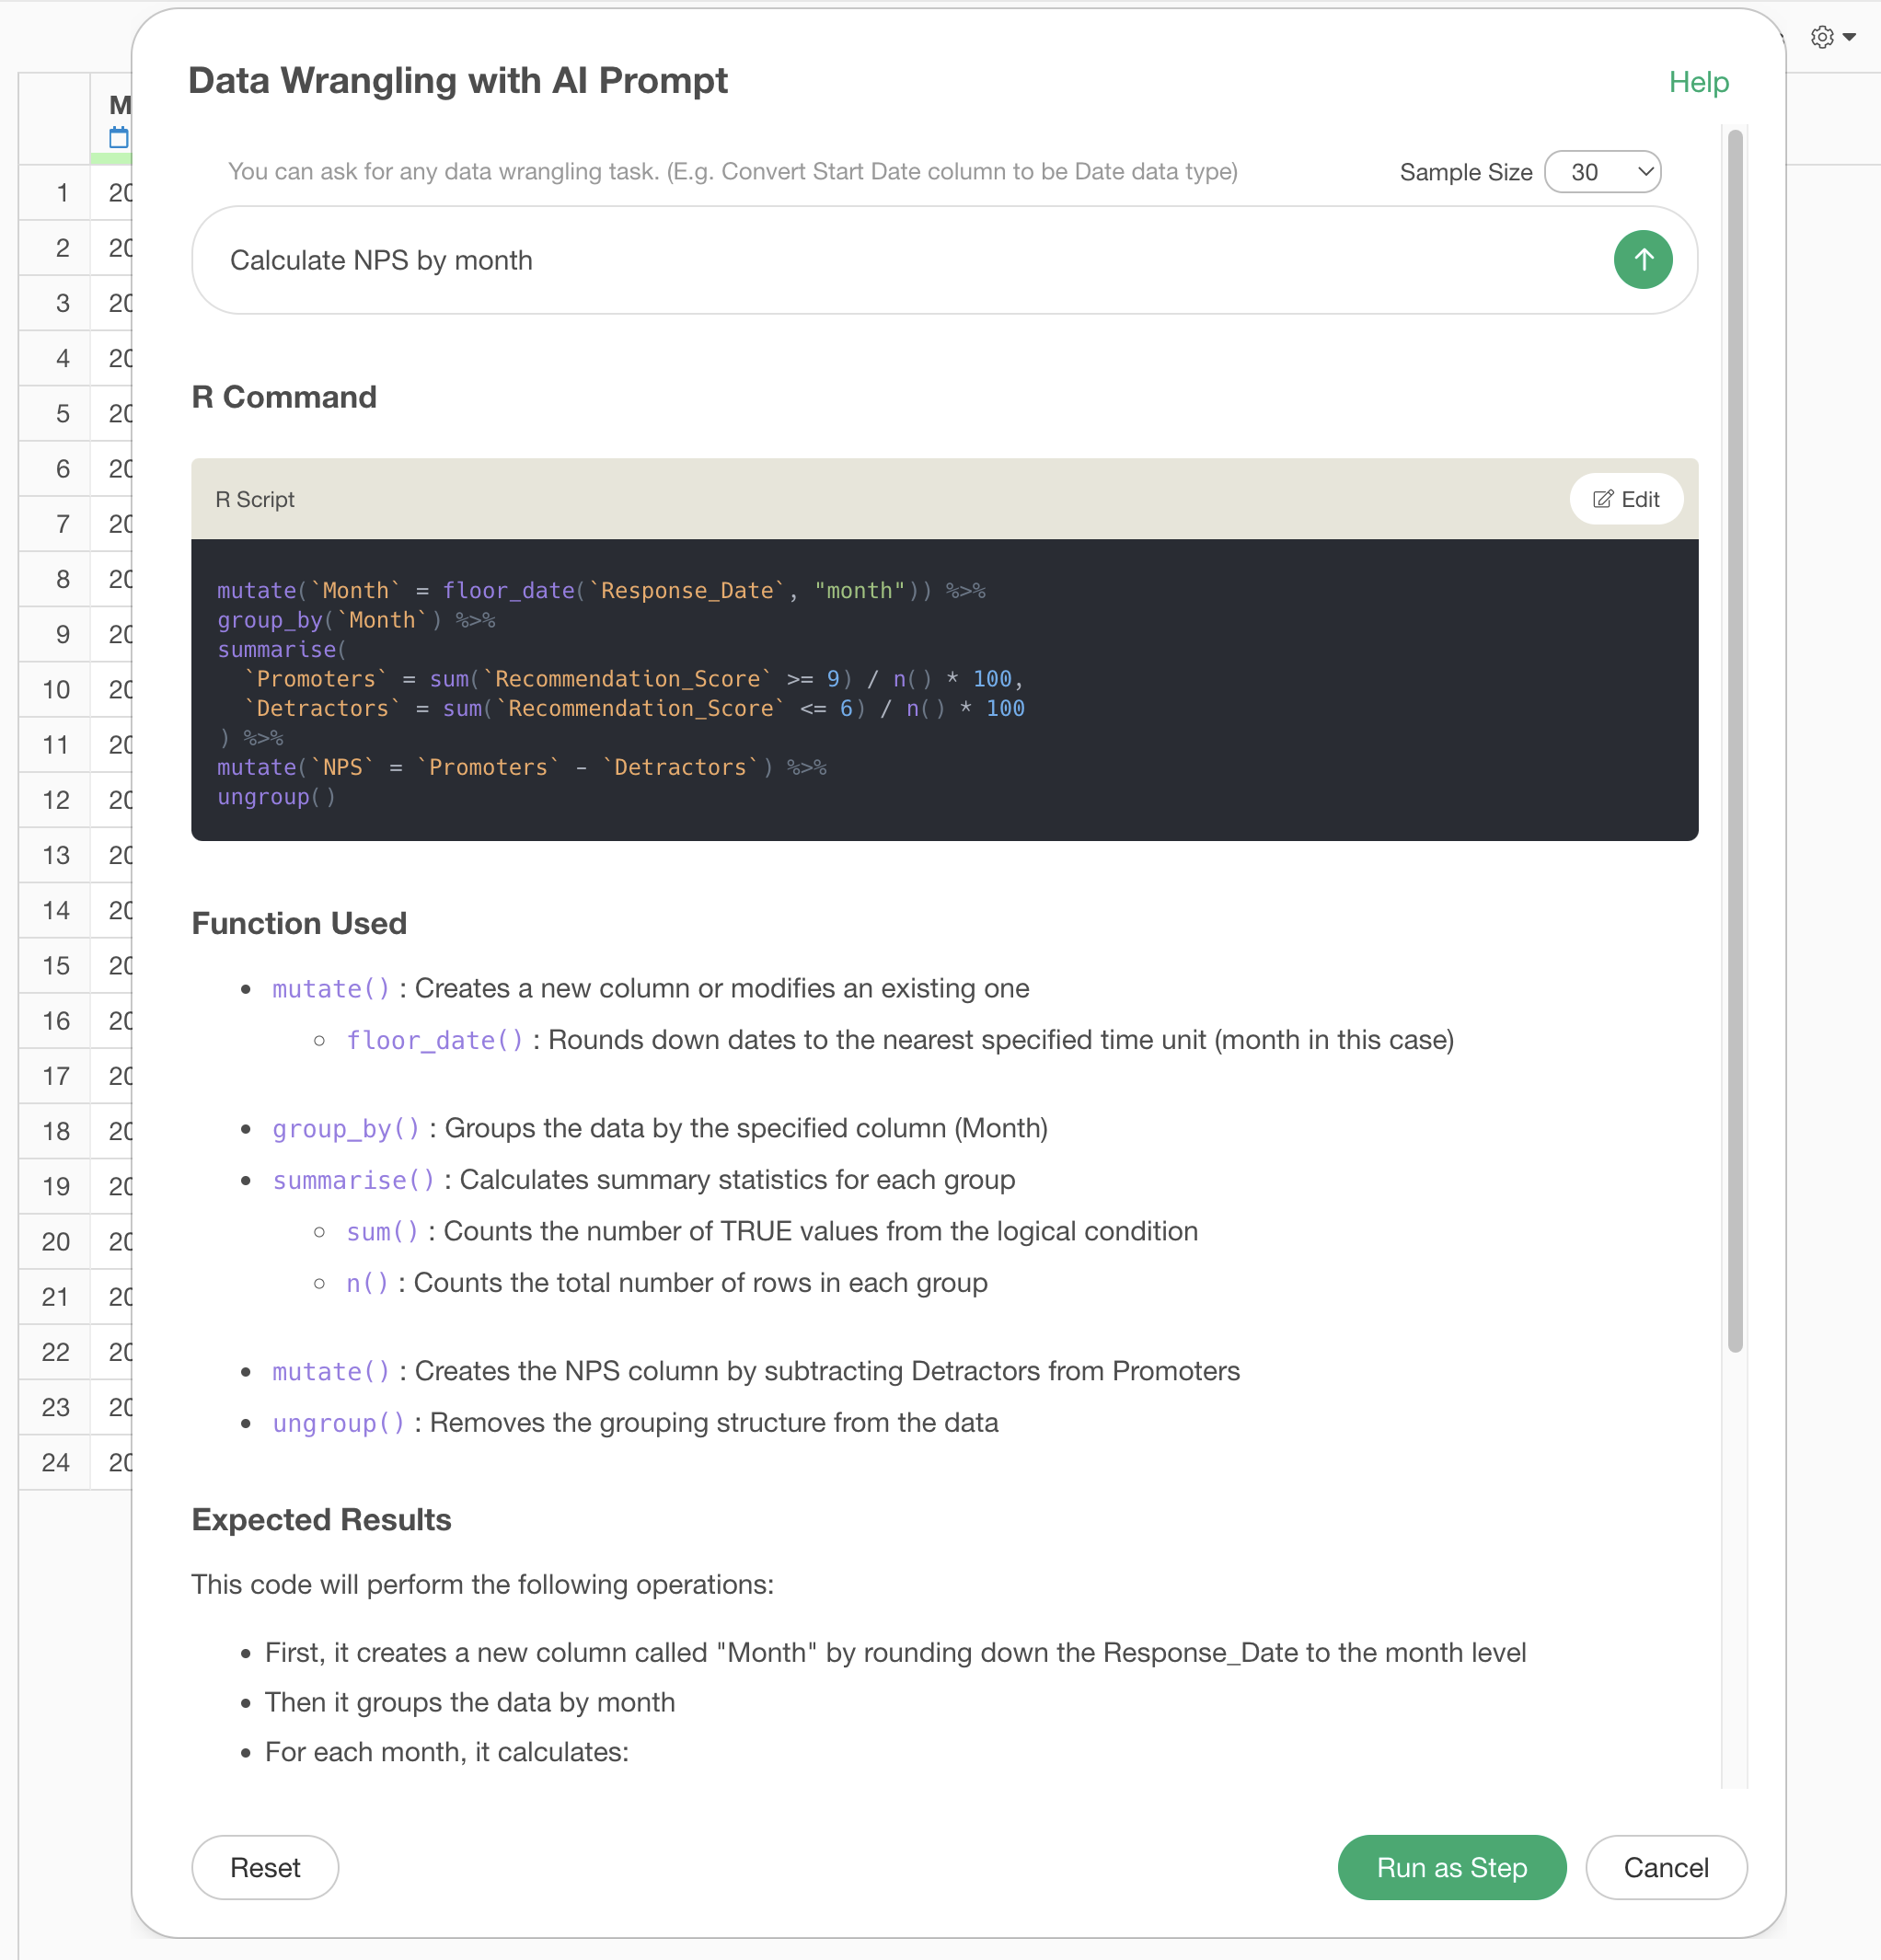
Clicking the “Run as Step” button will add the code output by AI as a step and execute that process.
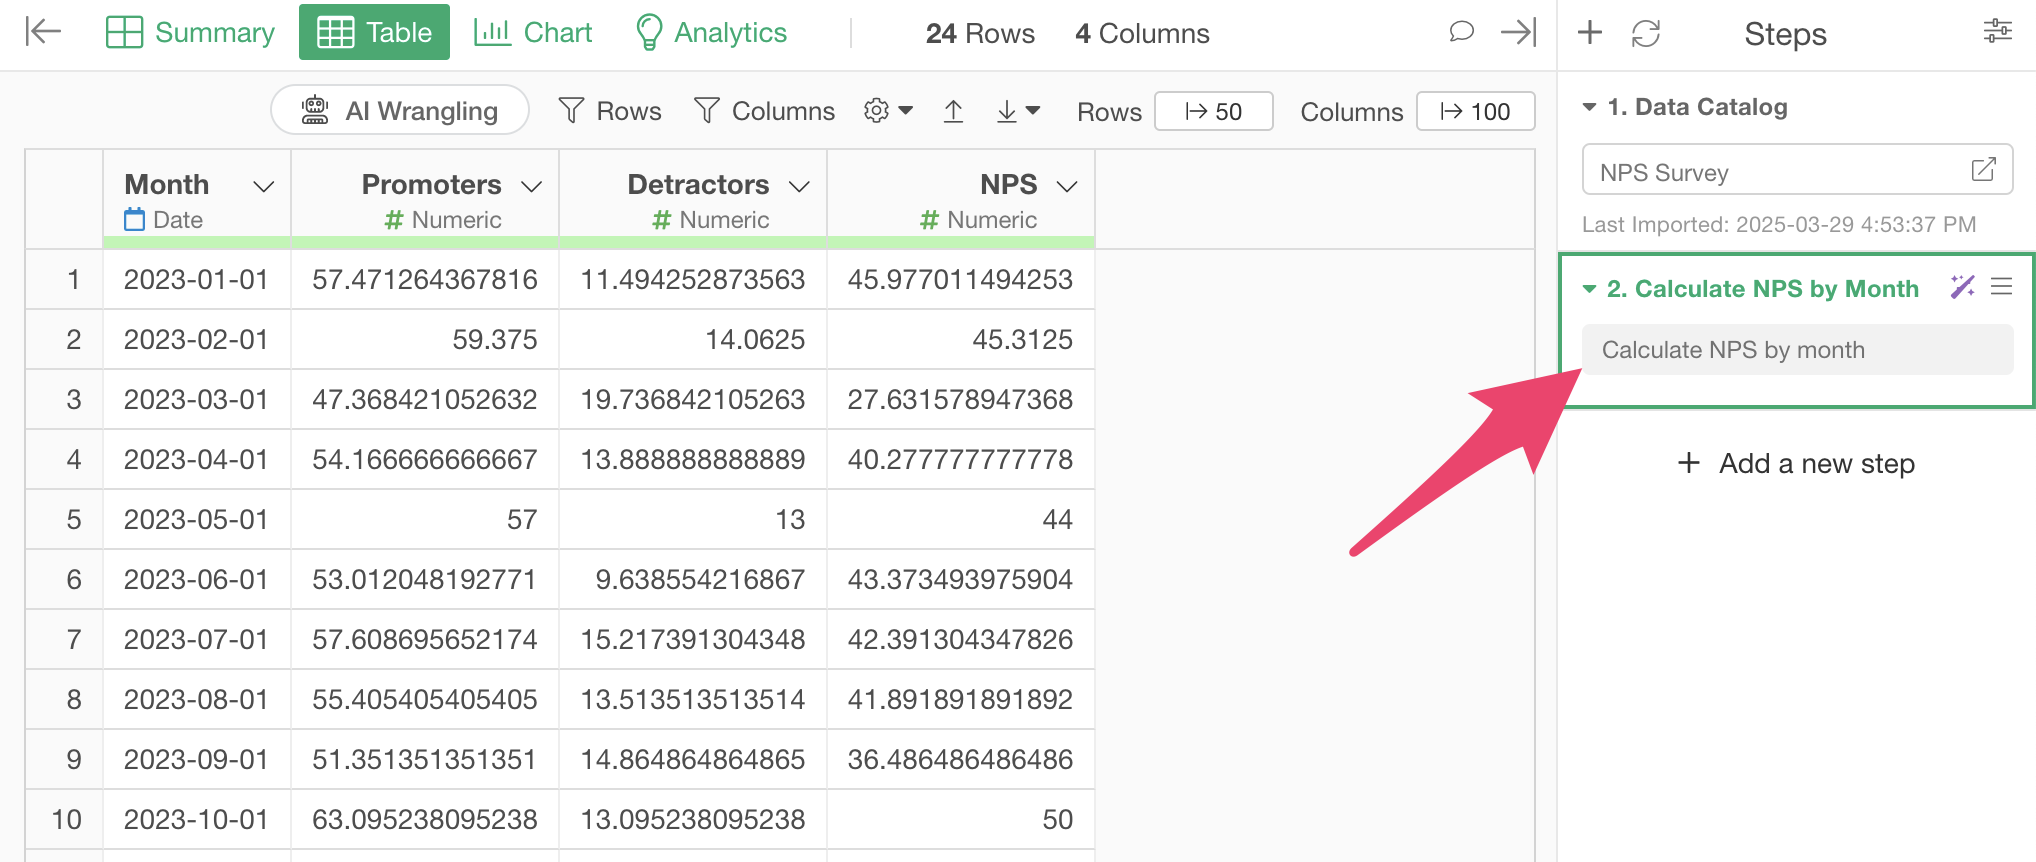
Even without knowing complex calculation methods or data processing techniques, you can quickly and easily calculate monthly NPS.
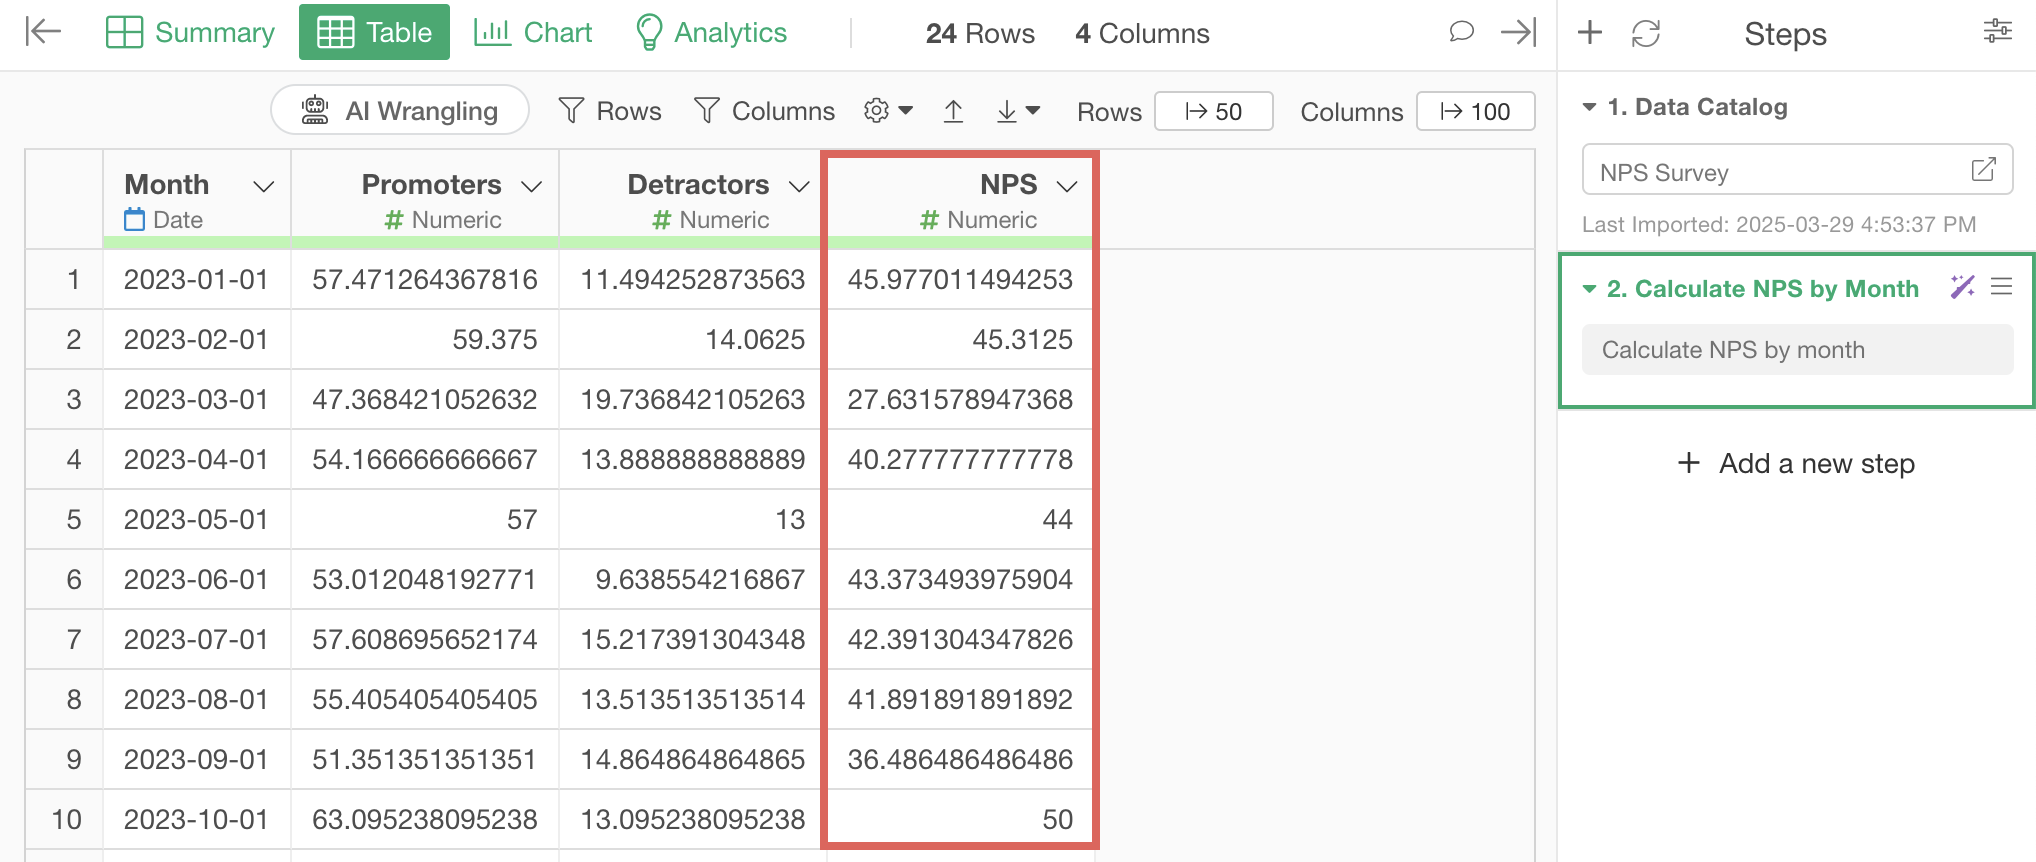
By the way, you can check what the R script output for data processing is specifically doing within the AI prompt dialog.
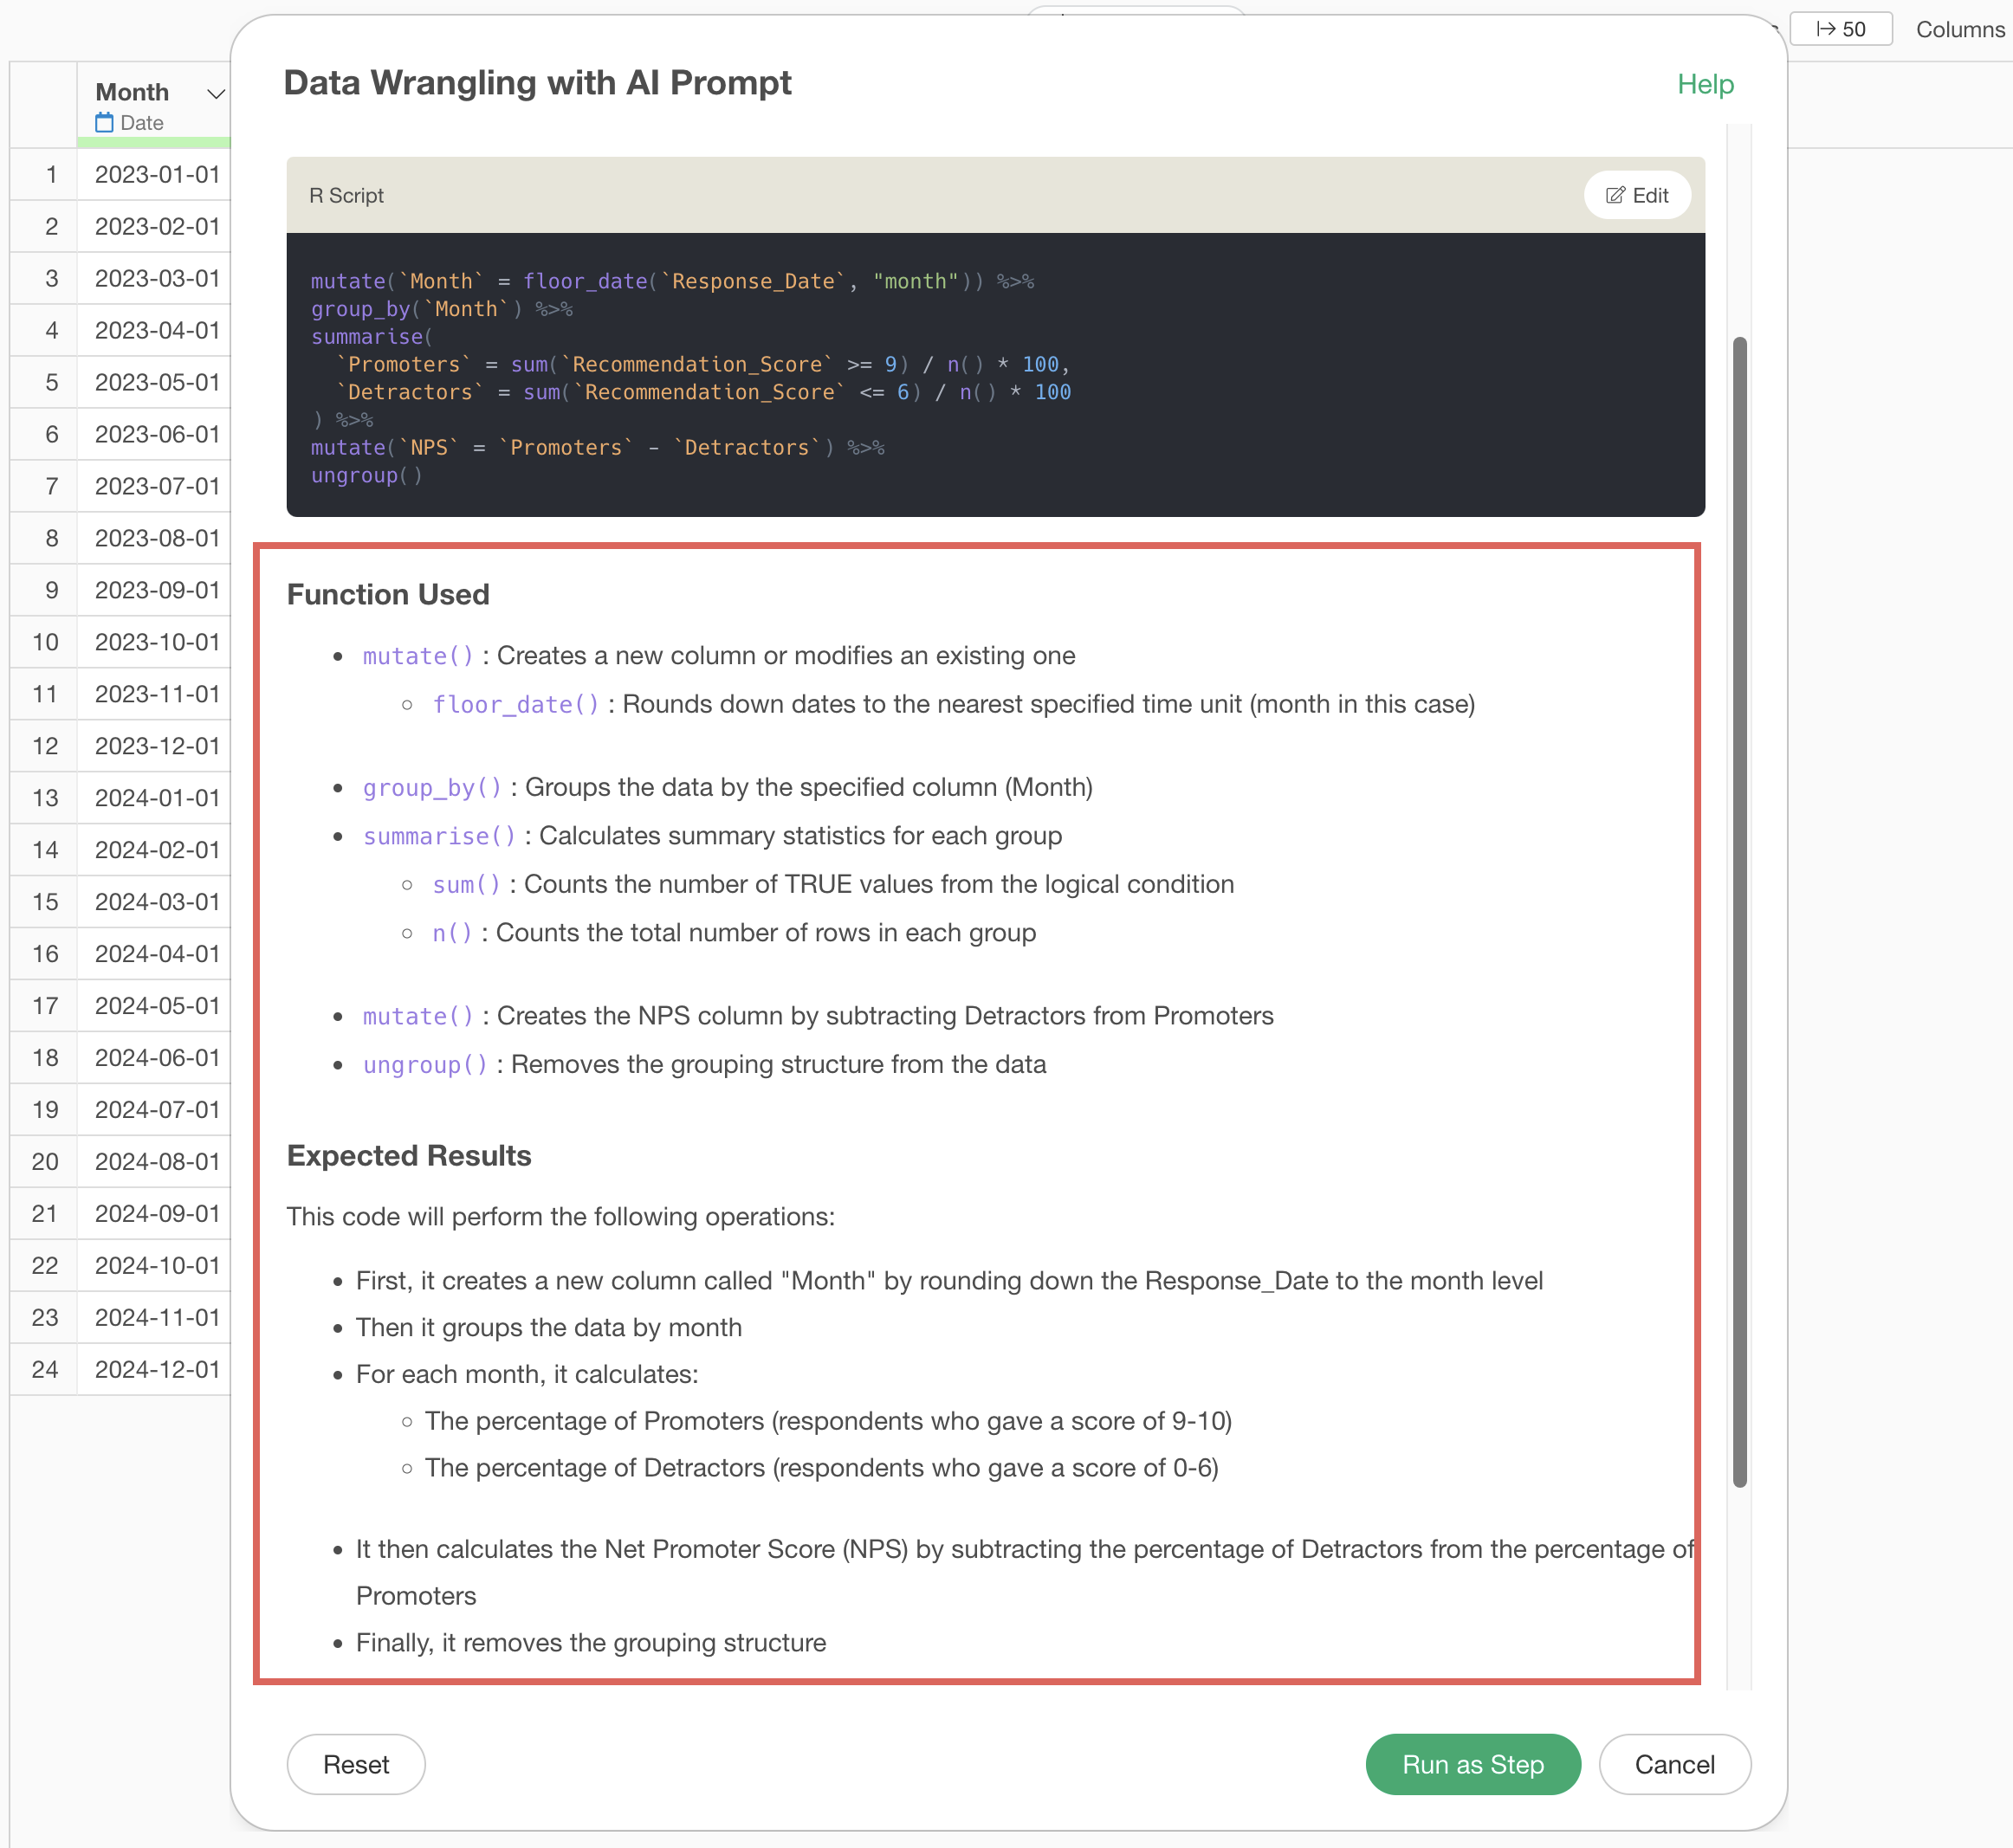
This time, the NPS was calculated monthly by default.
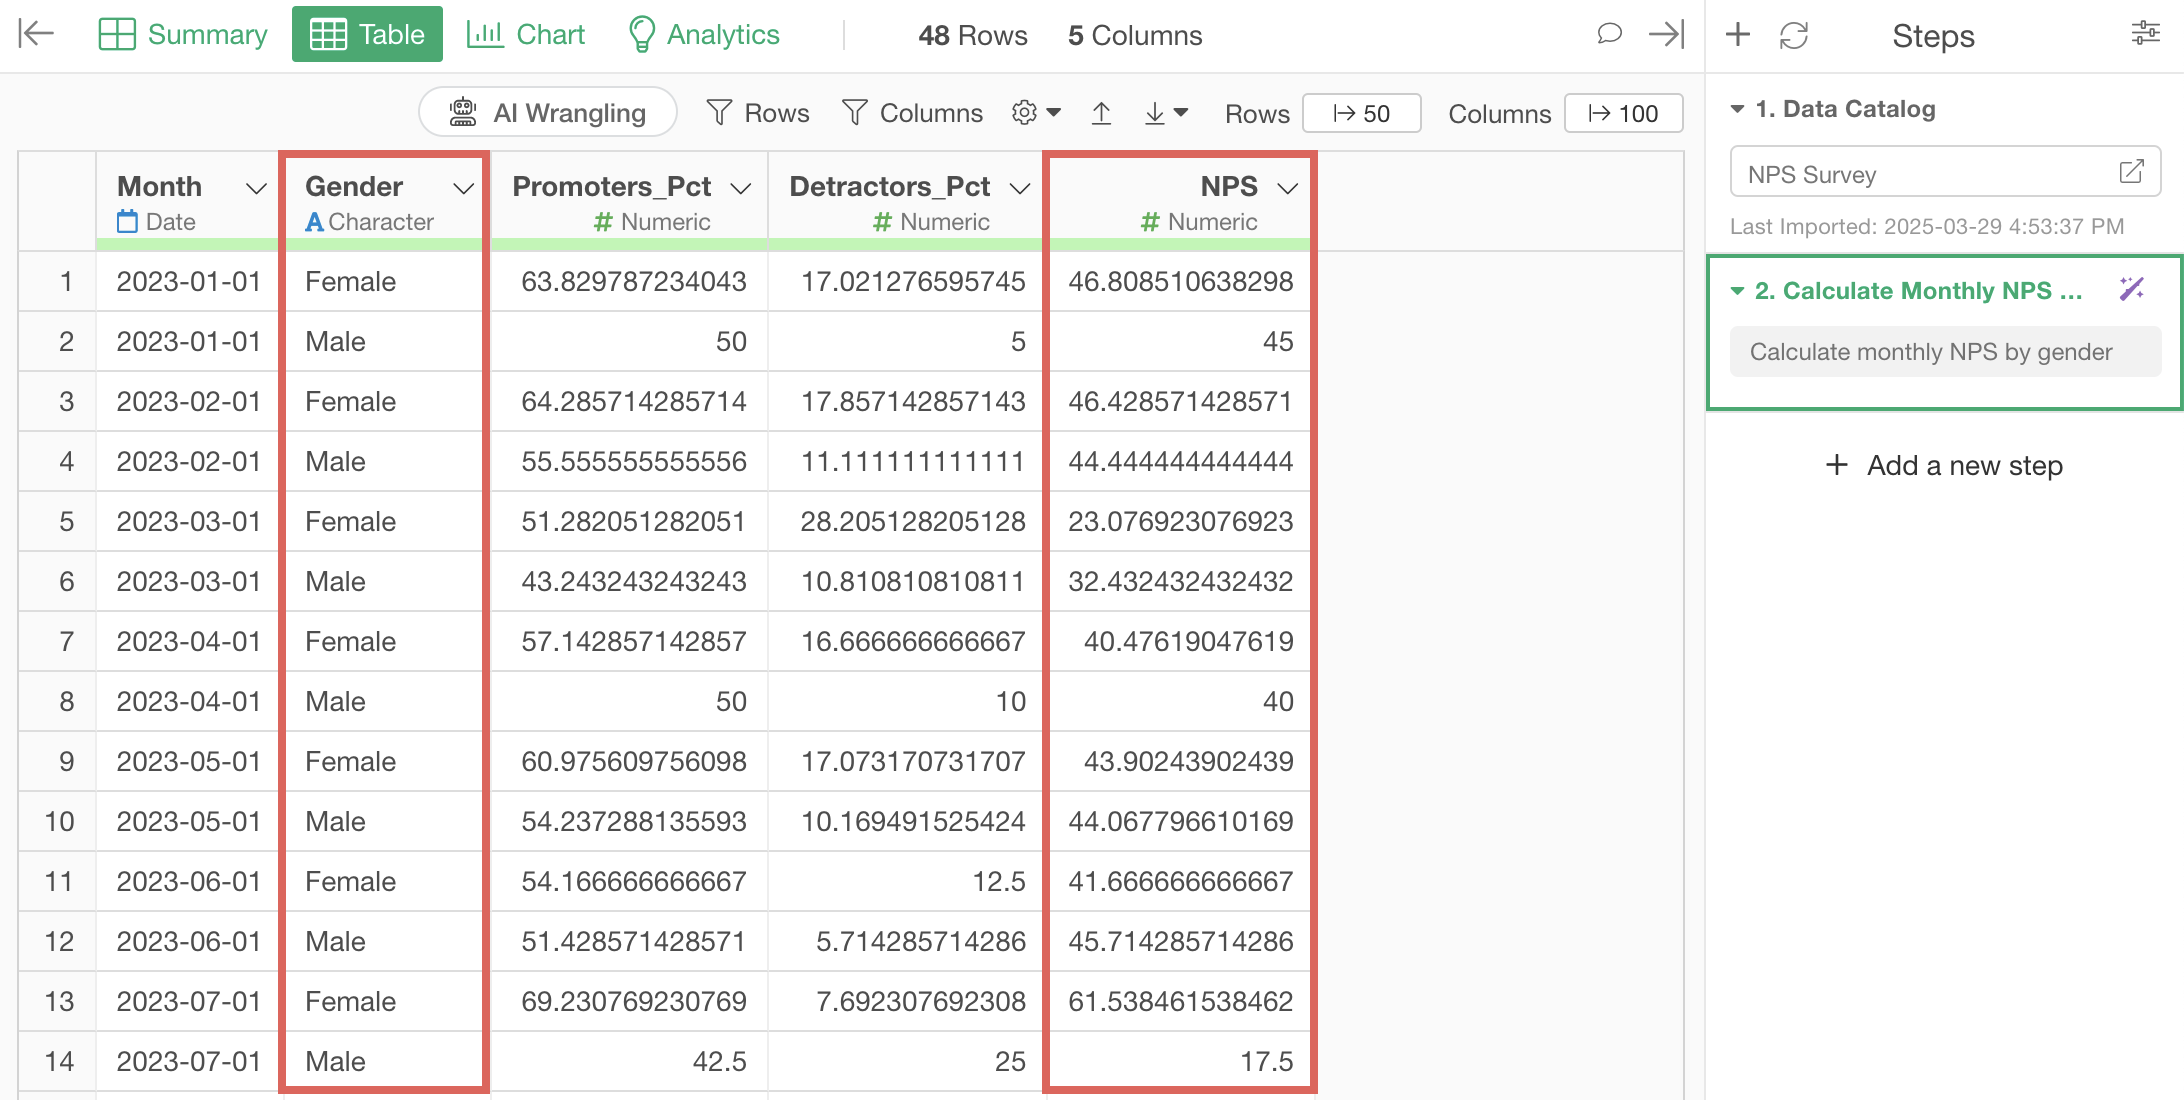
However, you can further develop this and throw instructions to calculate the monthly NPS for each gender.
Click on the token within the step.

When the original prompt dialog opens, re-enter the following text in the prompt:
Calculate monthly NPS by gender
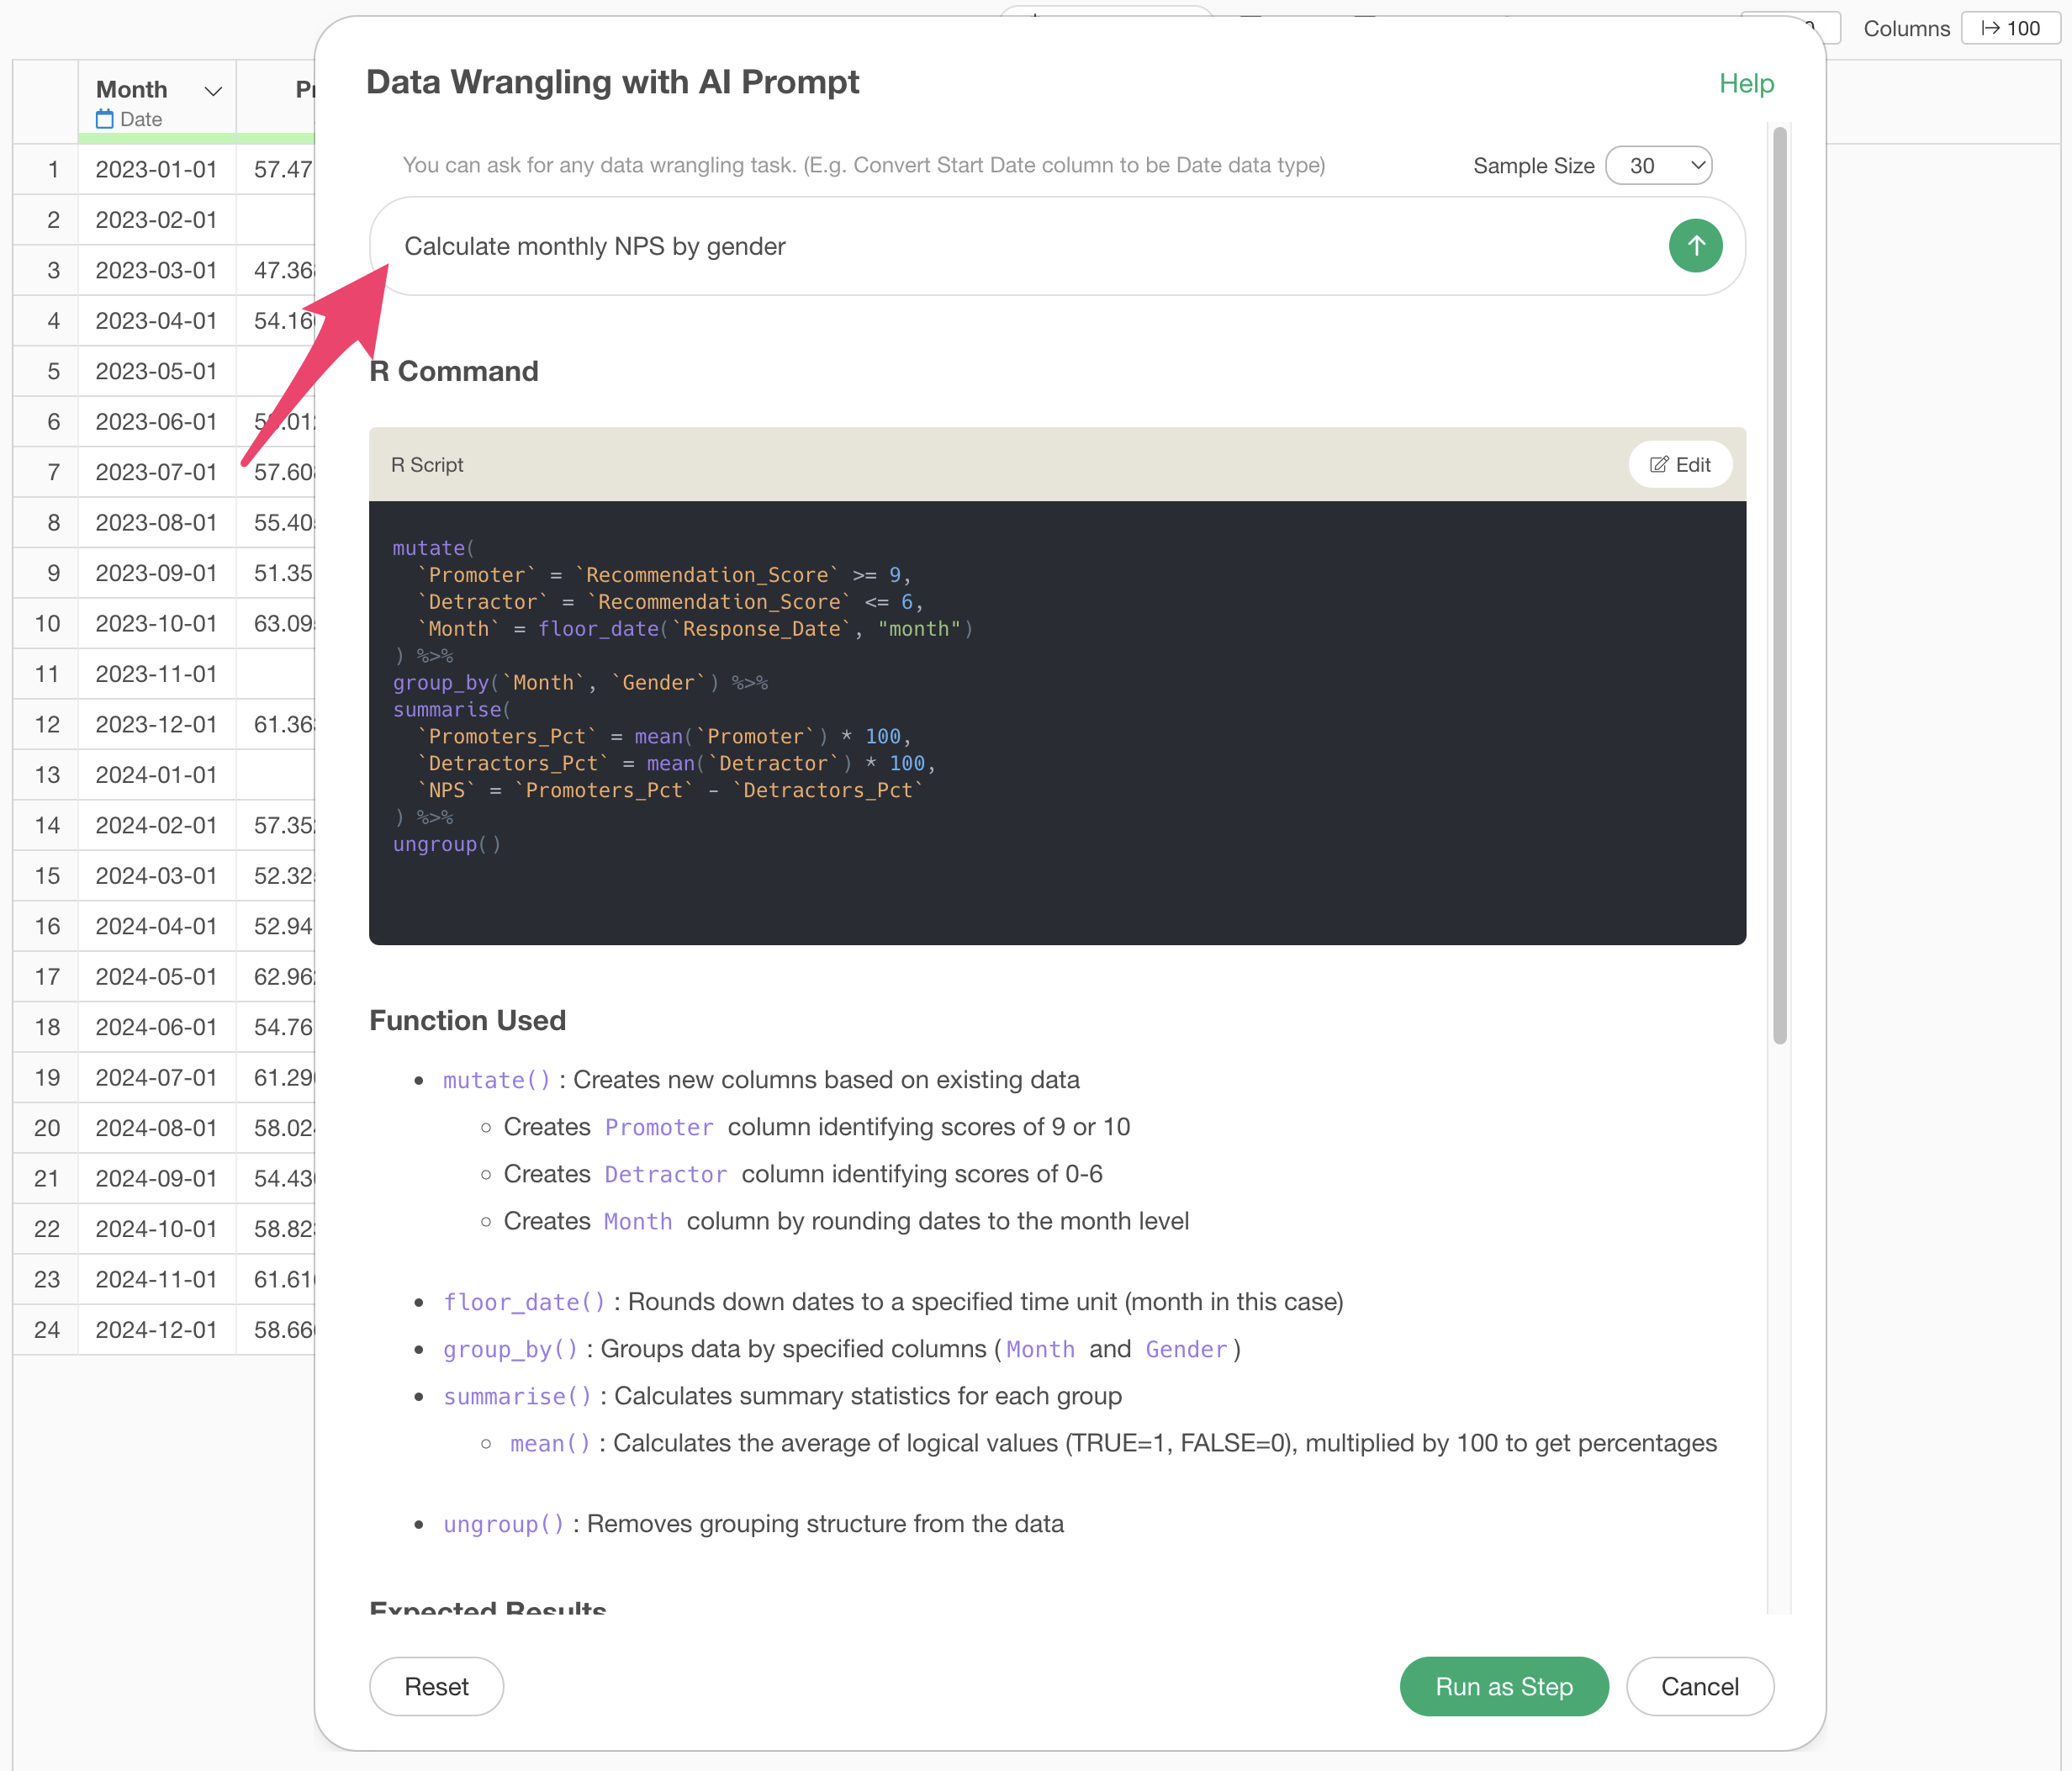 This
will add processing to calculate NPS by gender, so go ahead and run
it.
This
will add processing to calculate NPS by gender, so go ahead and run
it.
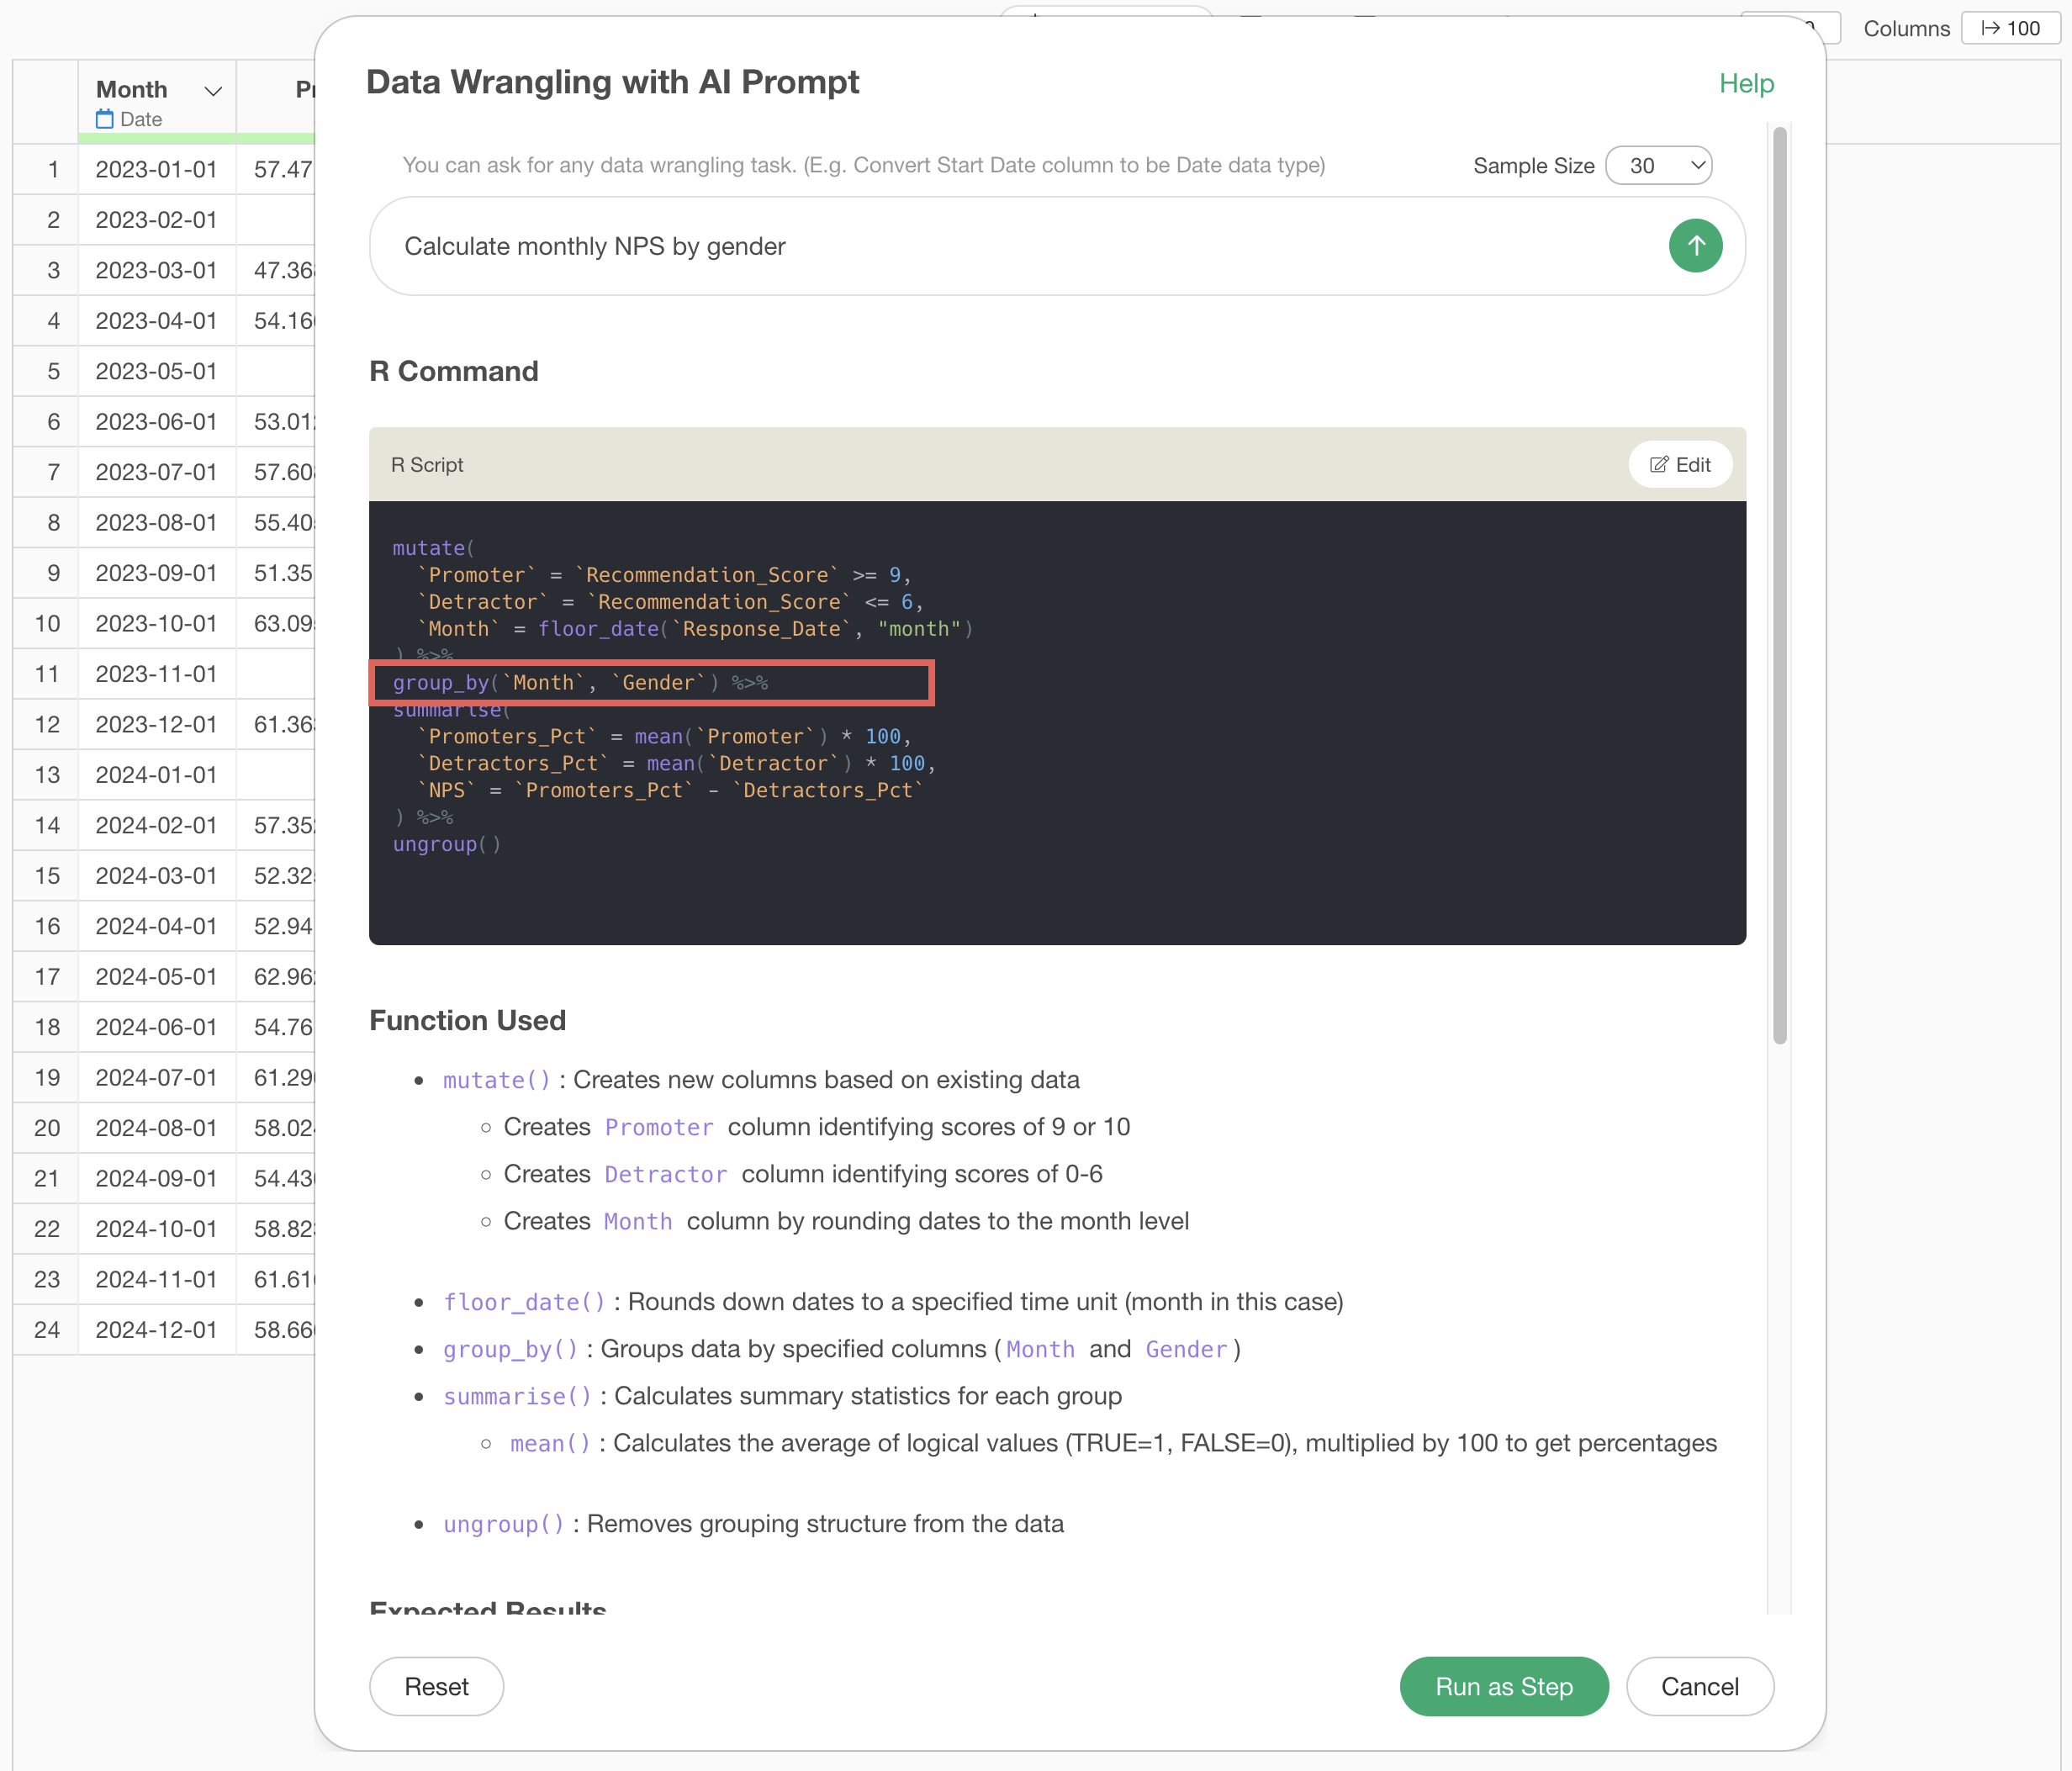
With this, we were able to calculate the NPS for each gender.
Marketing KPIs that can be created in the same way
The following marketing KPIs can be created in the same way as NPS, just by instructing their creation in the prompt:
- Brand awareness rate
- Number of trials
- Conversion rate
- Number of referrals
- NPS (Net Promoter Score)
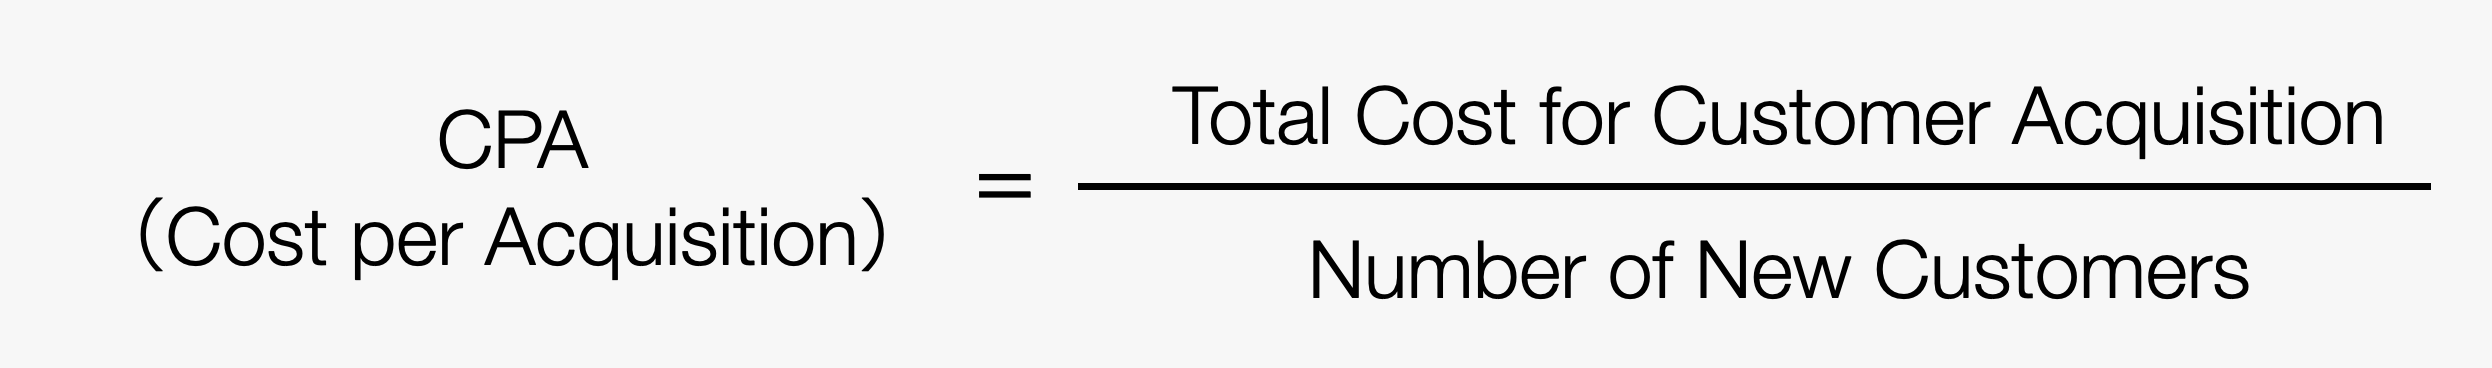
2. Creating CPA (Cost per Acquisition)
The second pattern is one where you should prepare the data in a certain form before creating the business metrics.
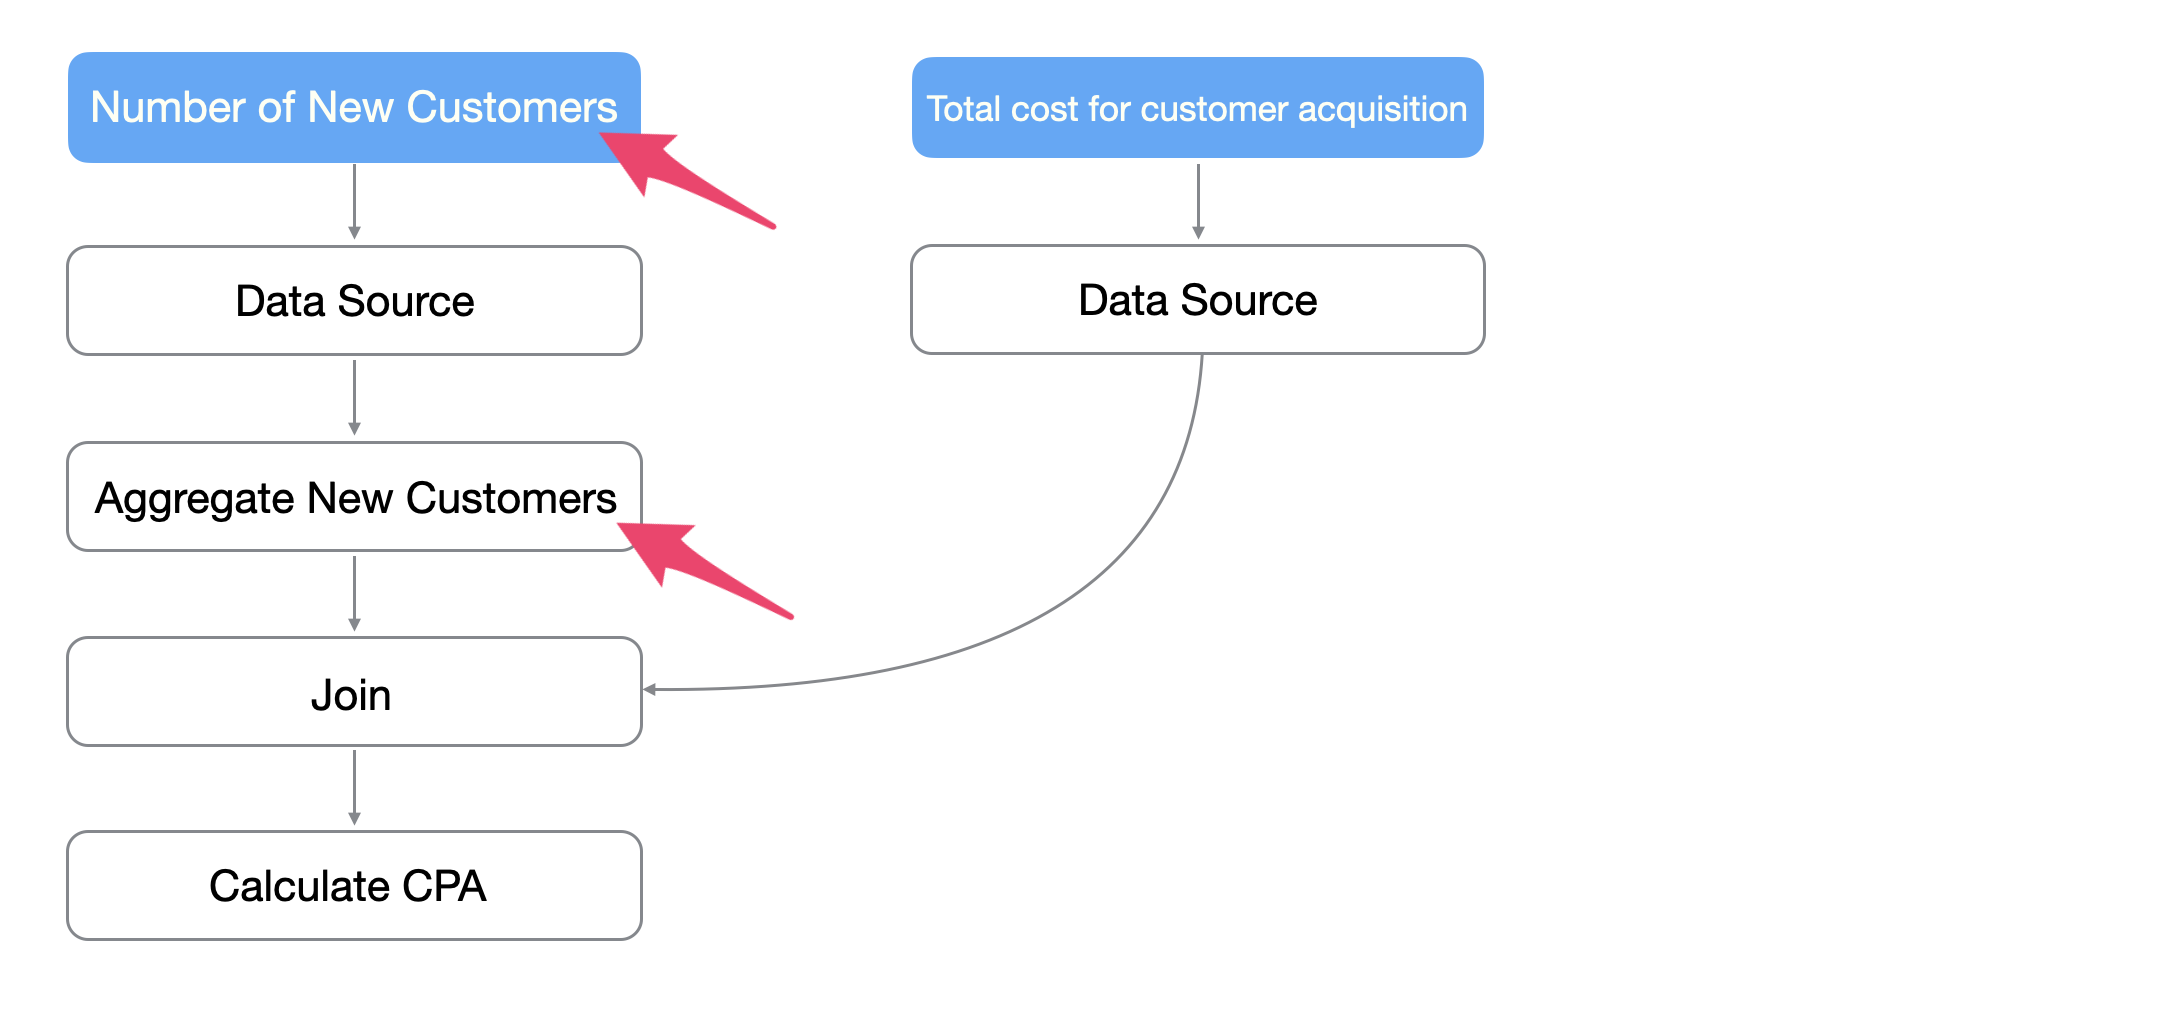
For example, in the case of CPA (Cost per Acquisition), which can be calculated using the following formula, you need to combine it with other data and aggregate at the customer level once before creating the calculation.
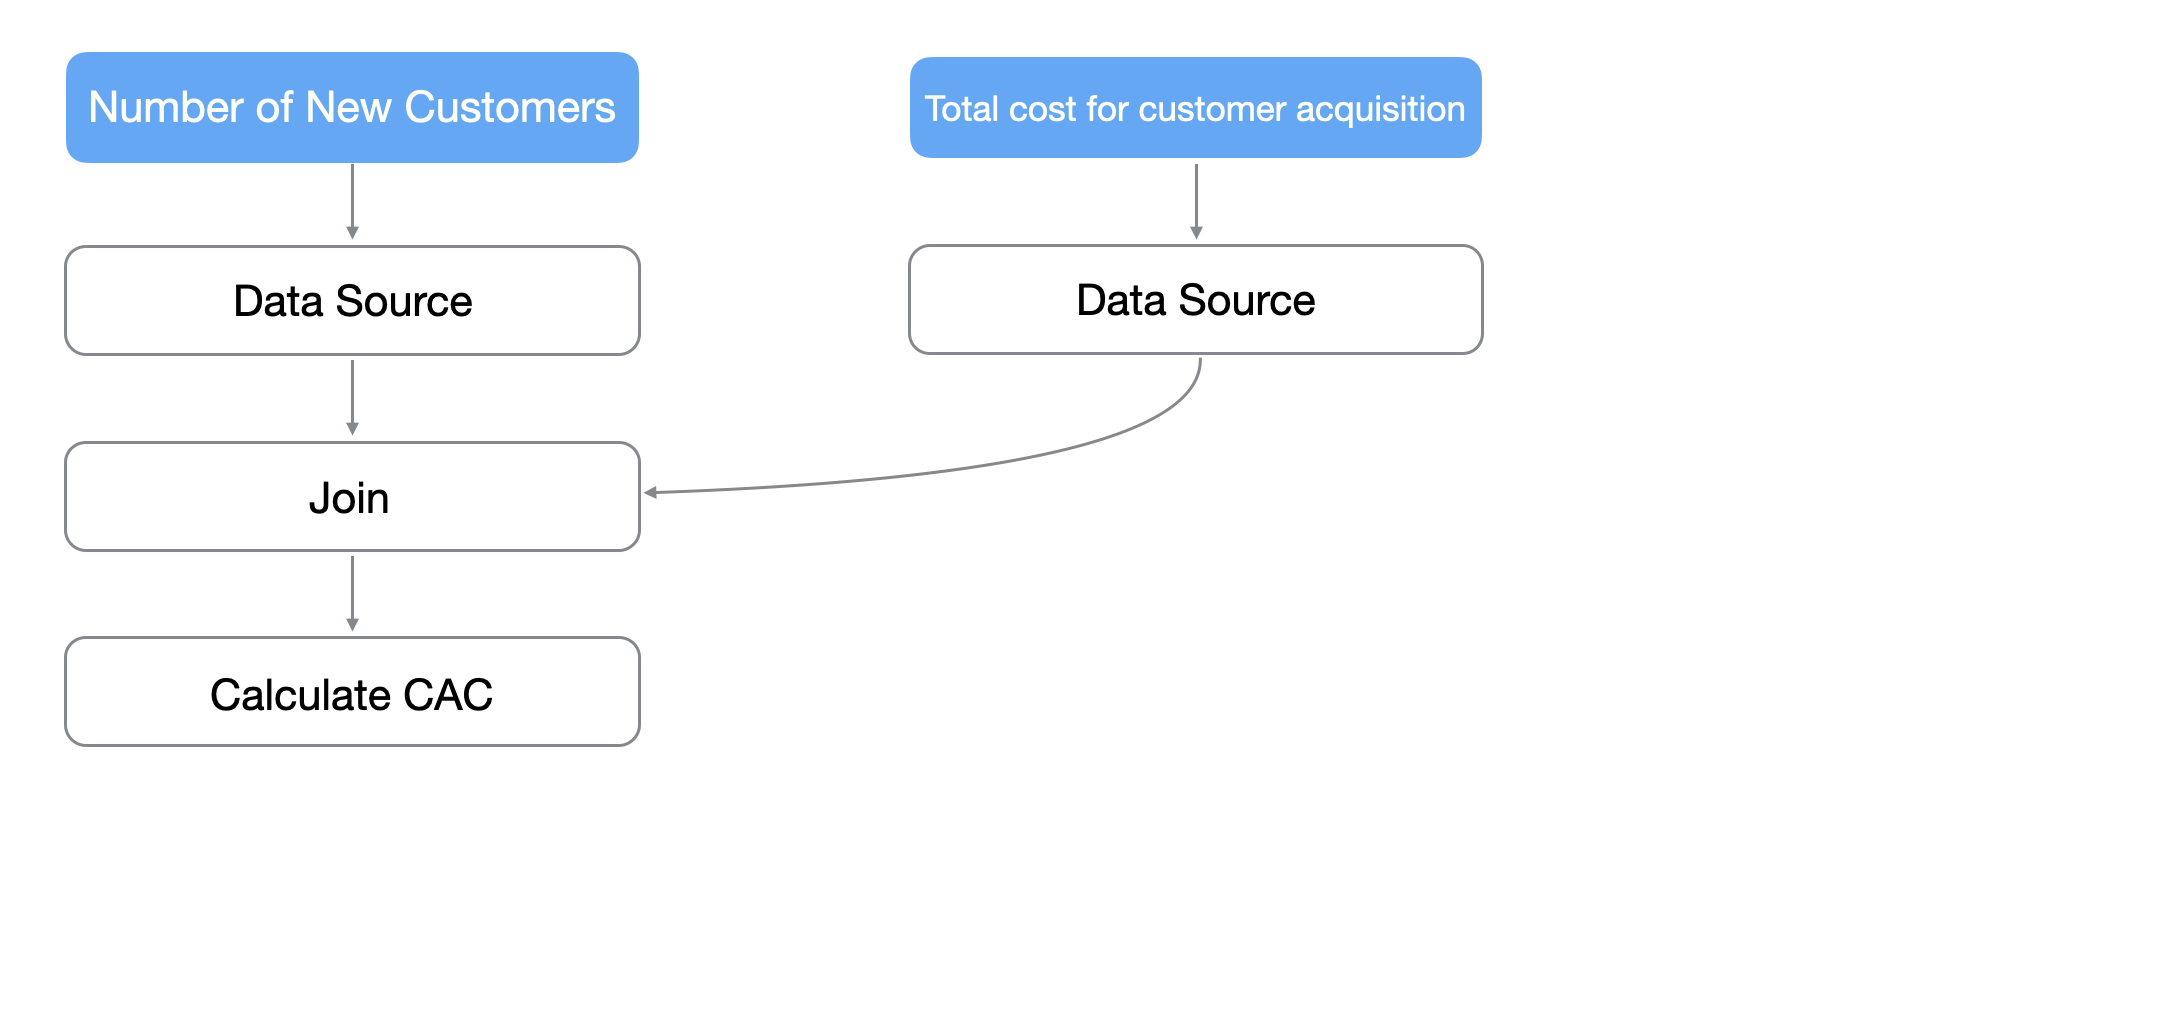
Generally, acquisition data from marketing activities and data on costs spent on marketing are managed separately, so before calculating CPA, you first need to combine these two sets of data.
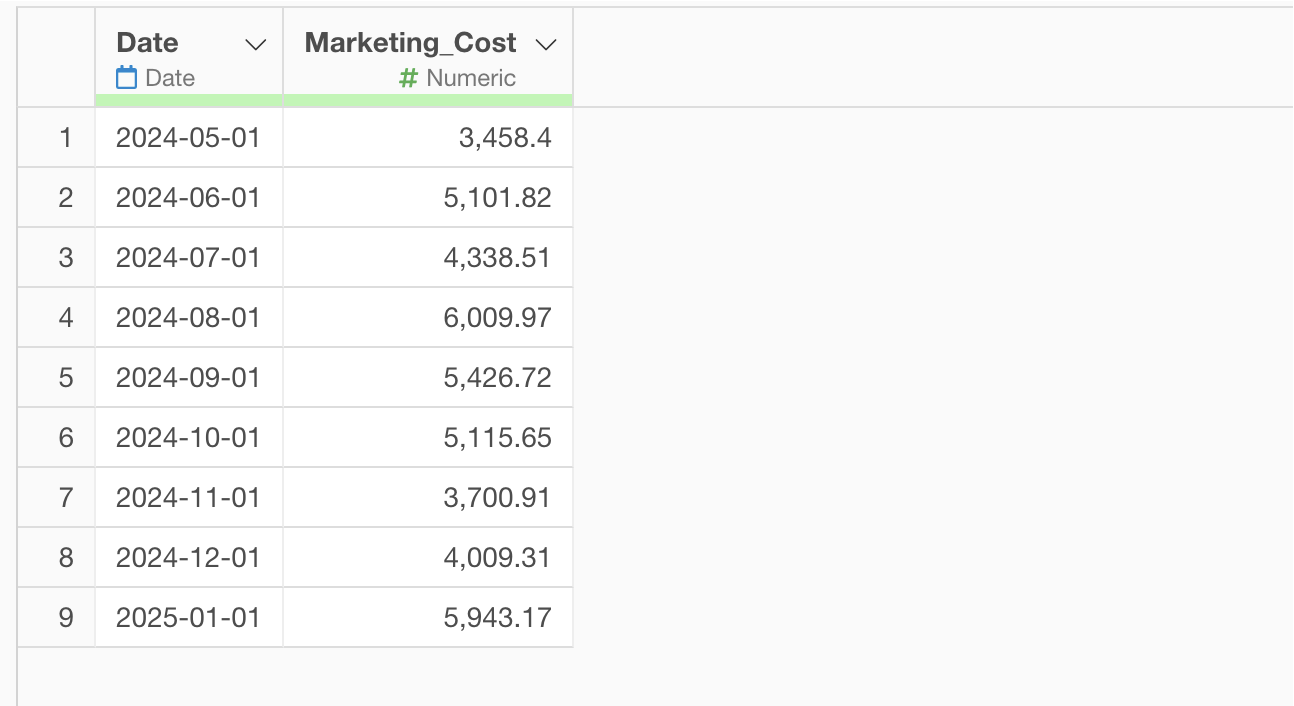
Specifically, you combine monthly marketing cost data with monthly number of sign-ups data, and then calculate CPA.
Also, it’s often the case that the number of sign-ups per month is not in one row, as shown below.
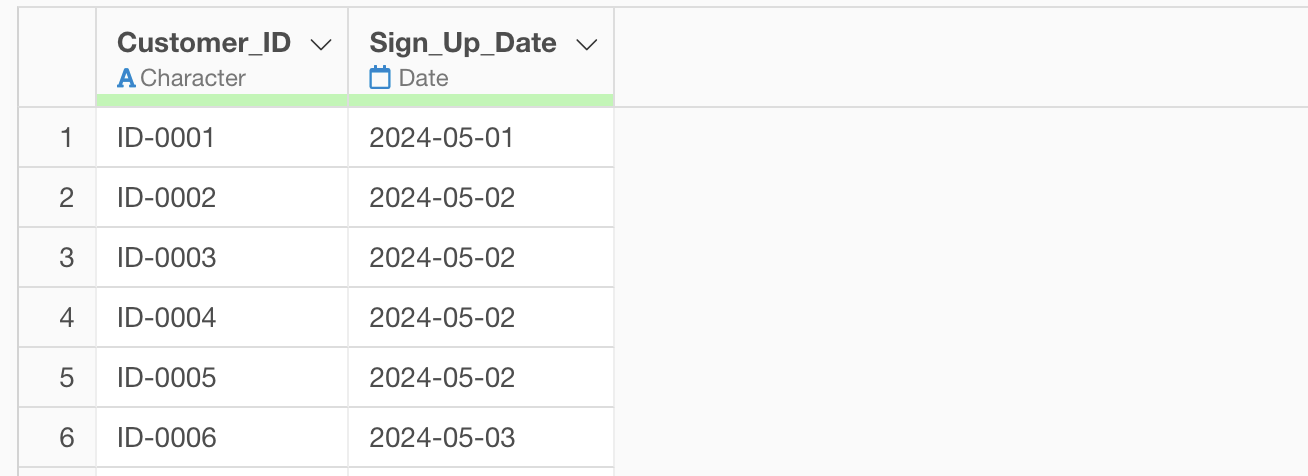
In such cases, you need to calculate CPA in multiple steps.
By utilizing AI prompts, you can easily execute these processes without specialized knowledge of data processing.
From here, we’ll introduce how to calculate CPA using AI prompts.
This time, we’ll calculate CPA using data on sign-ups and marketing costs. You can download sample data for each from the following links:
1. Aggregating the number of sign-ups from marketing
As the first step, we’ll aggregate the number of sign-ups per month. These sign-ups are all obtained as a result of marketing activities.
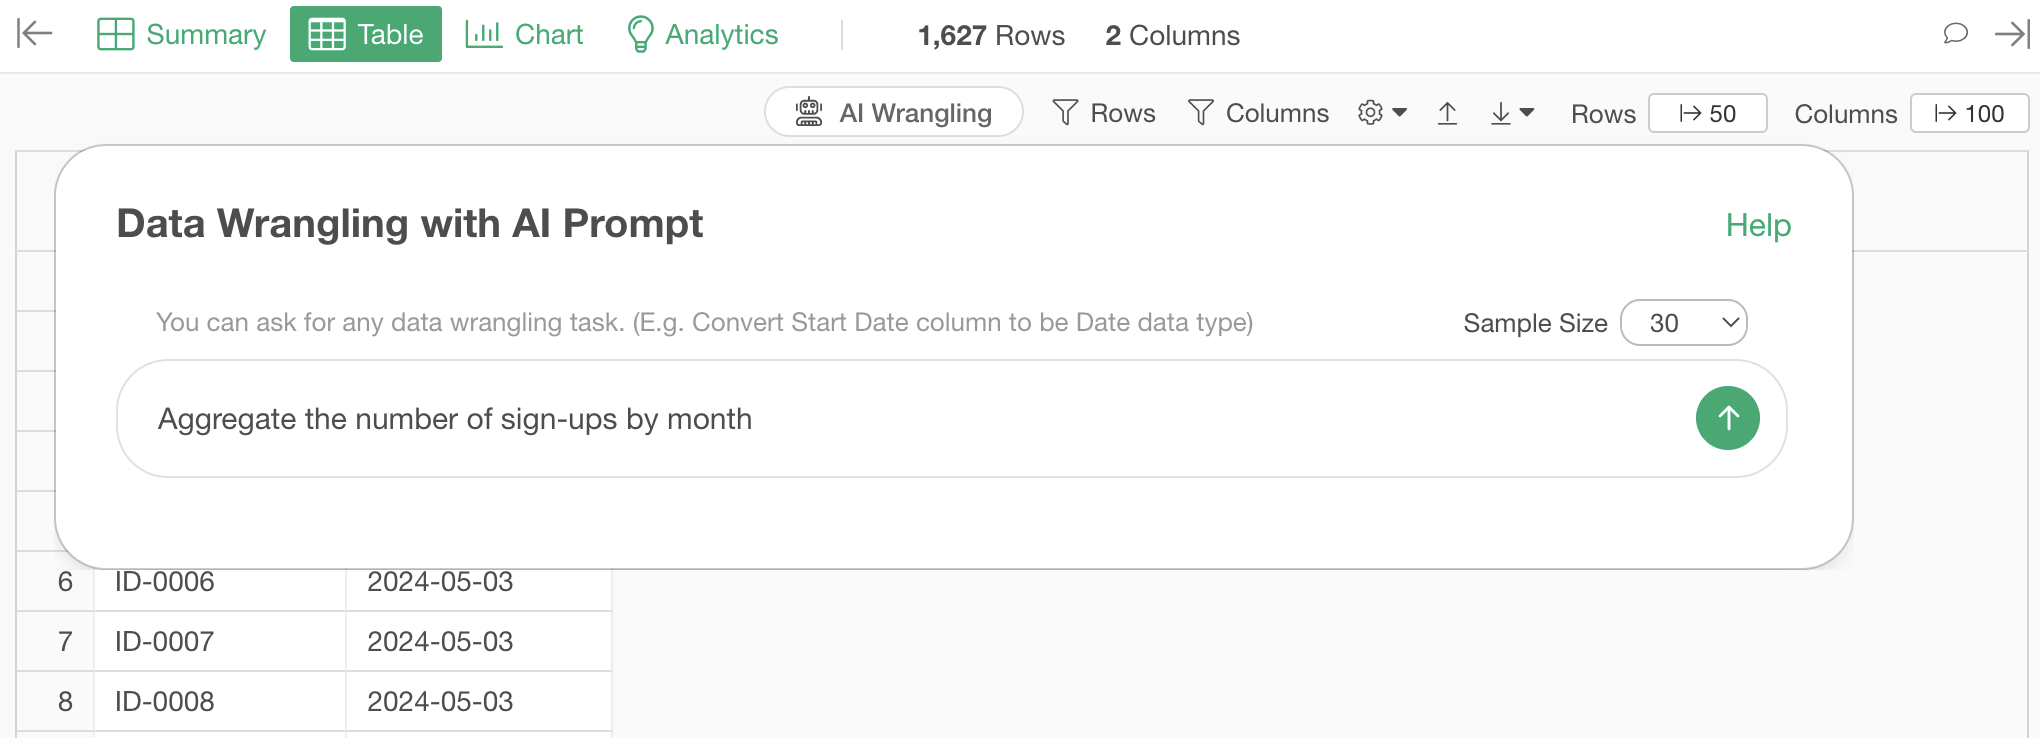
Display the AI prompt window, enter the following text in the window, and execute:
Aggregate the number of sign-ups by month
R commands to calculate the number of sign-ups per month will be generated, so run them.
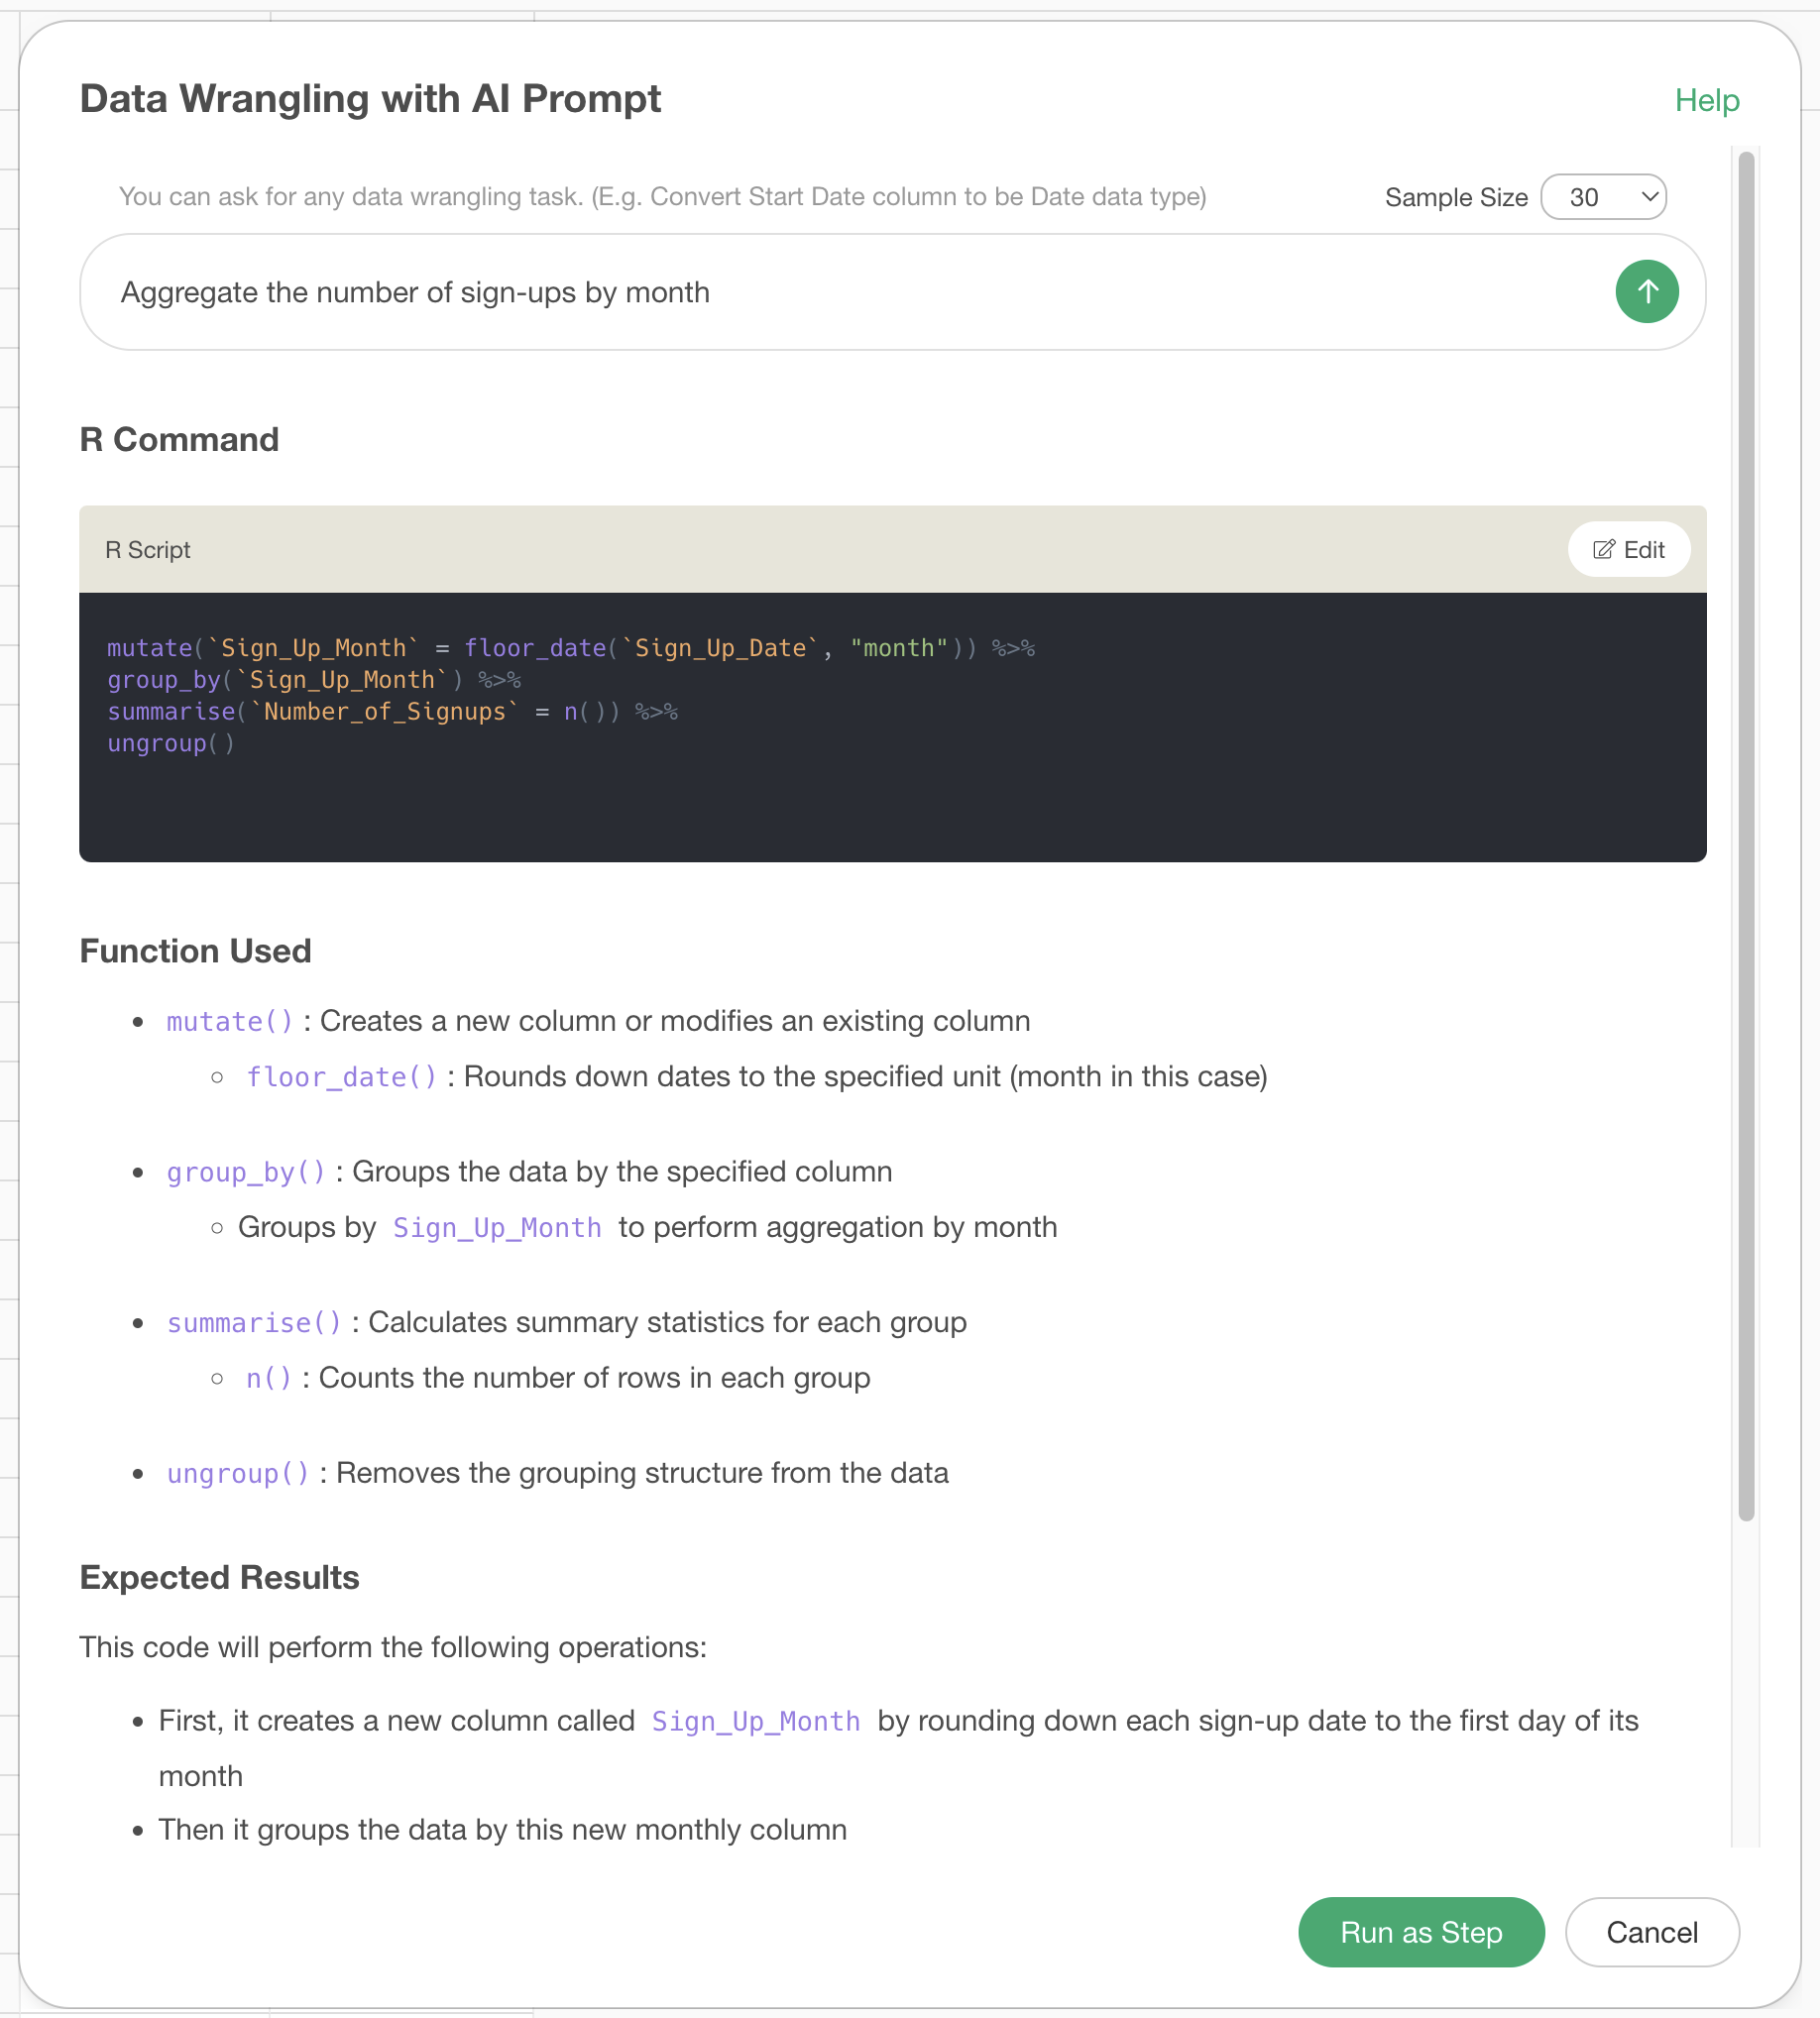
This calculates the number of sign-ups per month.
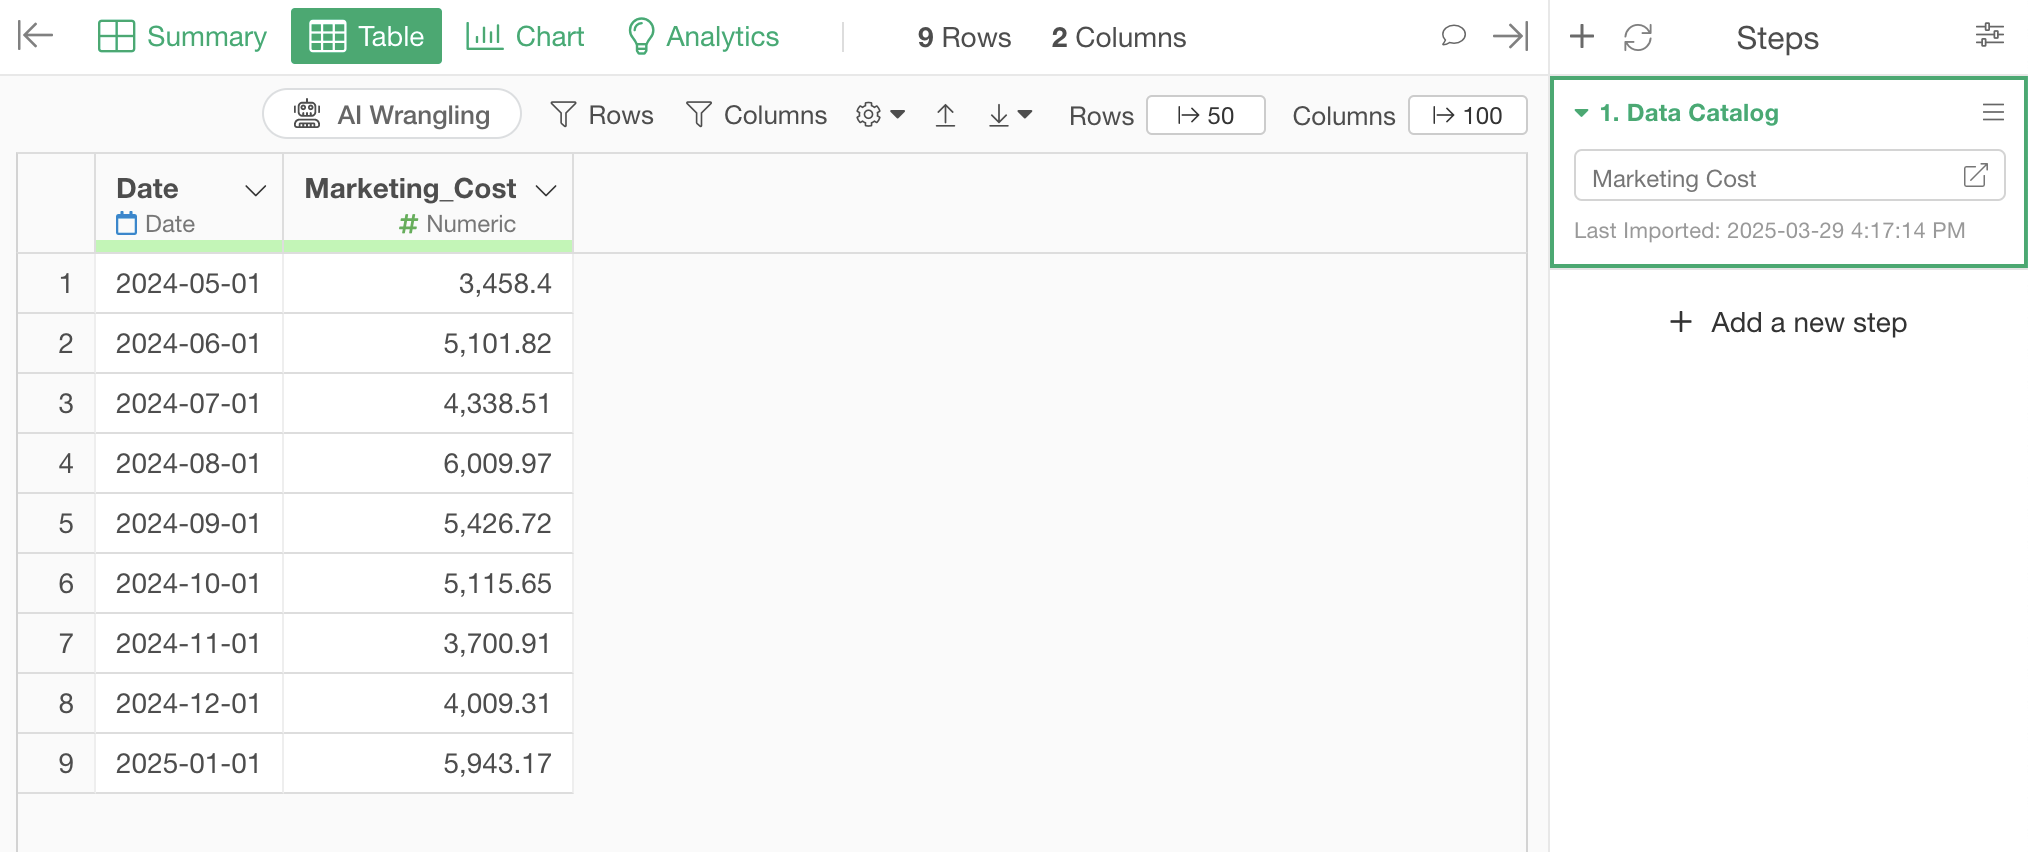
2. Combining cost data
Next, we’ll join the marketing cost data with the sign-up number data.
When combining two sets of data, type “$” (dollar sign) in the AI prompt dialog.
This will display all data frames within the same project, allowing you to select the data frame you want to process.
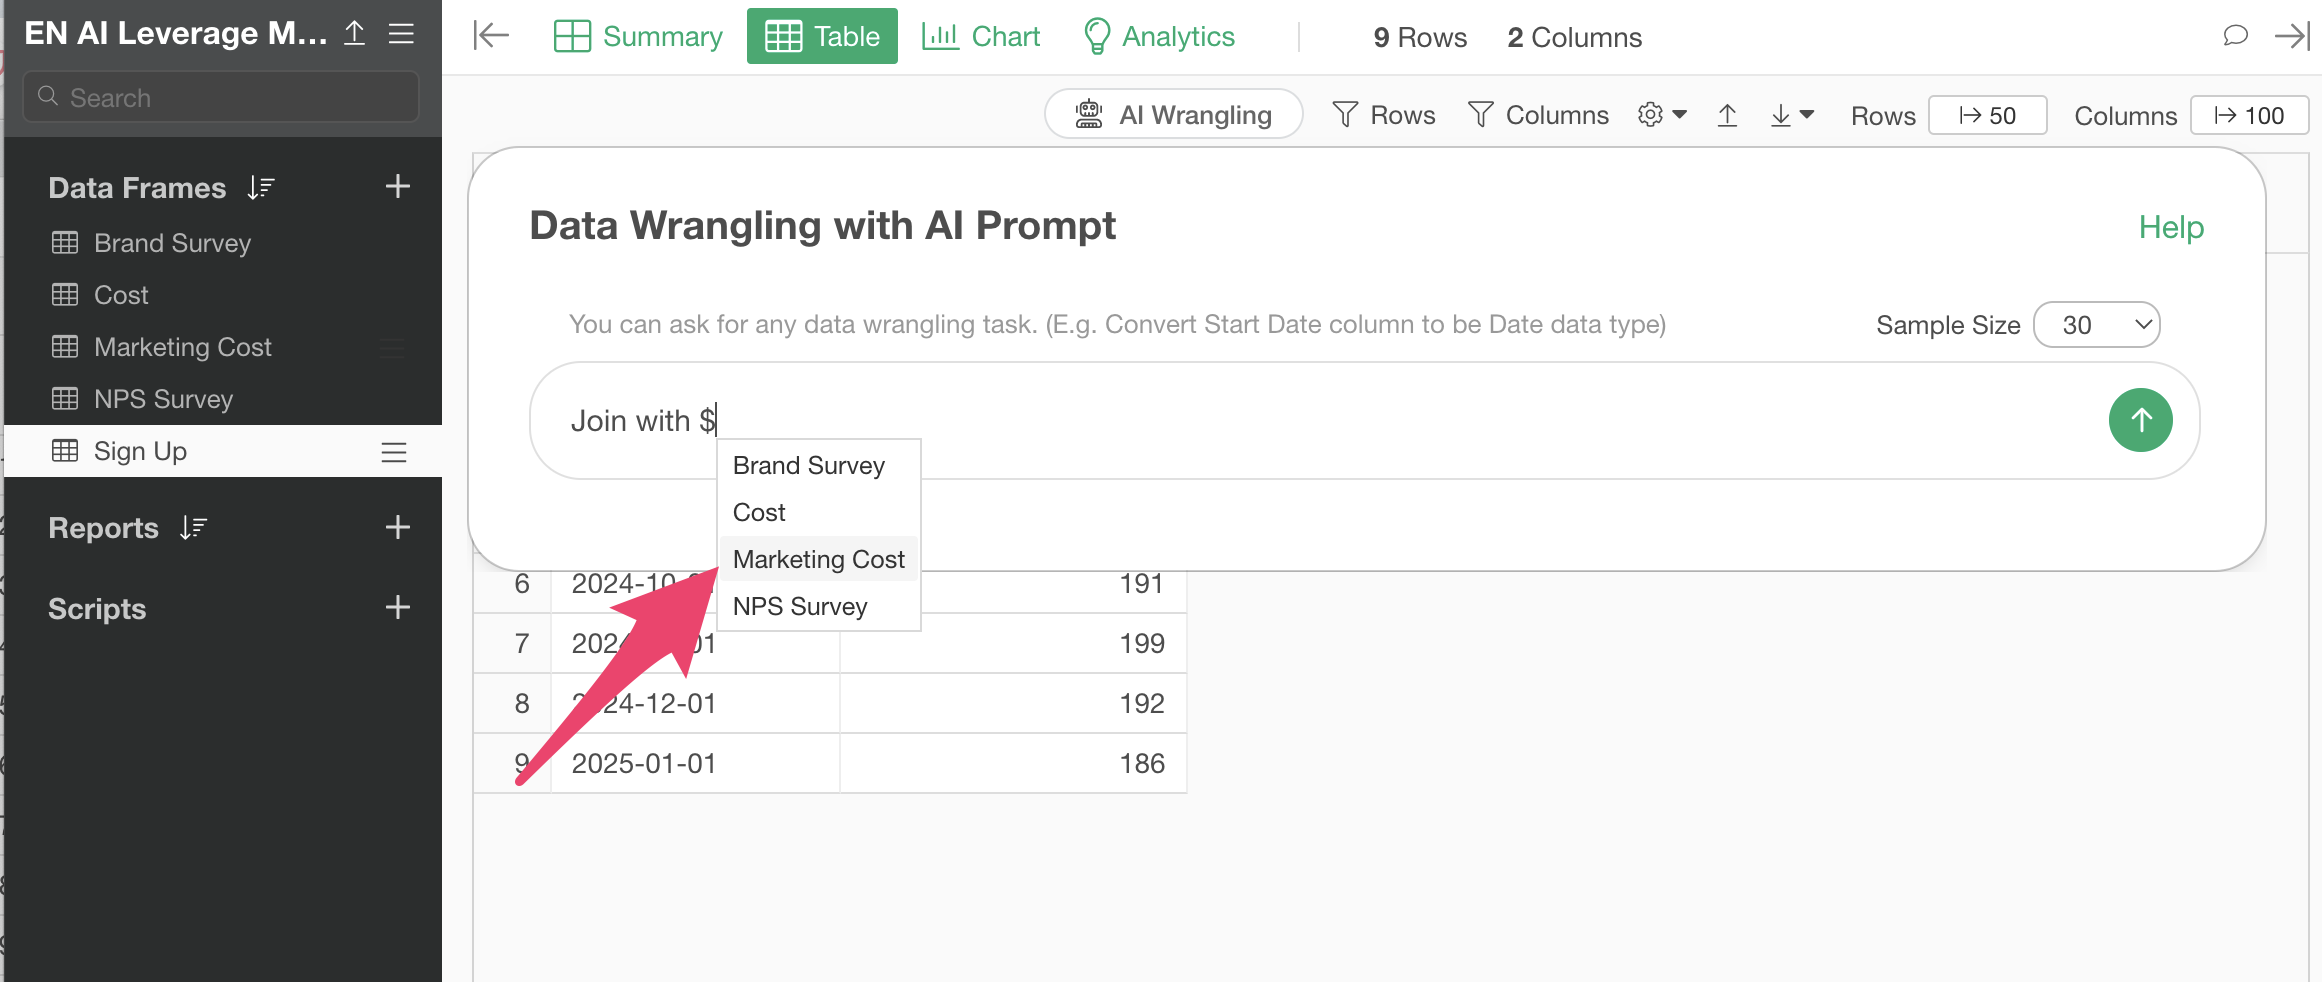
Select the marketing cost data frame, enter the following text in the prompt window, and execute it.
Join with Marketing Cost
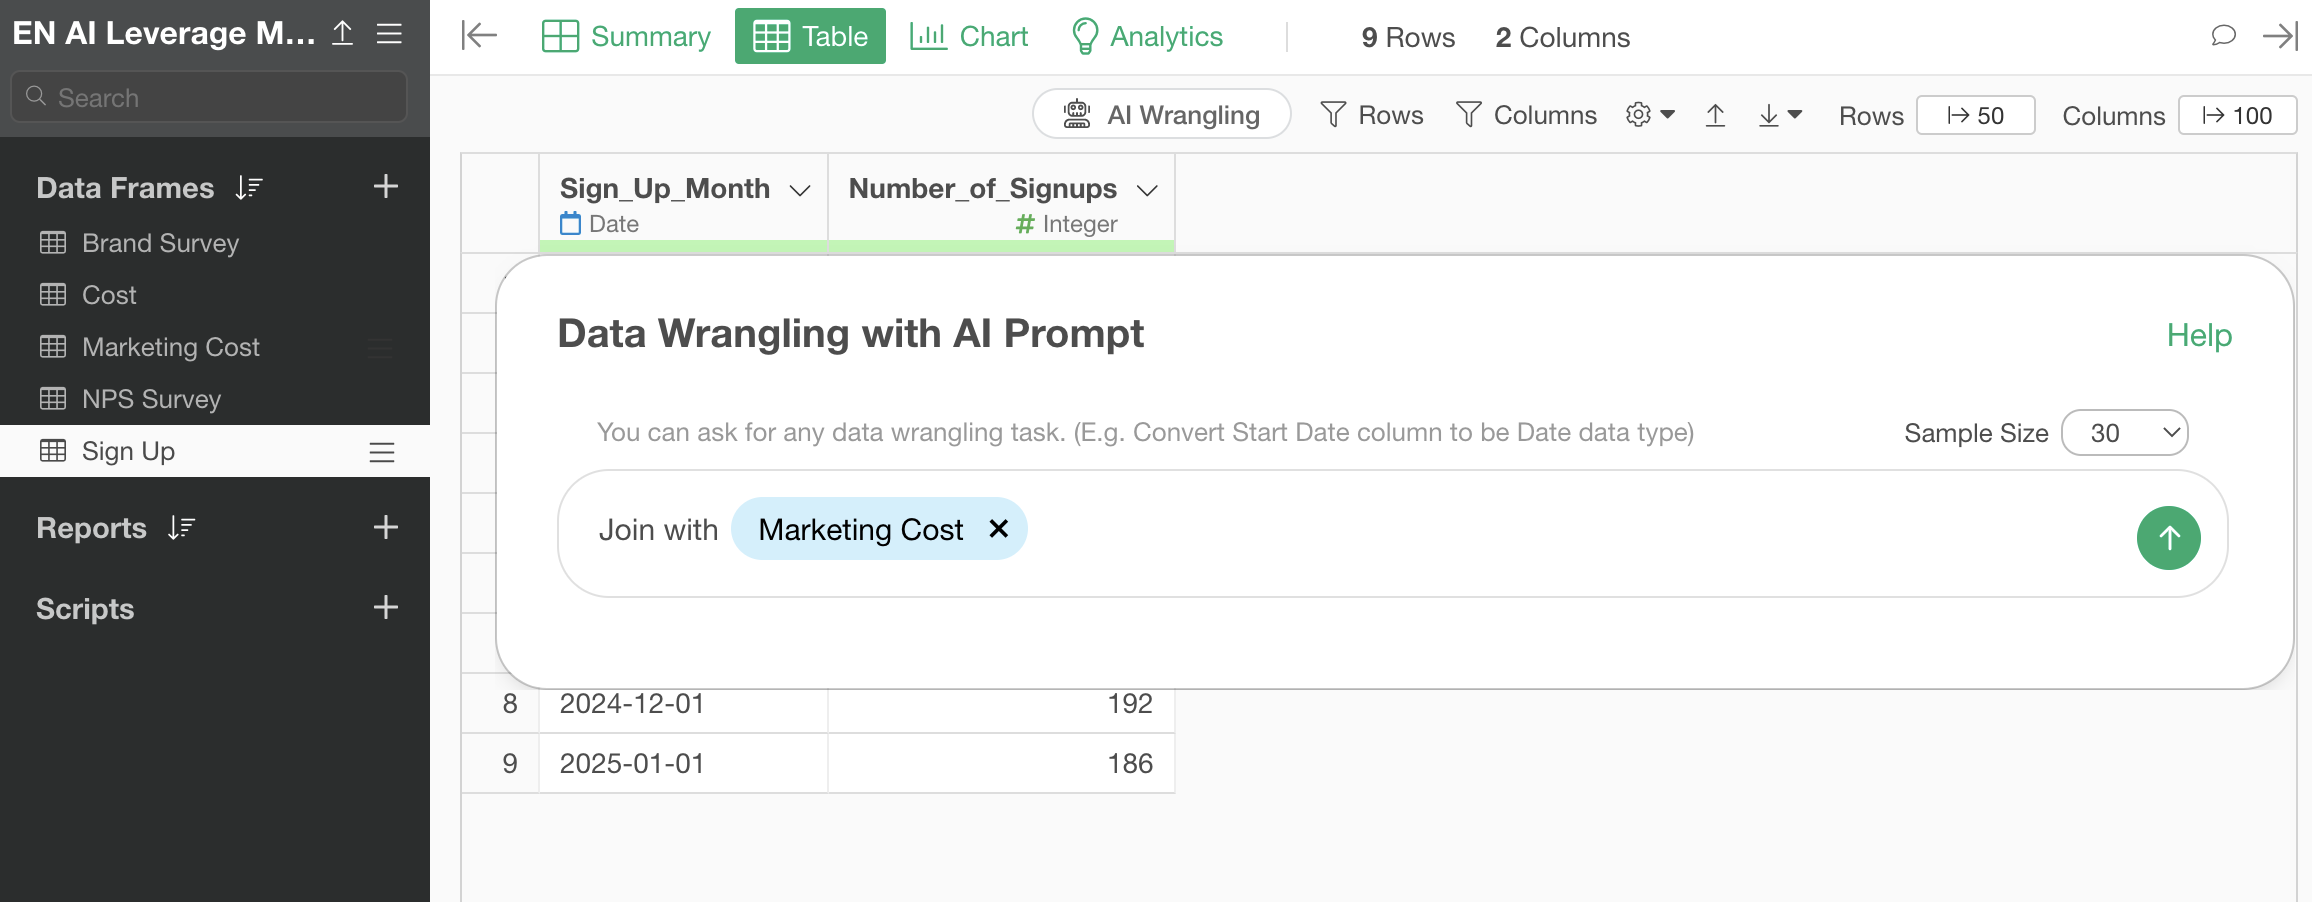
This will generate R codes to join the two sets of data, so run them.
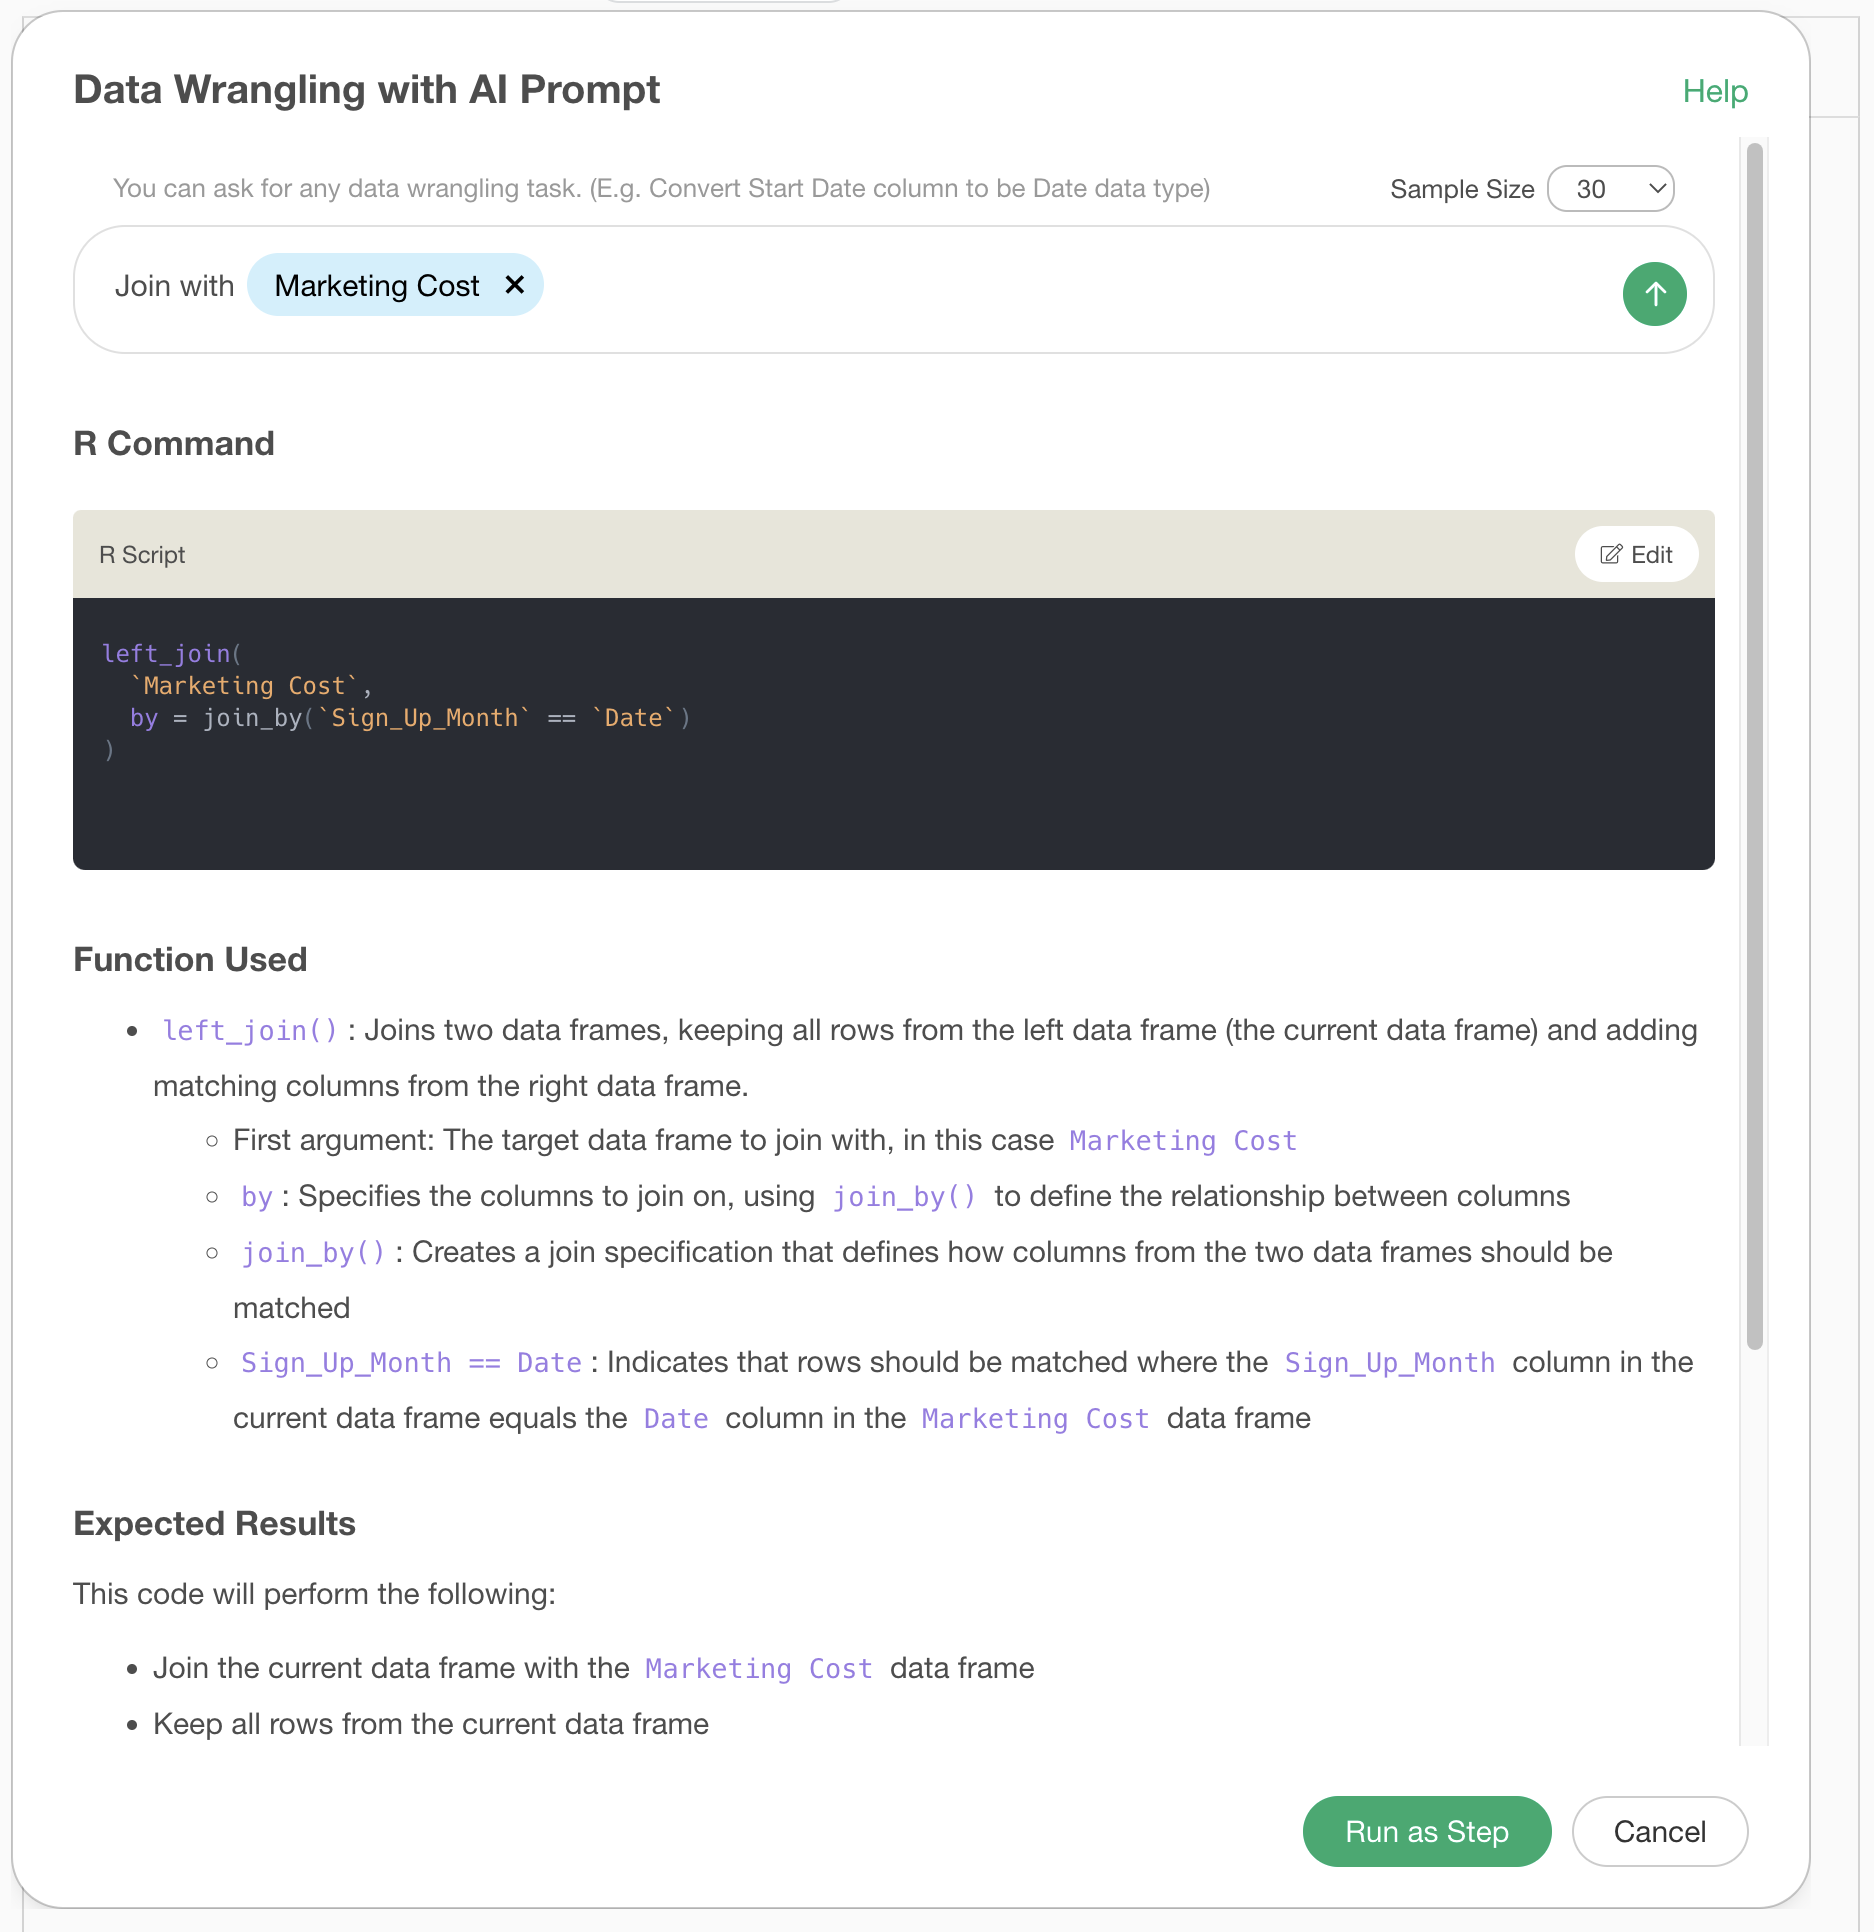
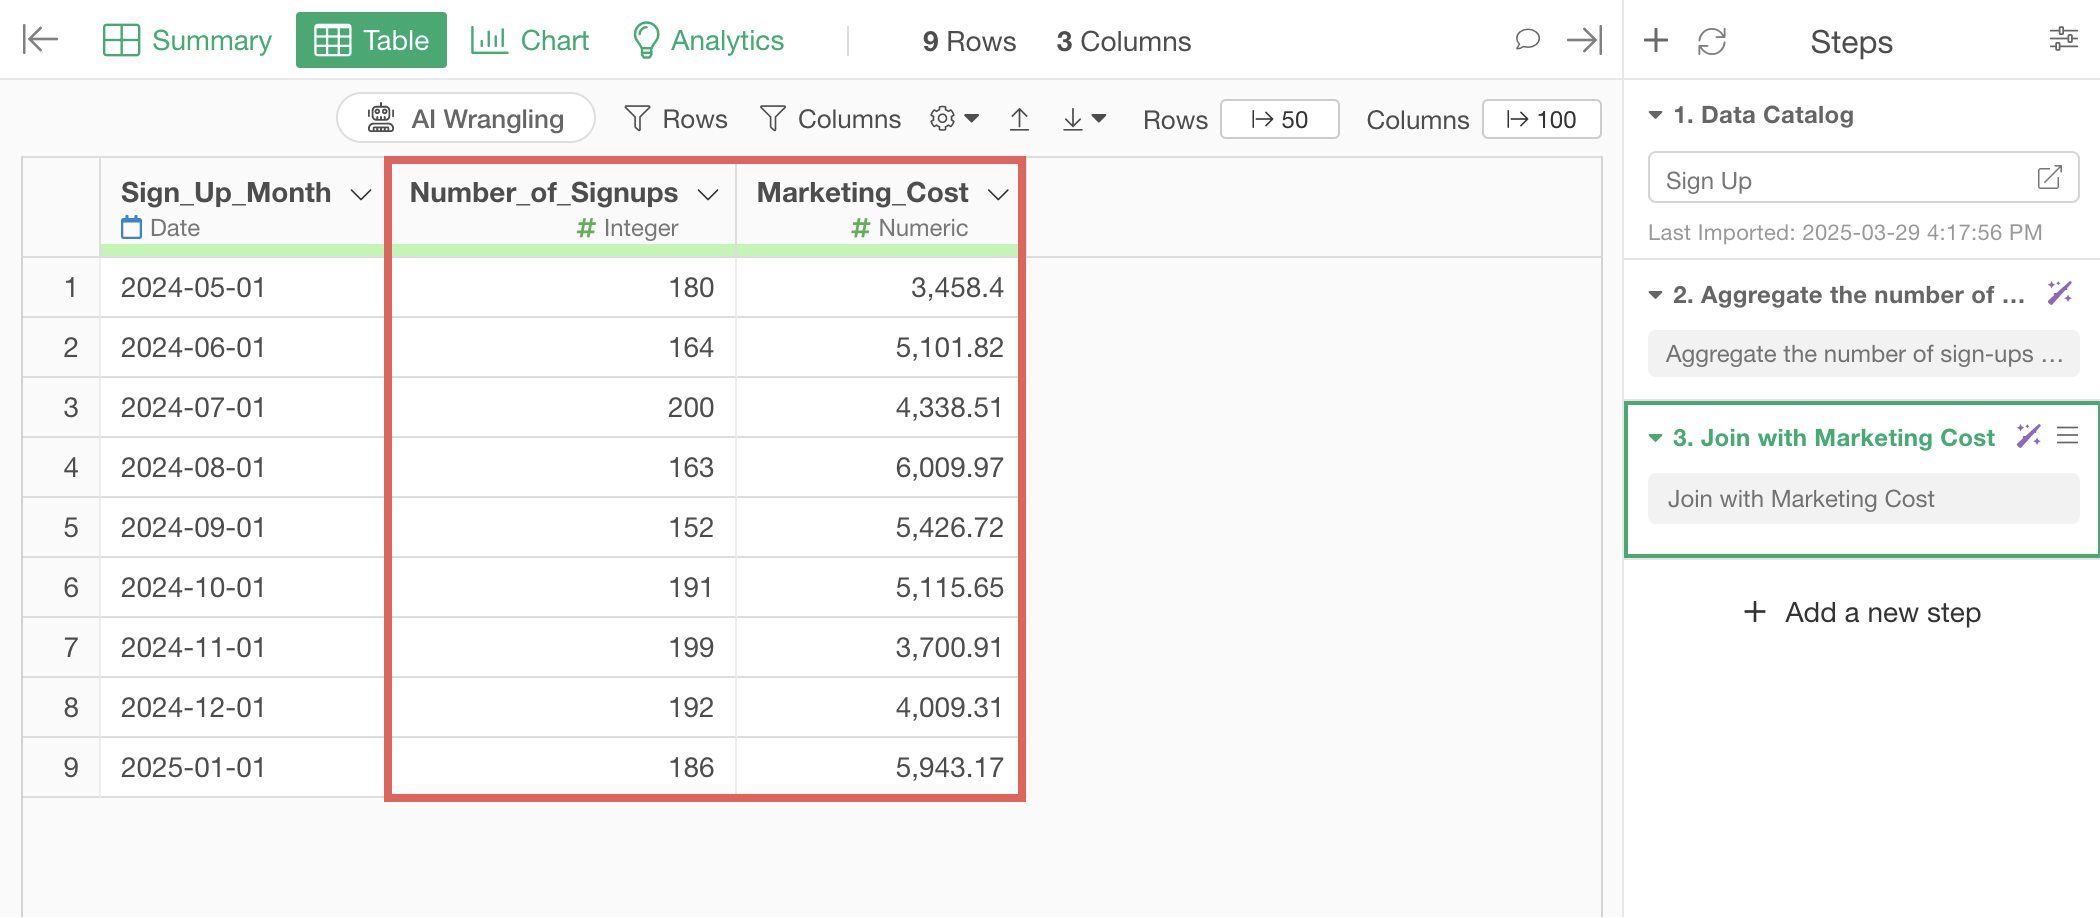
This allows you to combine the “number of sign-ups” and “marketing costs” necessary for CPA calculation into one data frame.
3. Calculating CPA
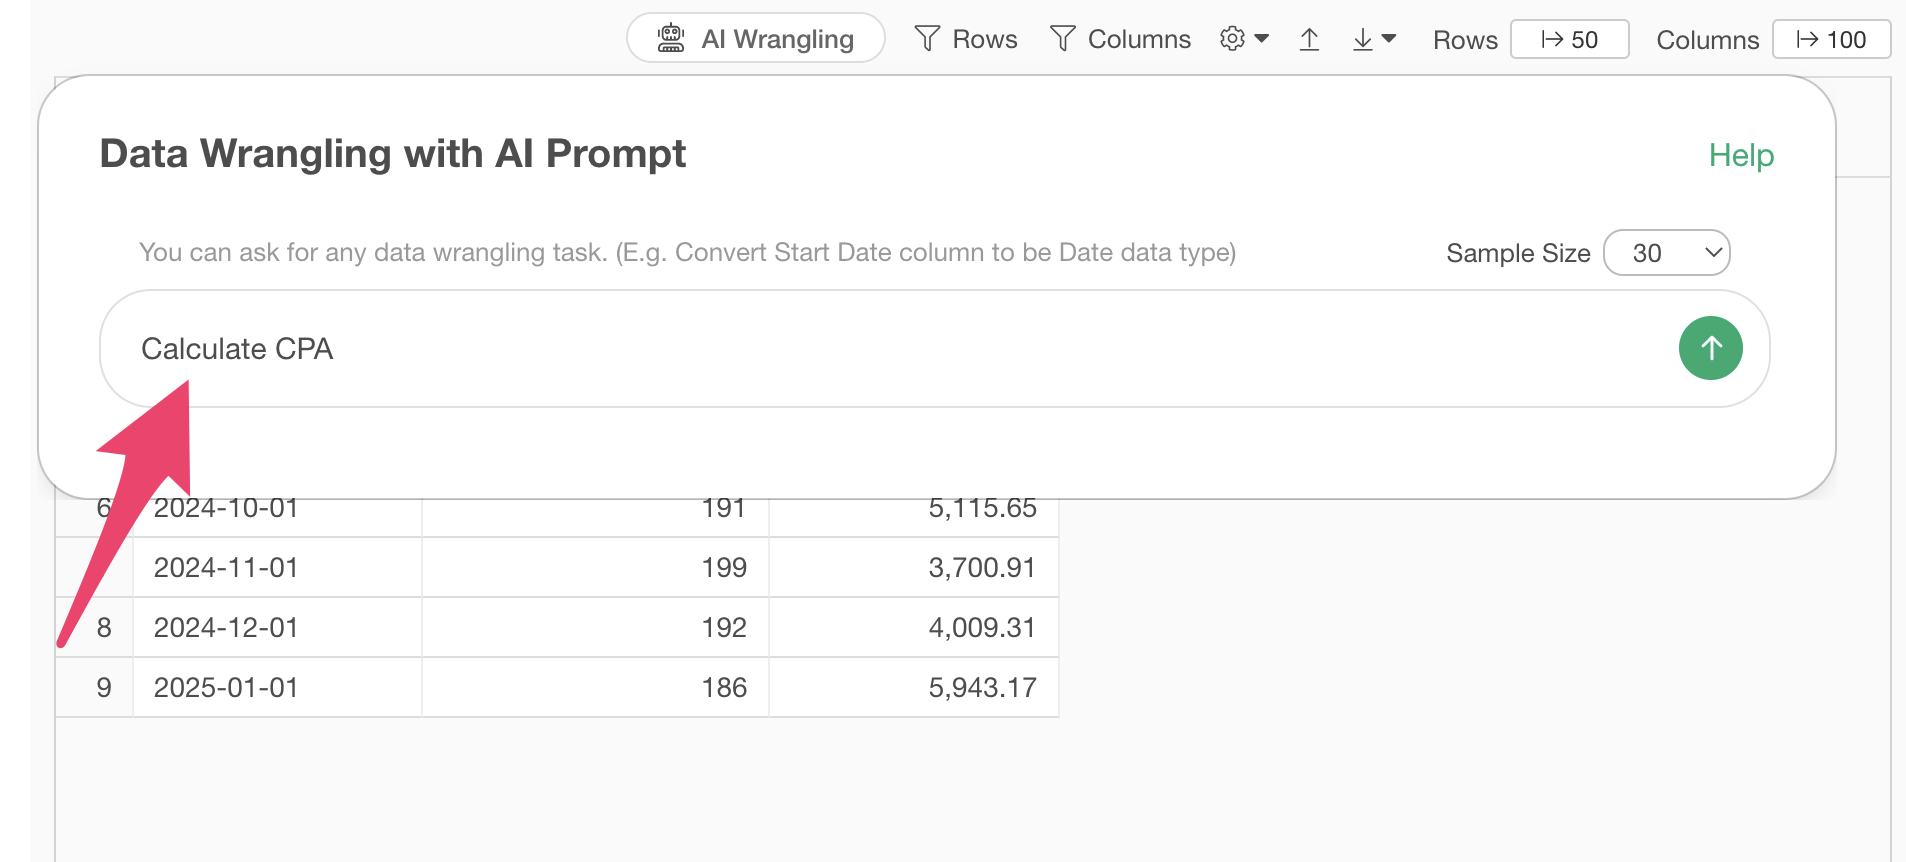
All that’s left is to calculate CPA. Display the AI prompt window again, enter the following text, and execute.
Calculate CPA
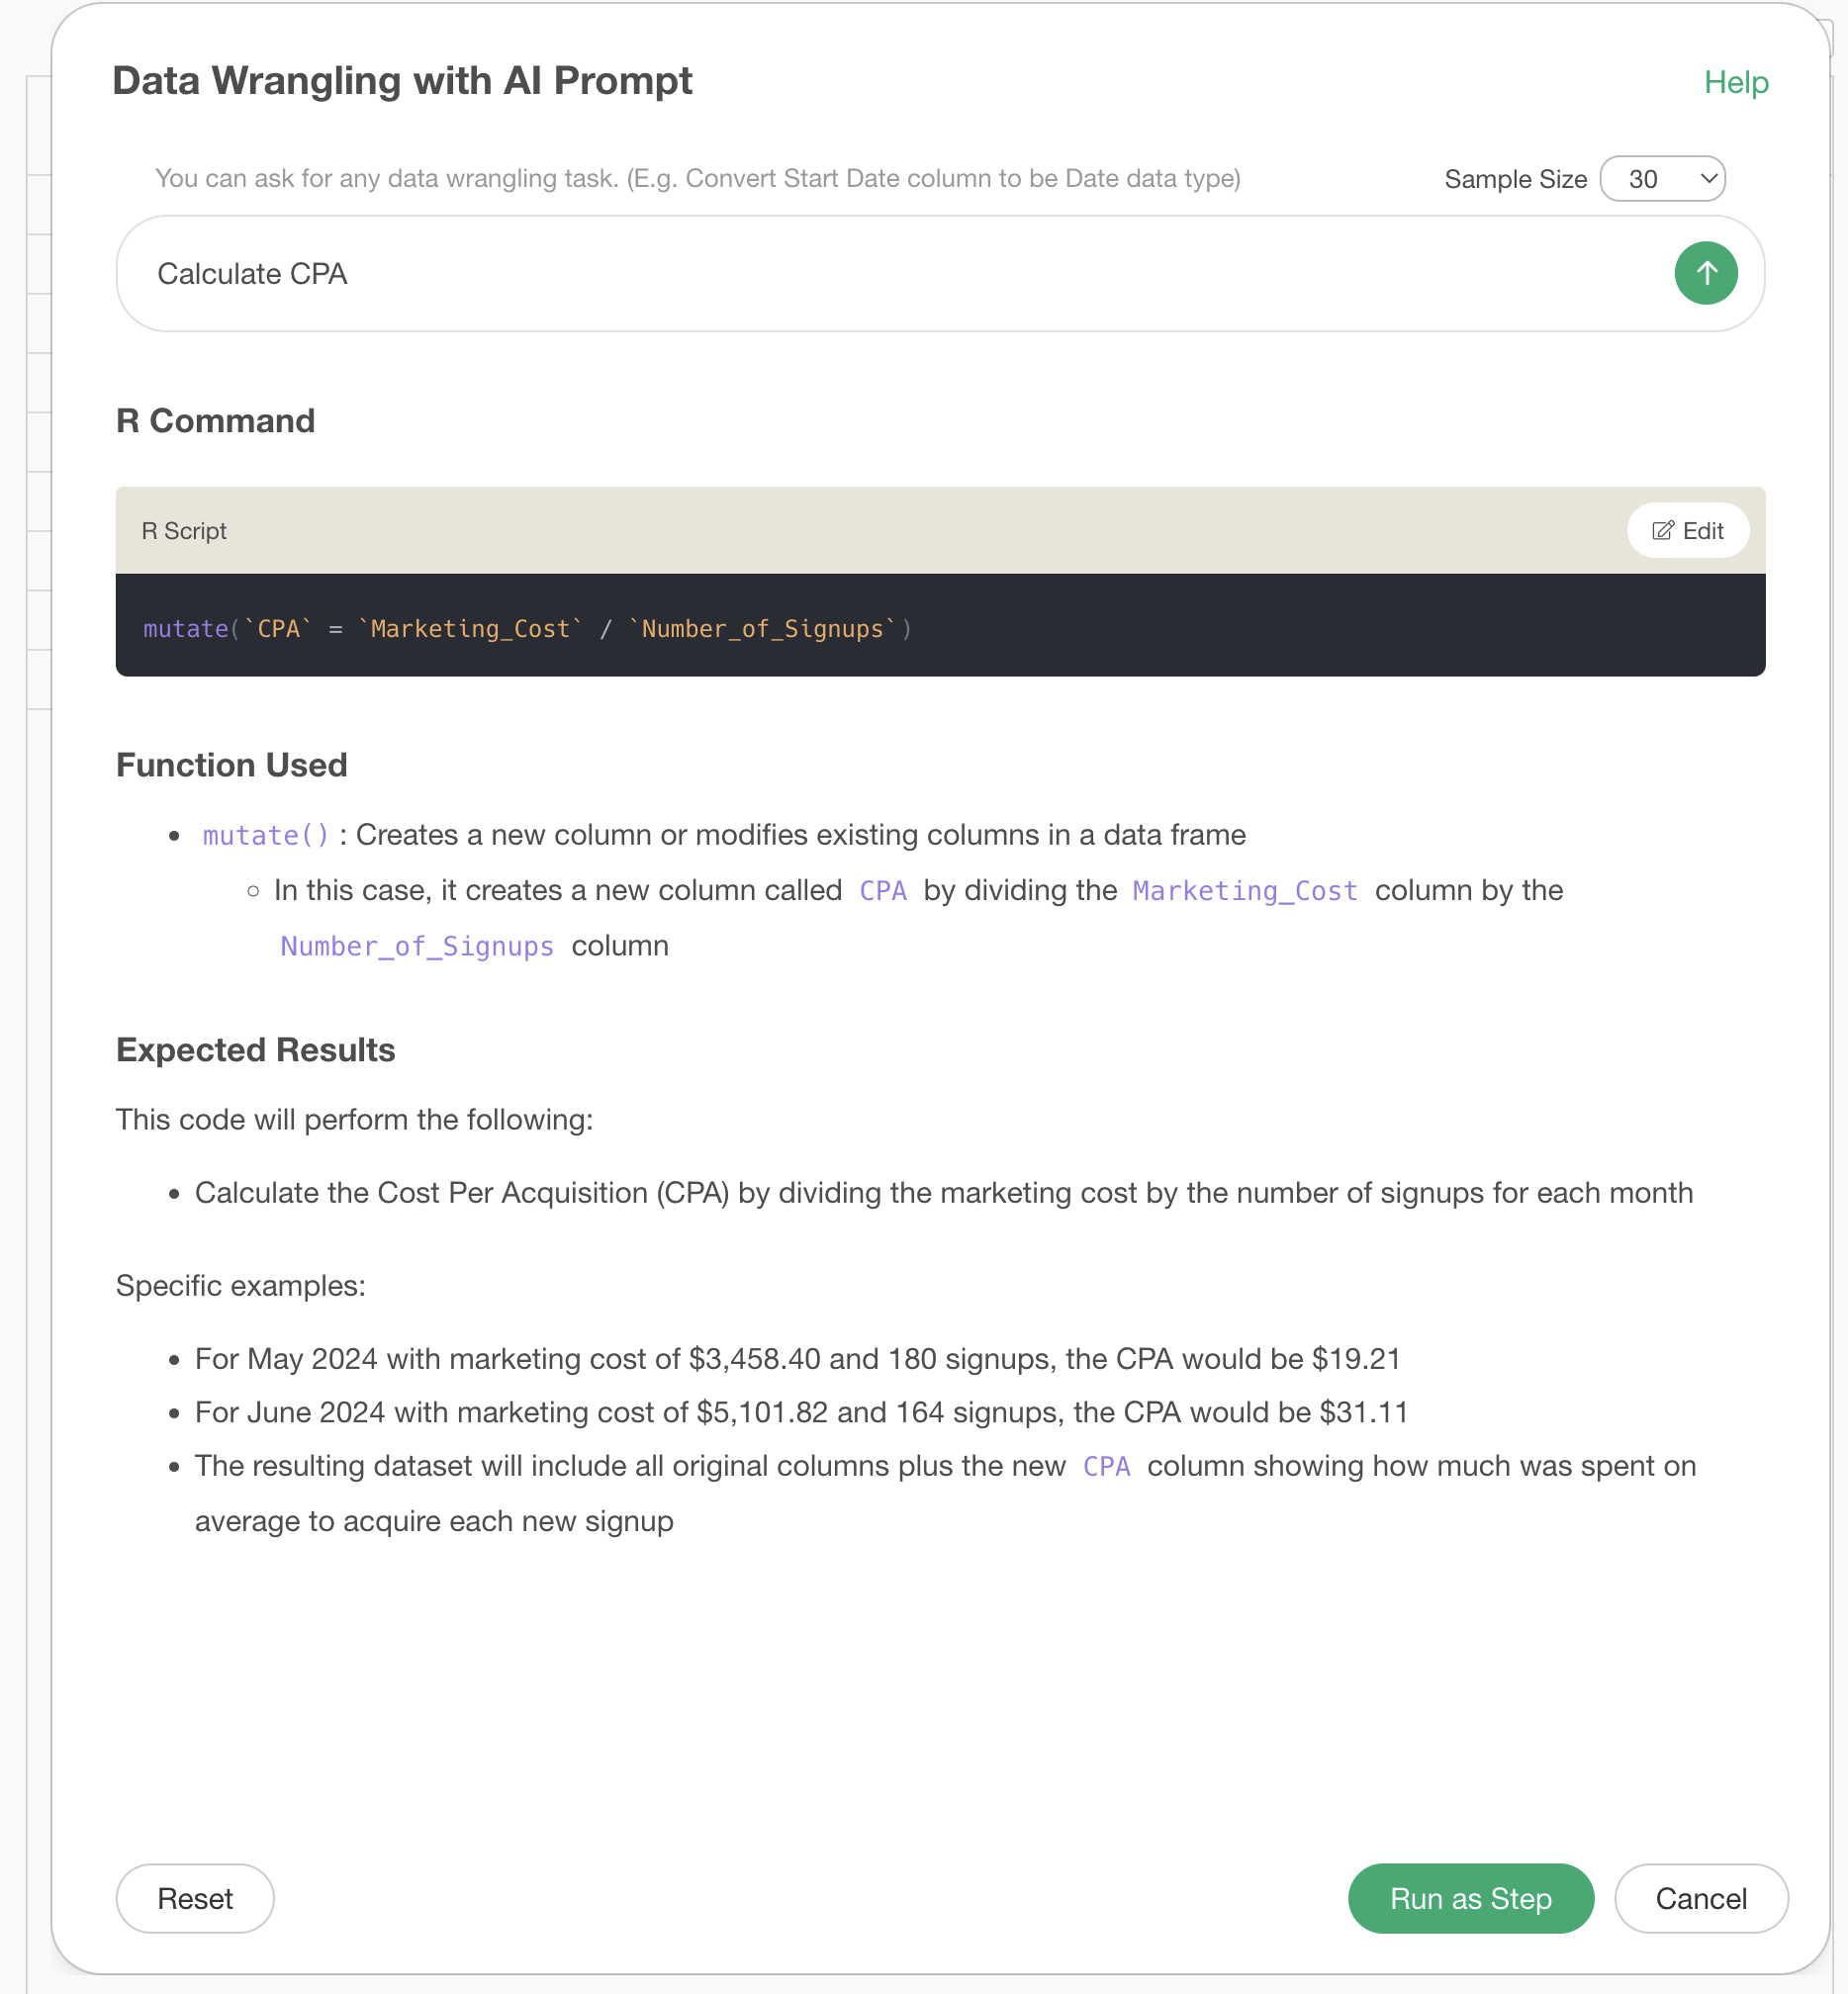
This will generate R codes to calculate CPA, so run them.
This calculates CPA.
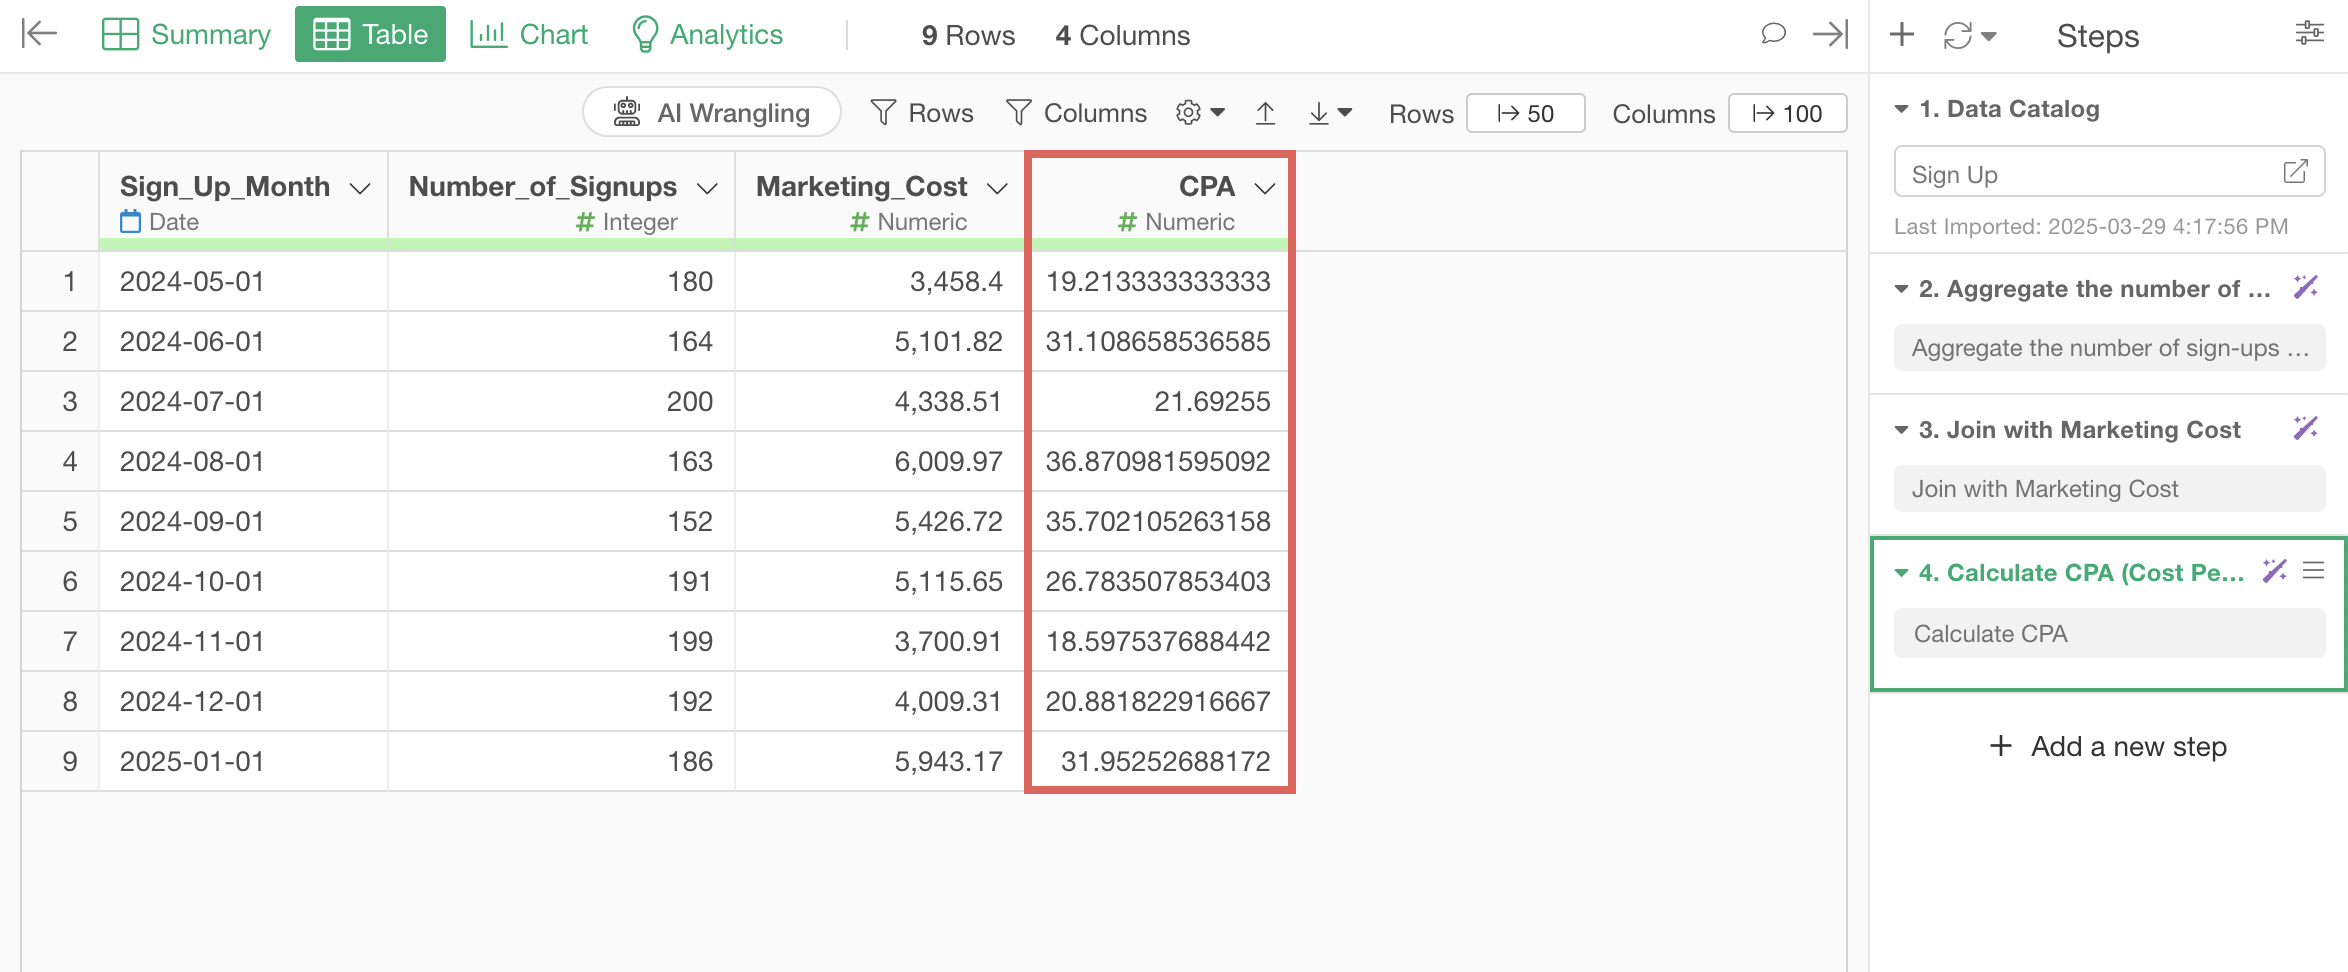
In this way, even for metrics that need to be calculated in combination with multiple data sets, you can easily create them by executing multiple prompts step by step.
3. Creating Brand Awareness Rate
The final pattern is where, once you’ve processed the data into the expected form, you can easily perform the final calculation in the chart.
Let’s look at how to create a Brand Awareness Rate, which is an indicator of how well-known your brand or product is.
Values that can be expressed in binary, like brand awareness, such as “whether one recalls one’s own brand or product when thinking about a certain product,” can be represented in a data type called logical type that only takes TRUE or FALSE values.

And by converting string-type data that expresses whether or not a brand is recognized as “Yes” or “No” to logical type, you can easily calculate the proportion of “TRUE” (brand awareness rate).
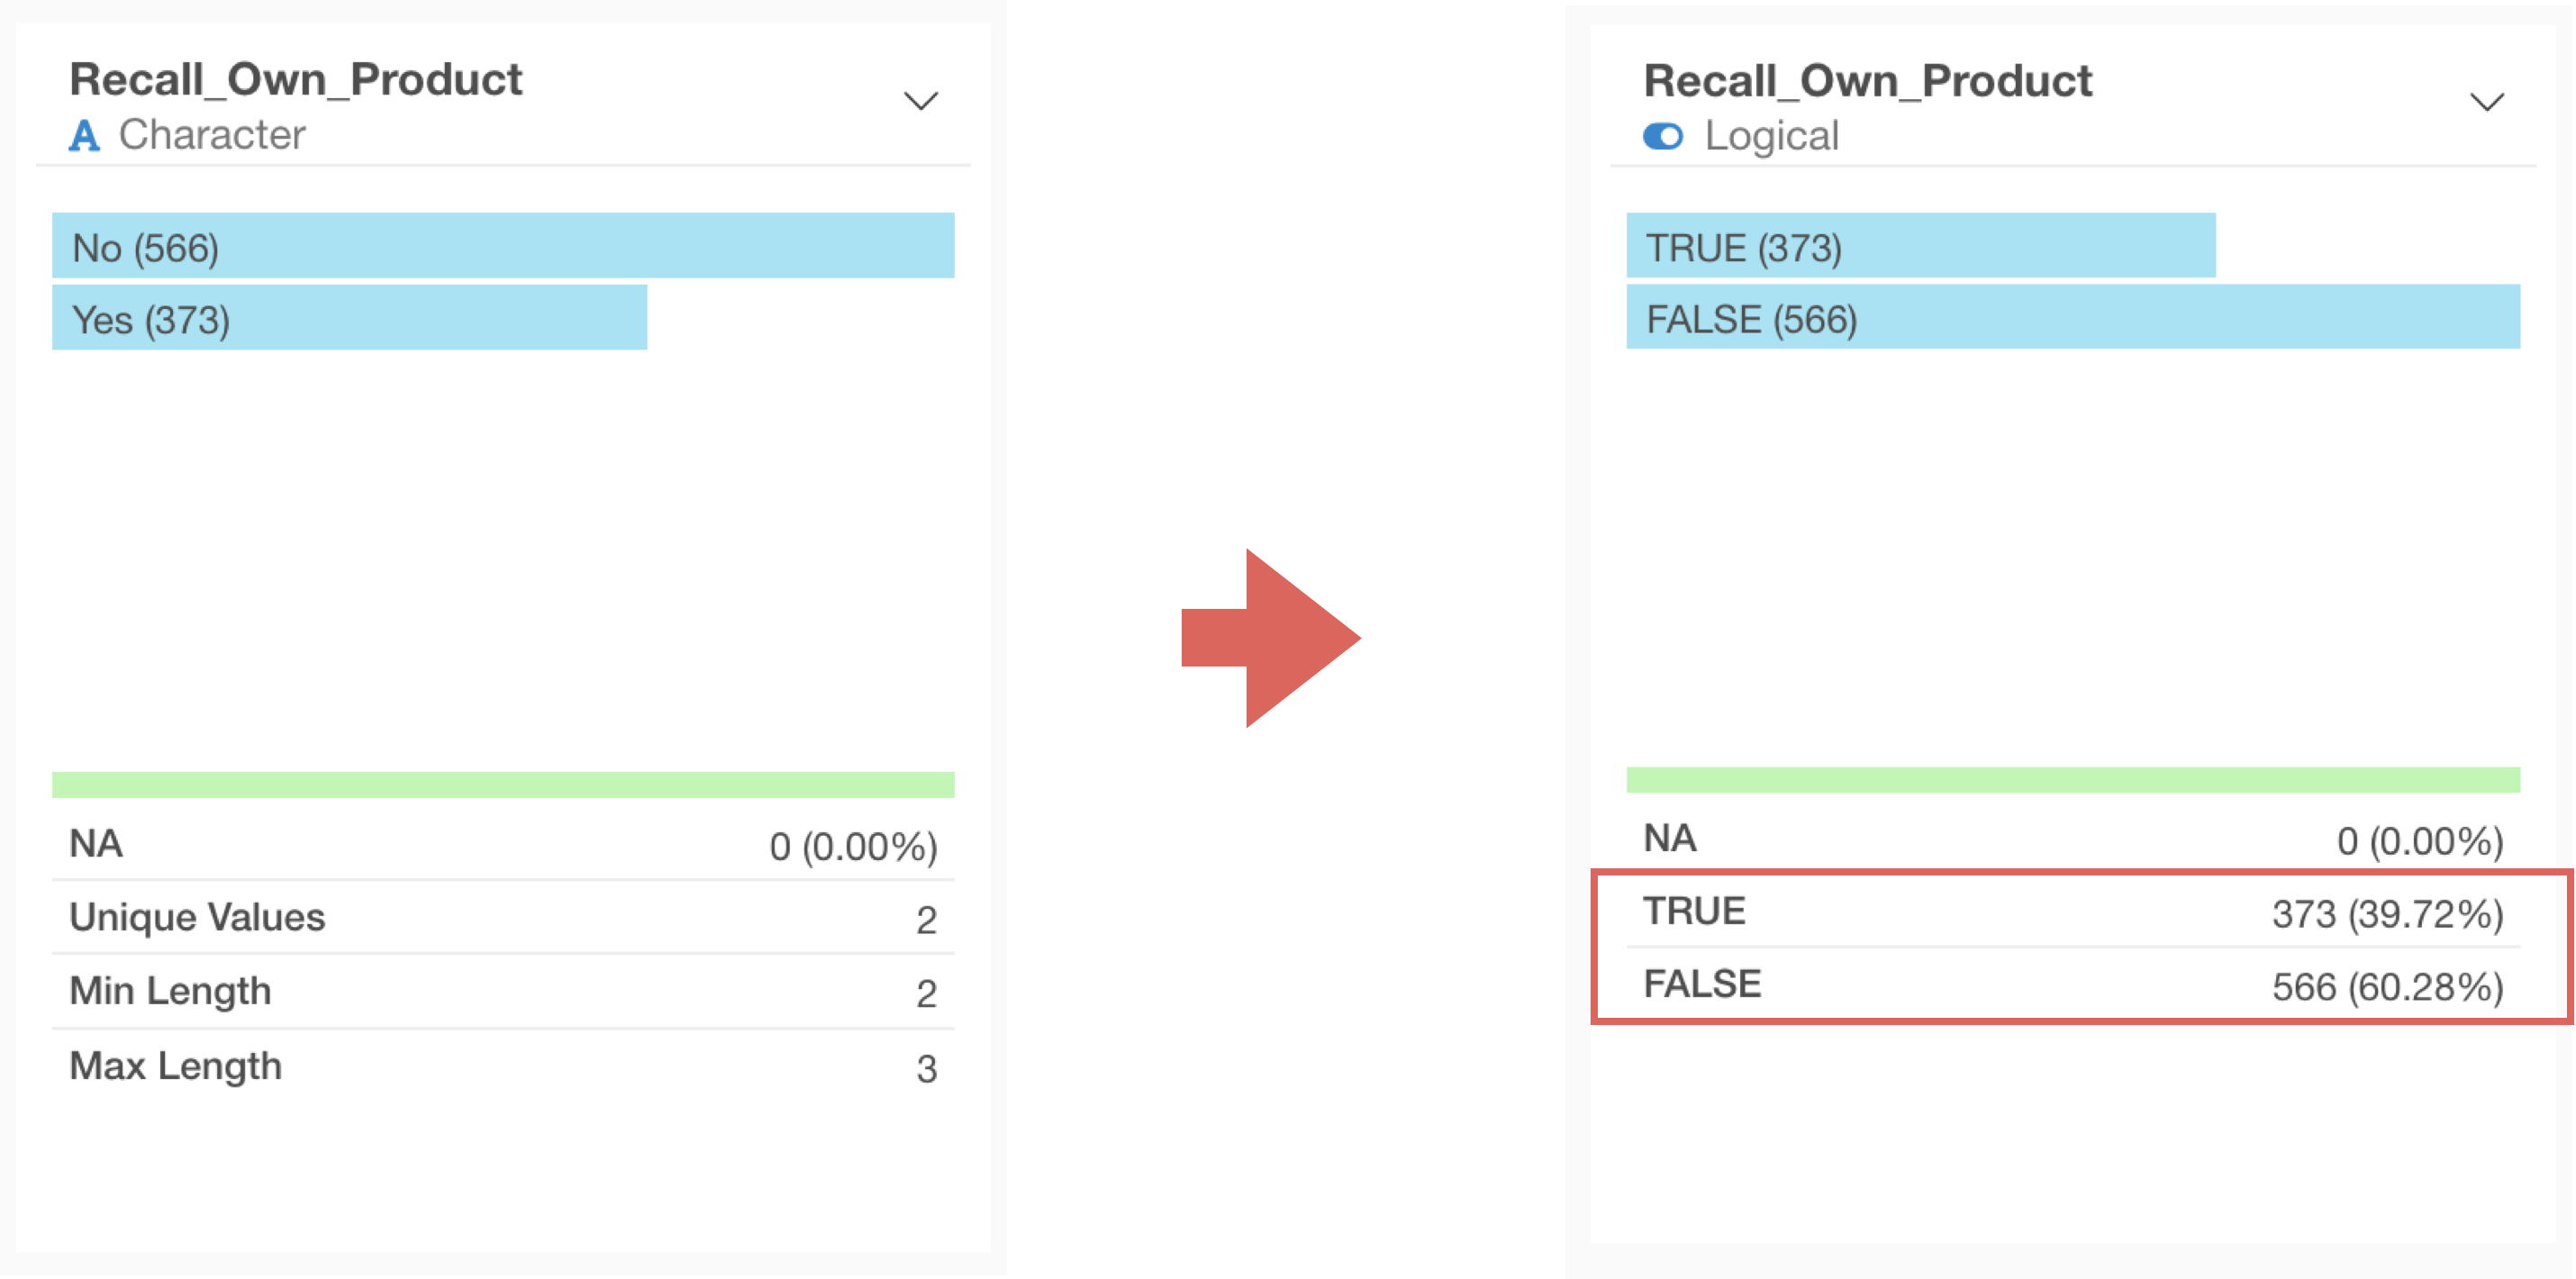
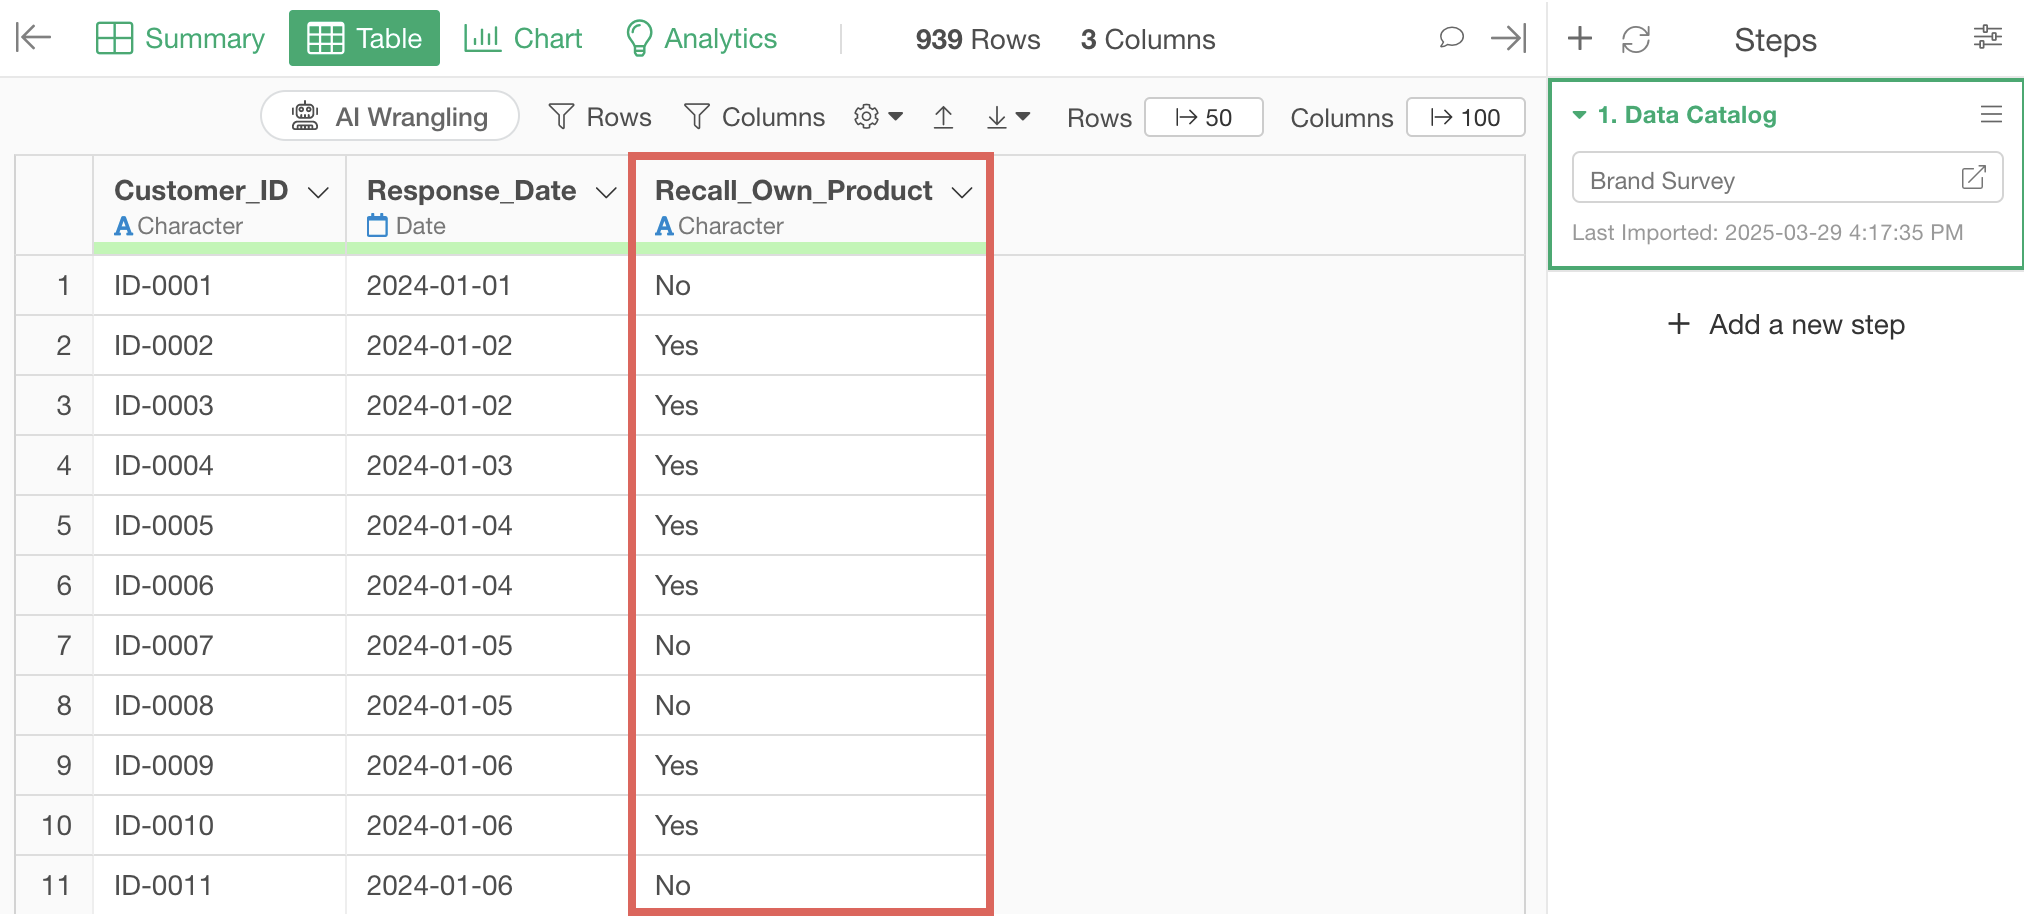
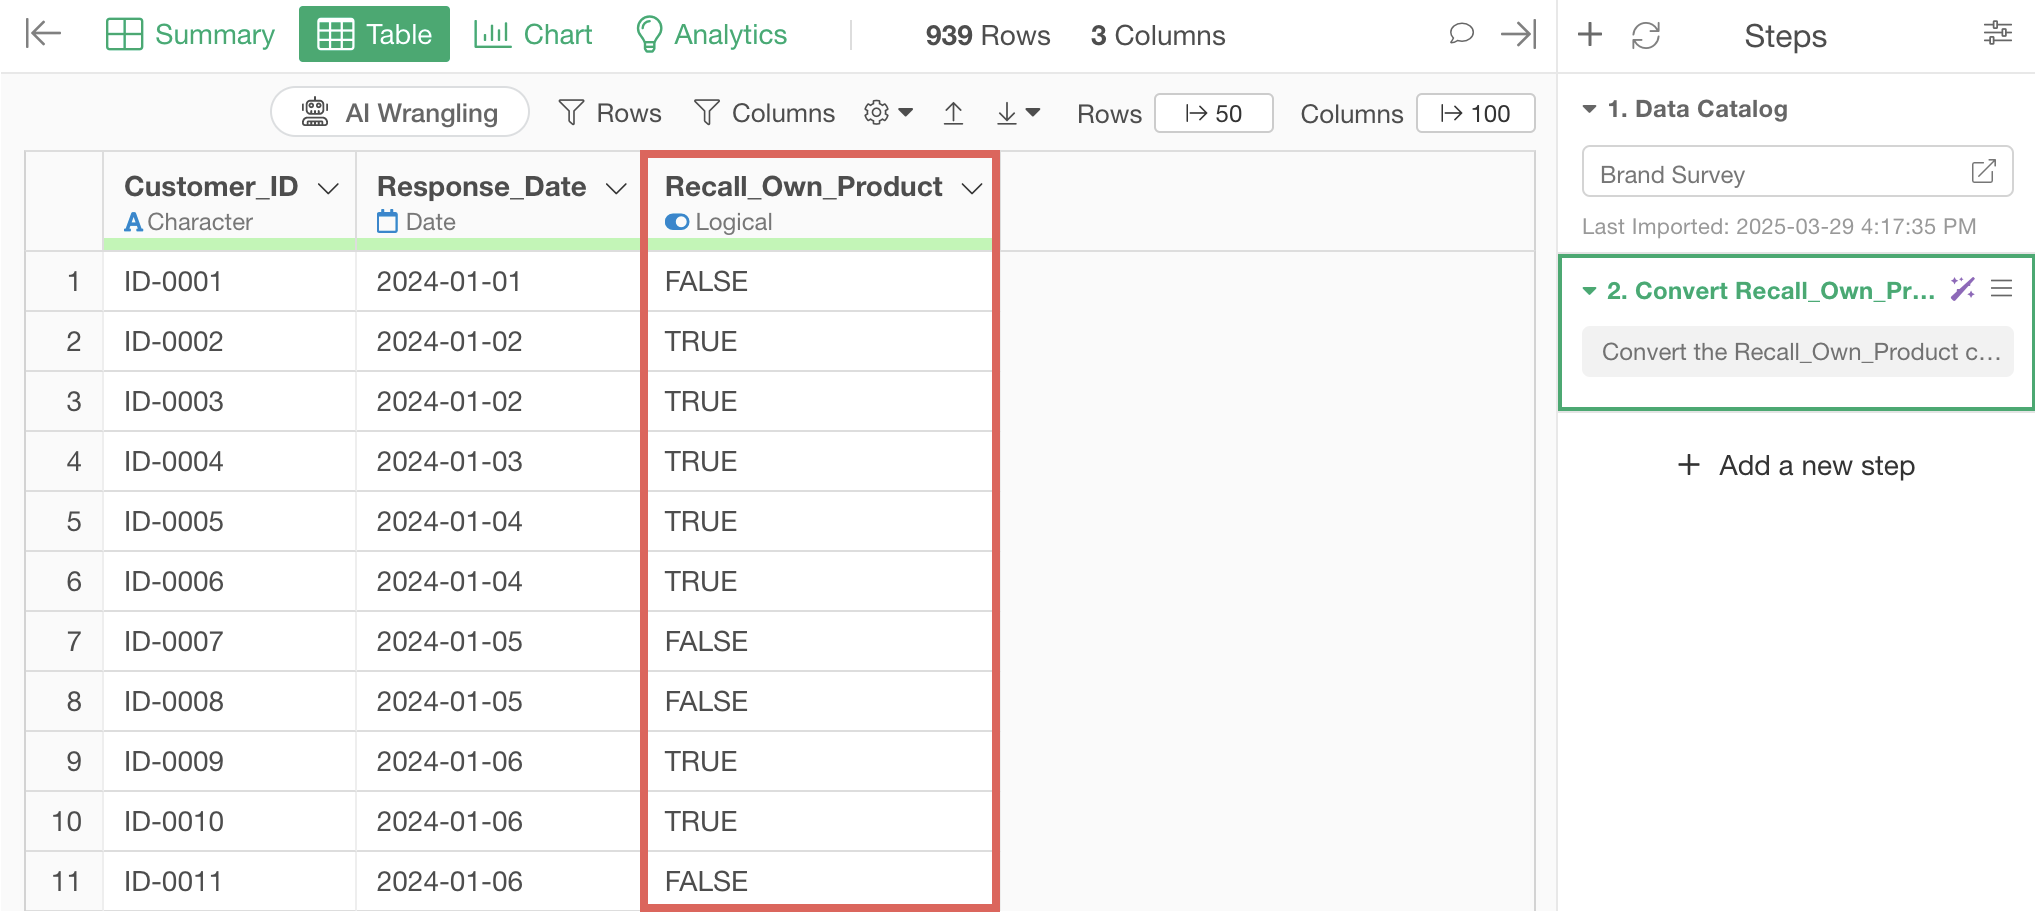
For example, if you have data where each row represents one brand survey response, and whether they recalled your product is stored as “Yes” or “No”, you can easily convert it to logical type using AI prompts. (You can download the sample data used this time from here.)
Open the AI prompt window, enter the following text, and execute.
Convert the “Recall_Own_Product” column to logical type
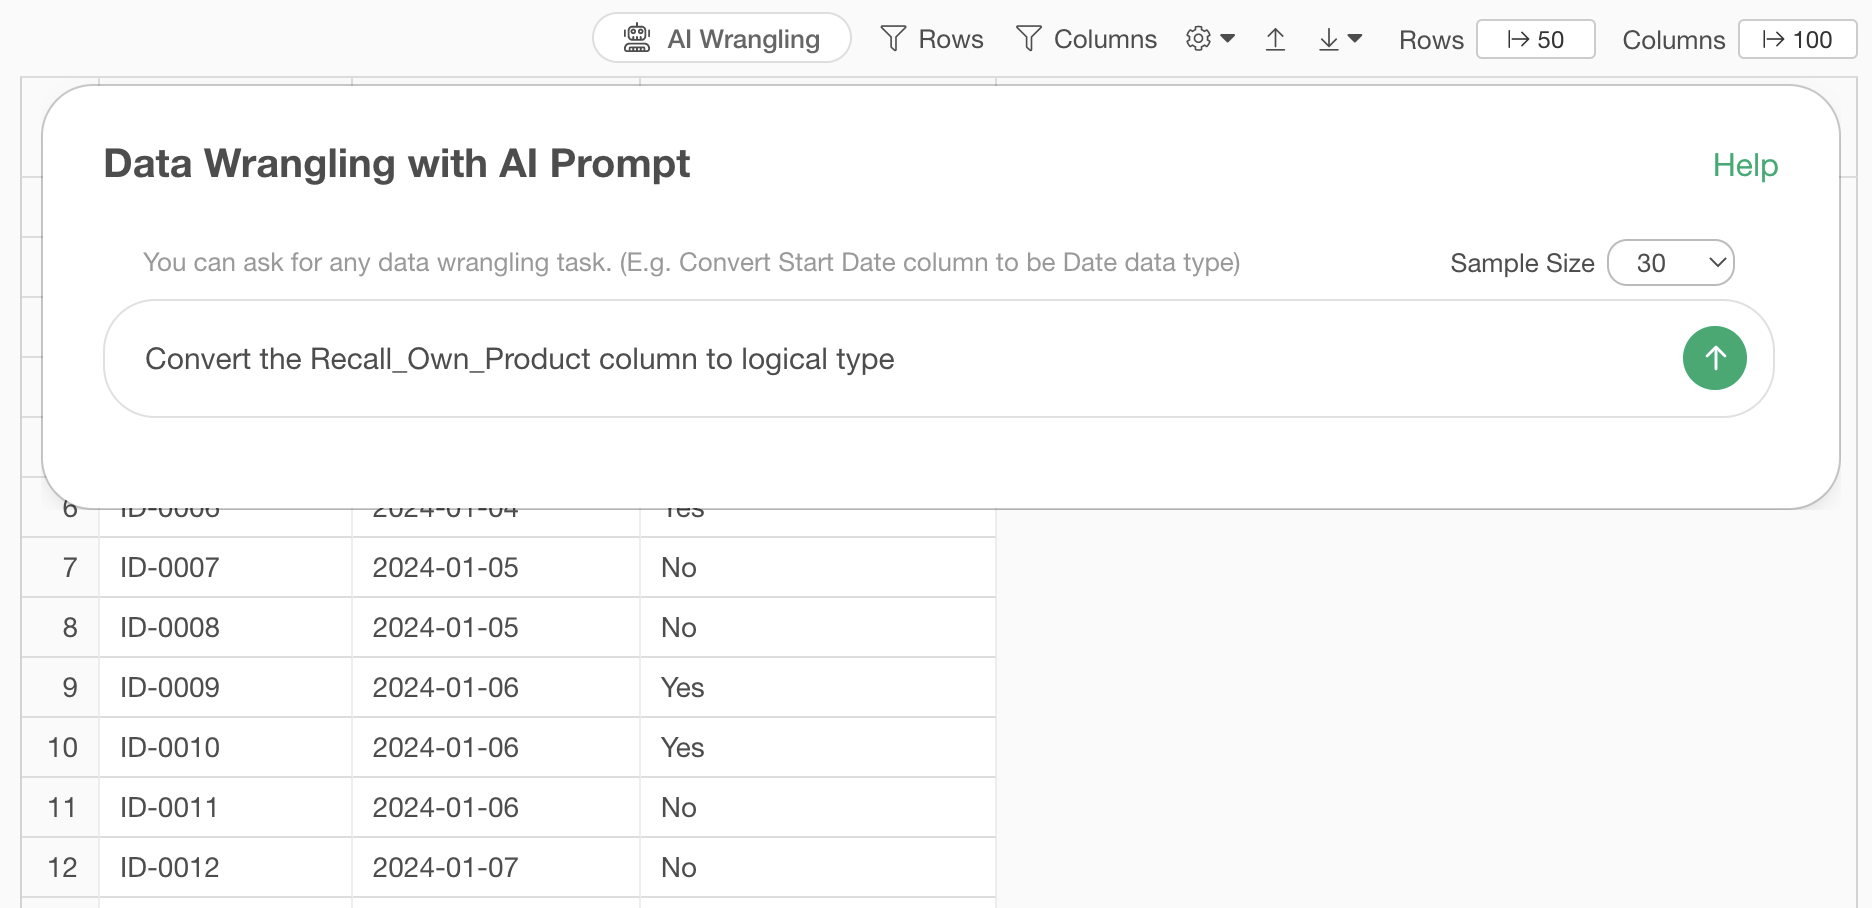
This will display the result for converting to logical type, so run it.
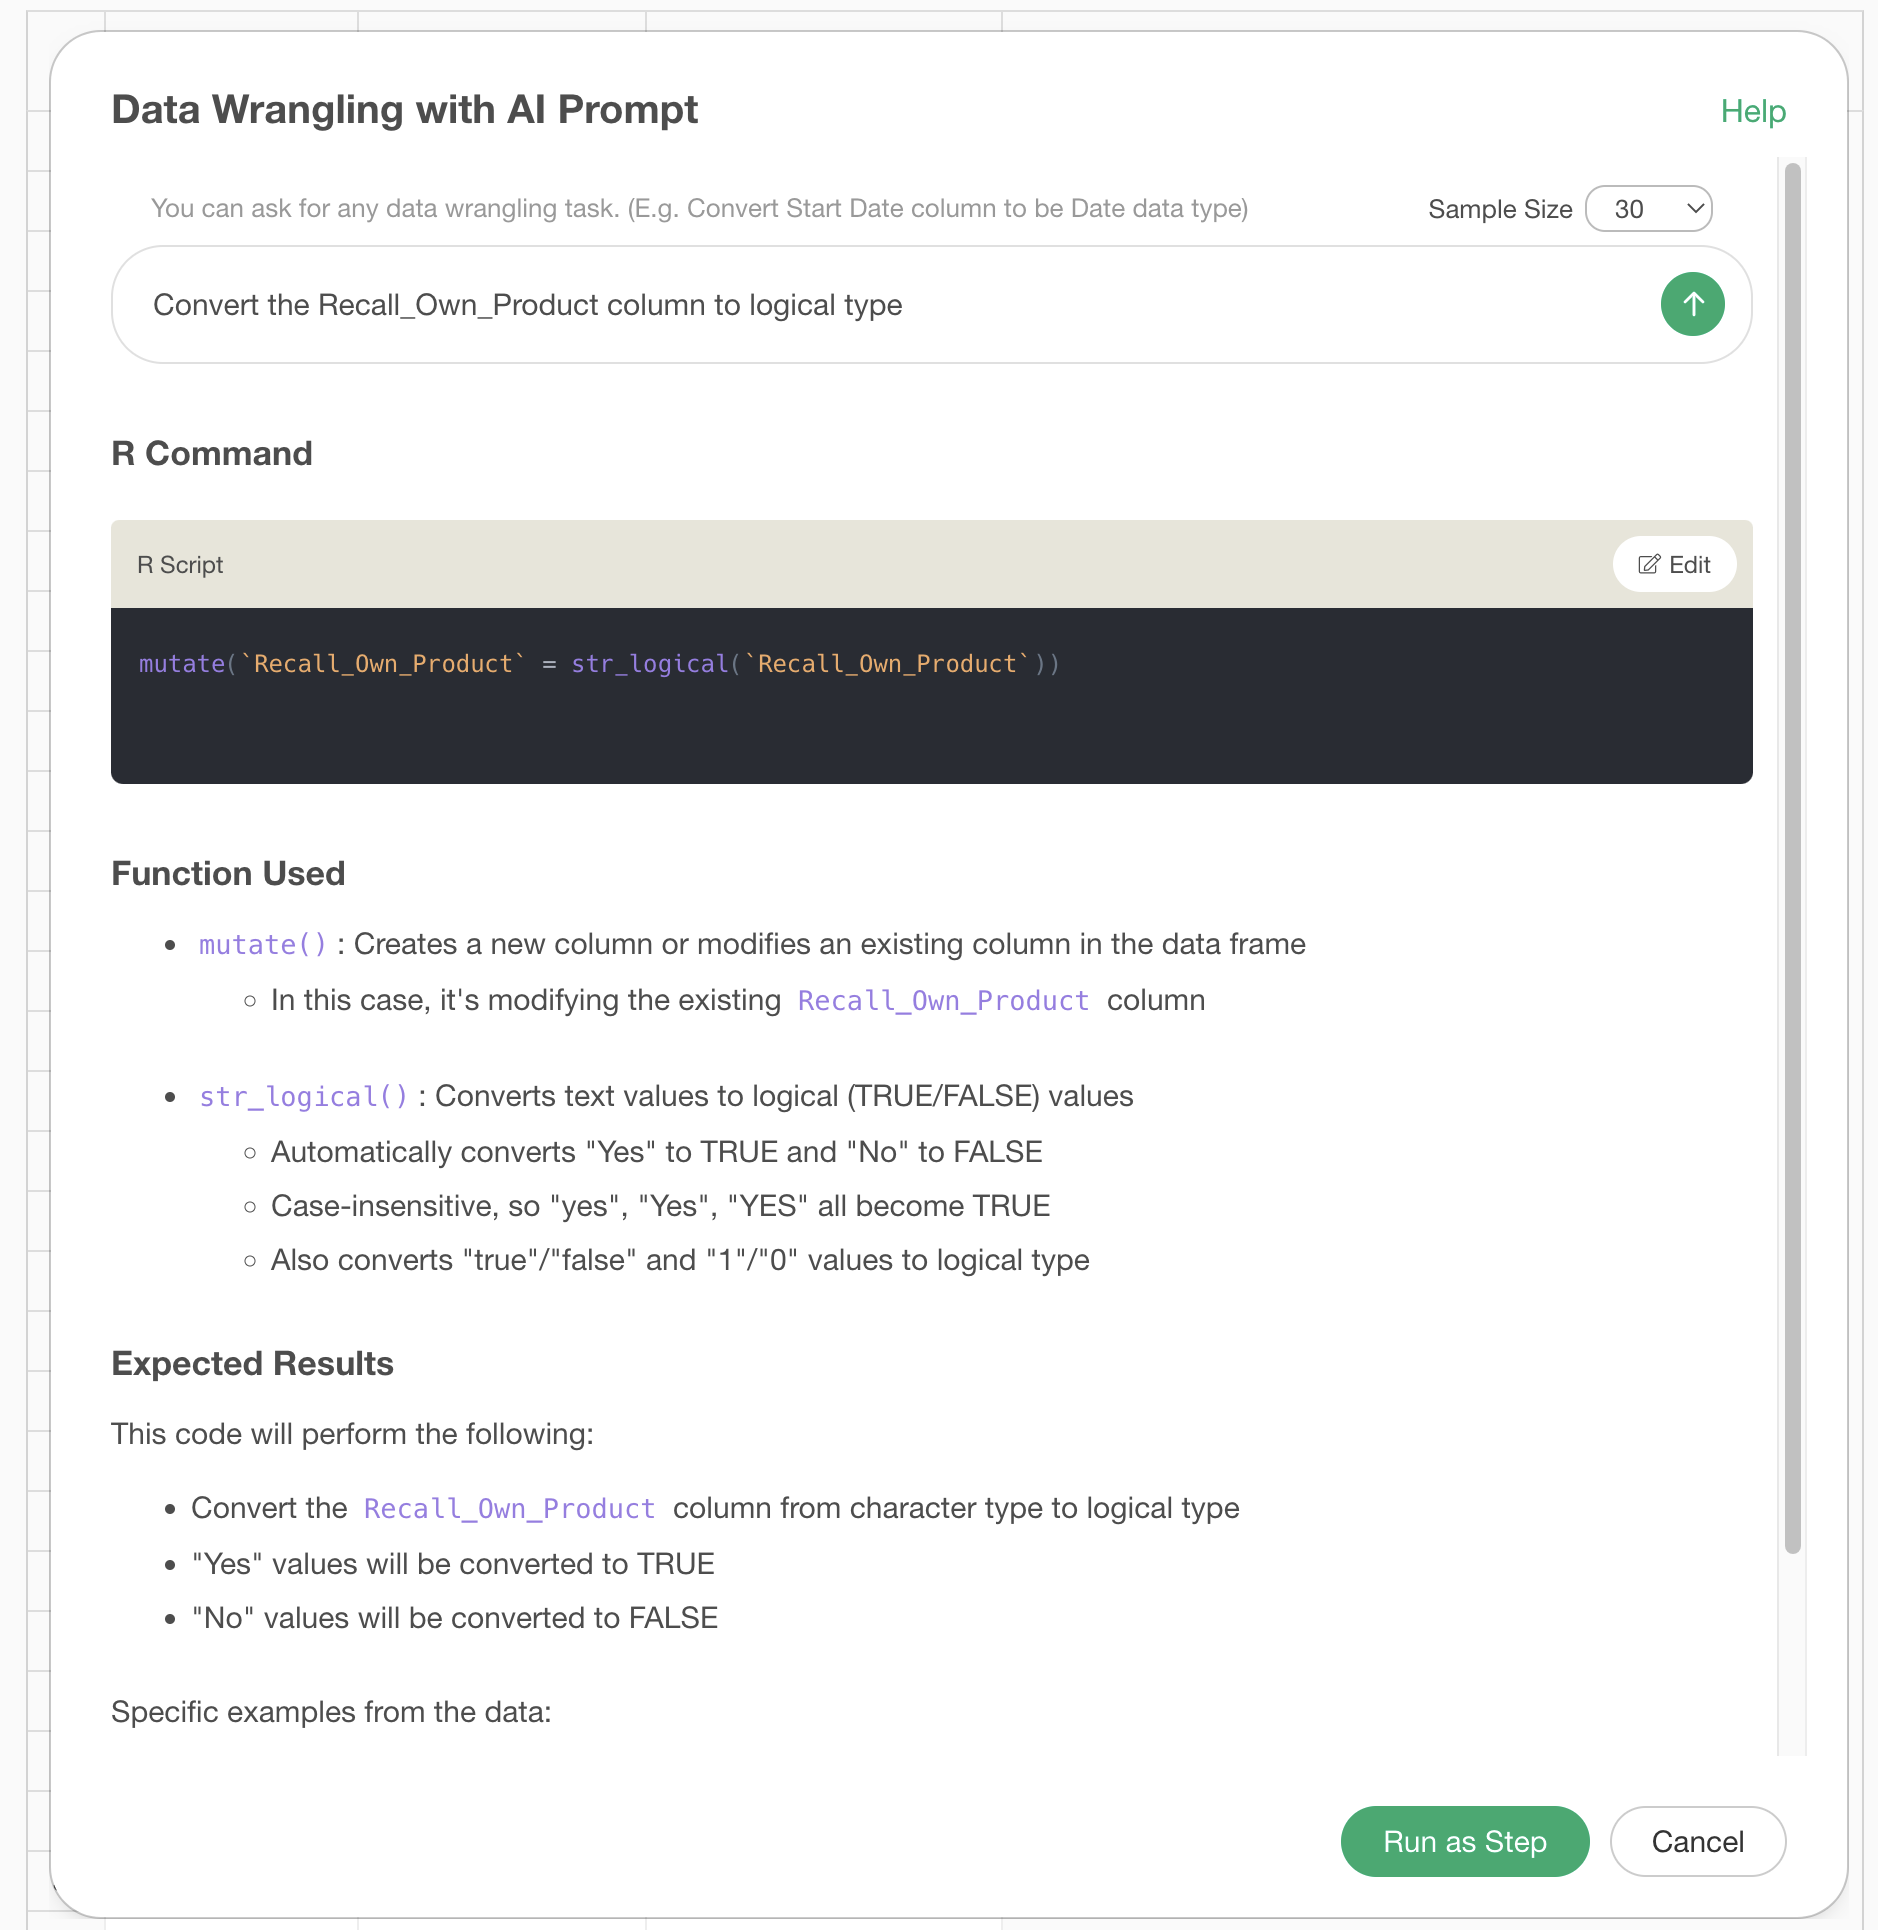
This converts the “Recall_Own_Product” column to logical type.
Once the data is prepared in this way, you can then calculate the brand awareness rate or visualize its trend in the Chart view.
Move to the Chart view and calculate the proportion of TRUE in the “Recall_Own_Product” column by month to visualize the trend of brand awareness rate by month.
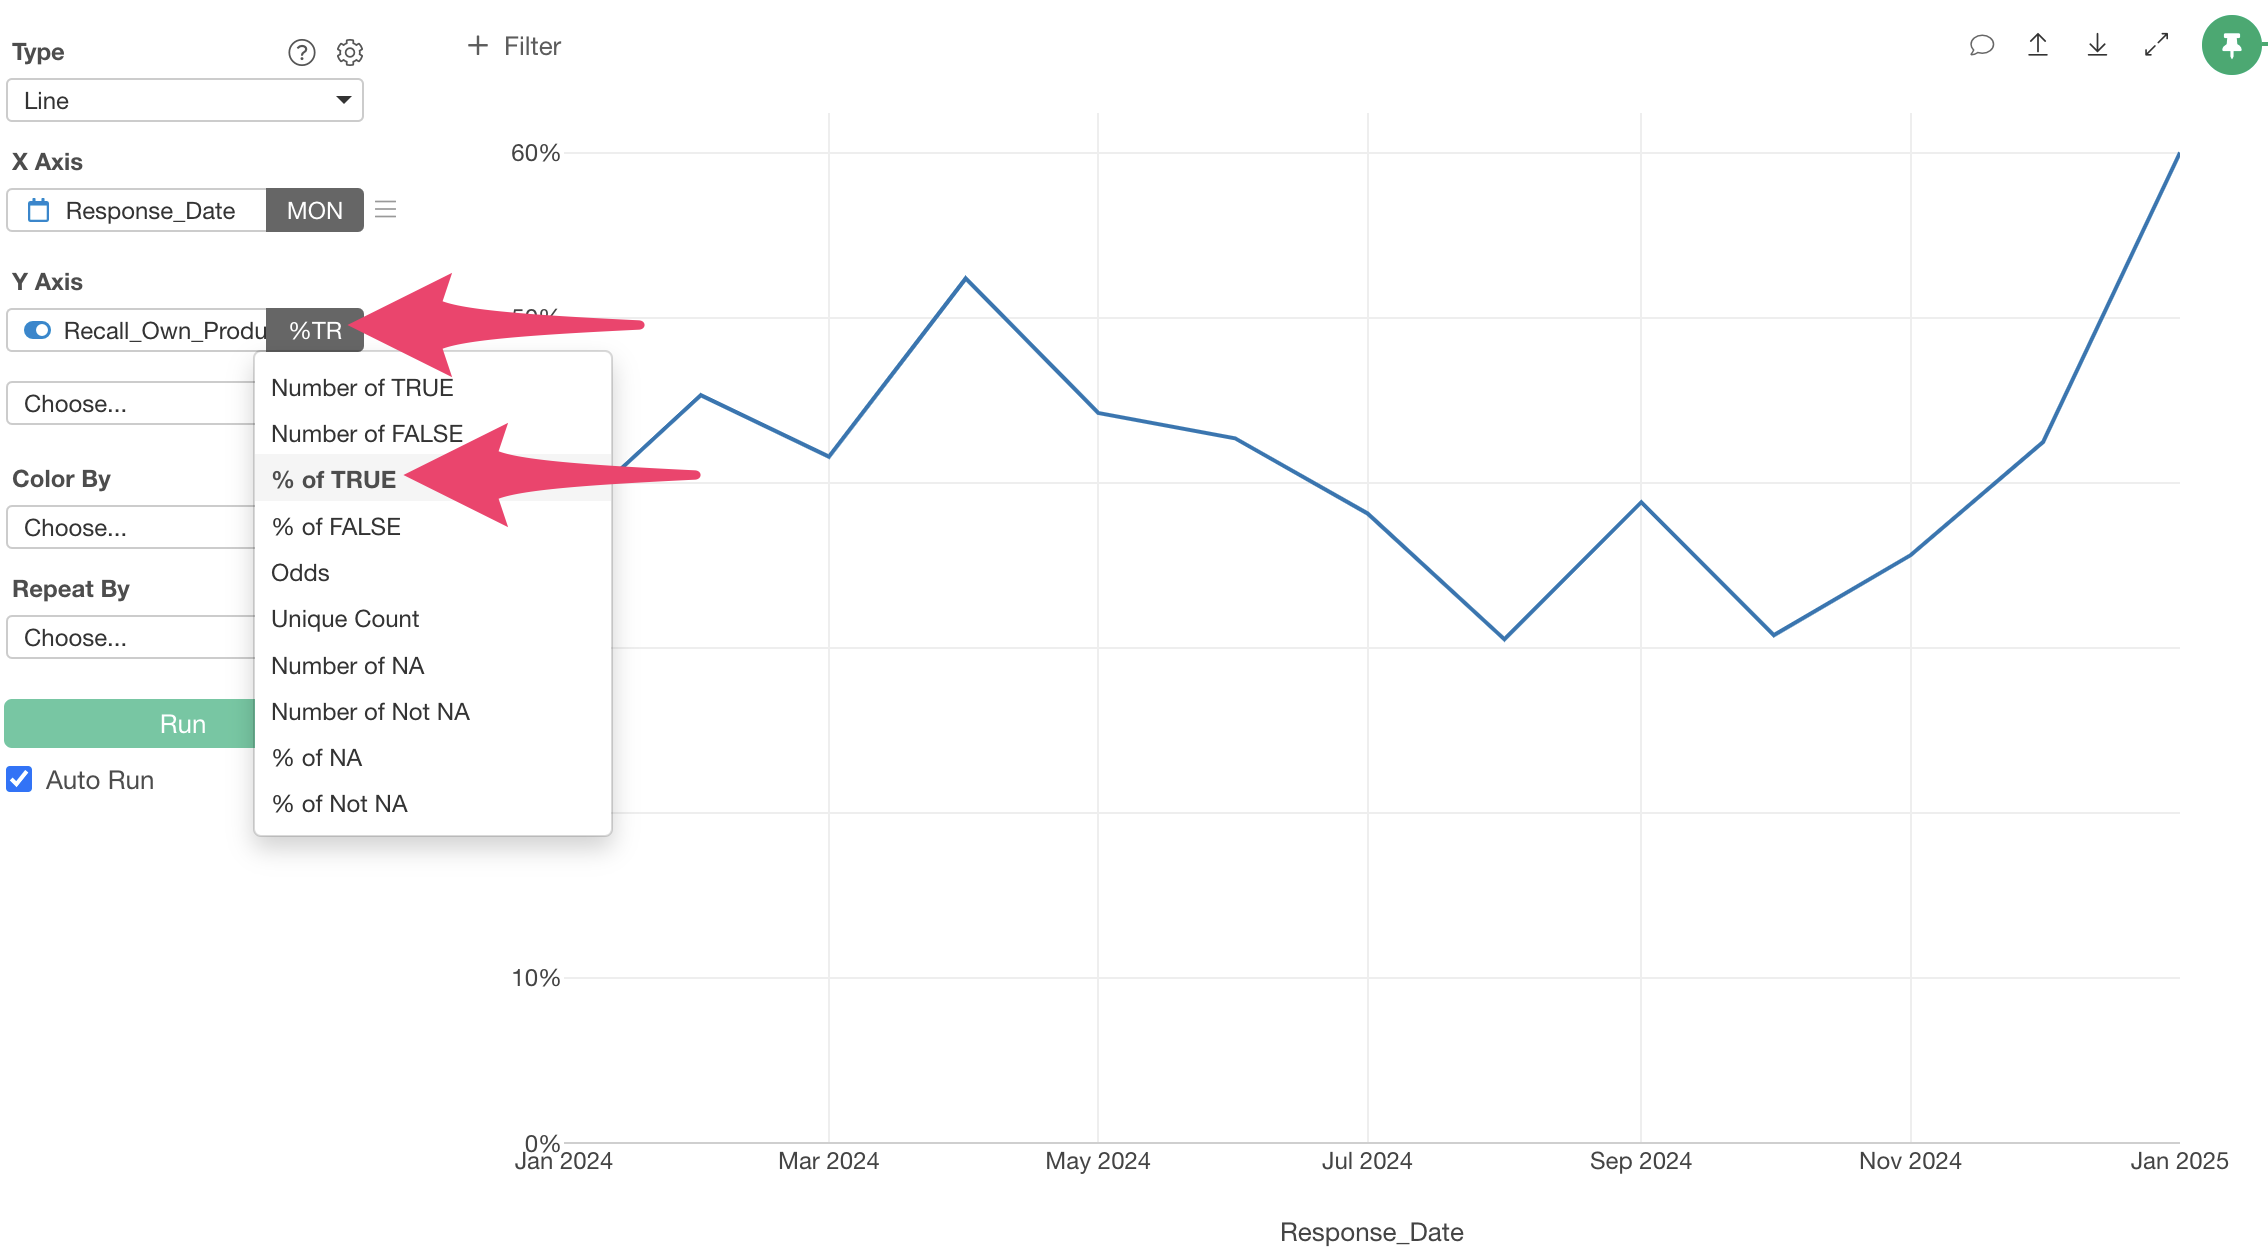
In this way, by using the AI Prompt feature, you can easily visualize KPIs using charts.
Best Practices for Calculating Marketing Metrics
There are points to note when using the AI Prompt to calculate marketing metrics.
That is, when calculating metrics using AI, in many cases, the clearer and more understandable the column names of the data are, the more likely you are to get the expected results.
For example, consider the case of the following survey data:
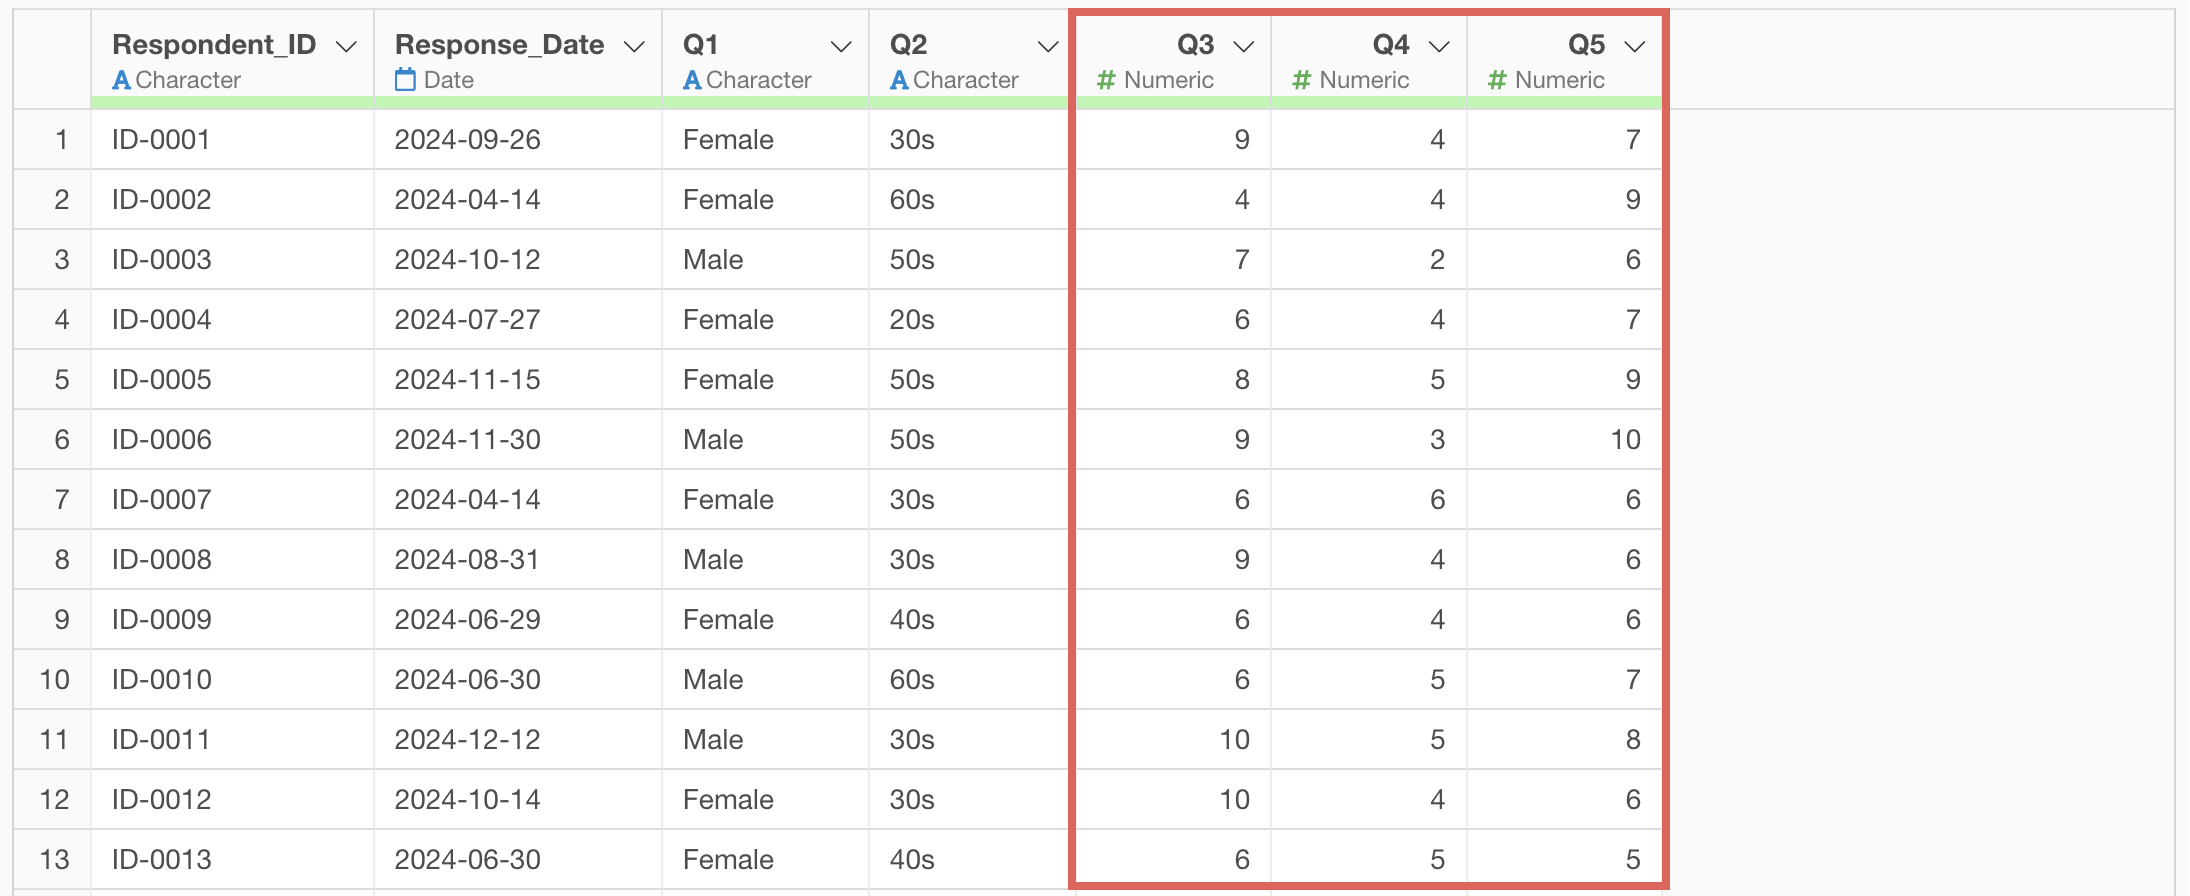
With such data, the AI prompt cannot read which column represents the “recommendation score” for NPS.
In such cases, you can deal with this in two ways, for example.
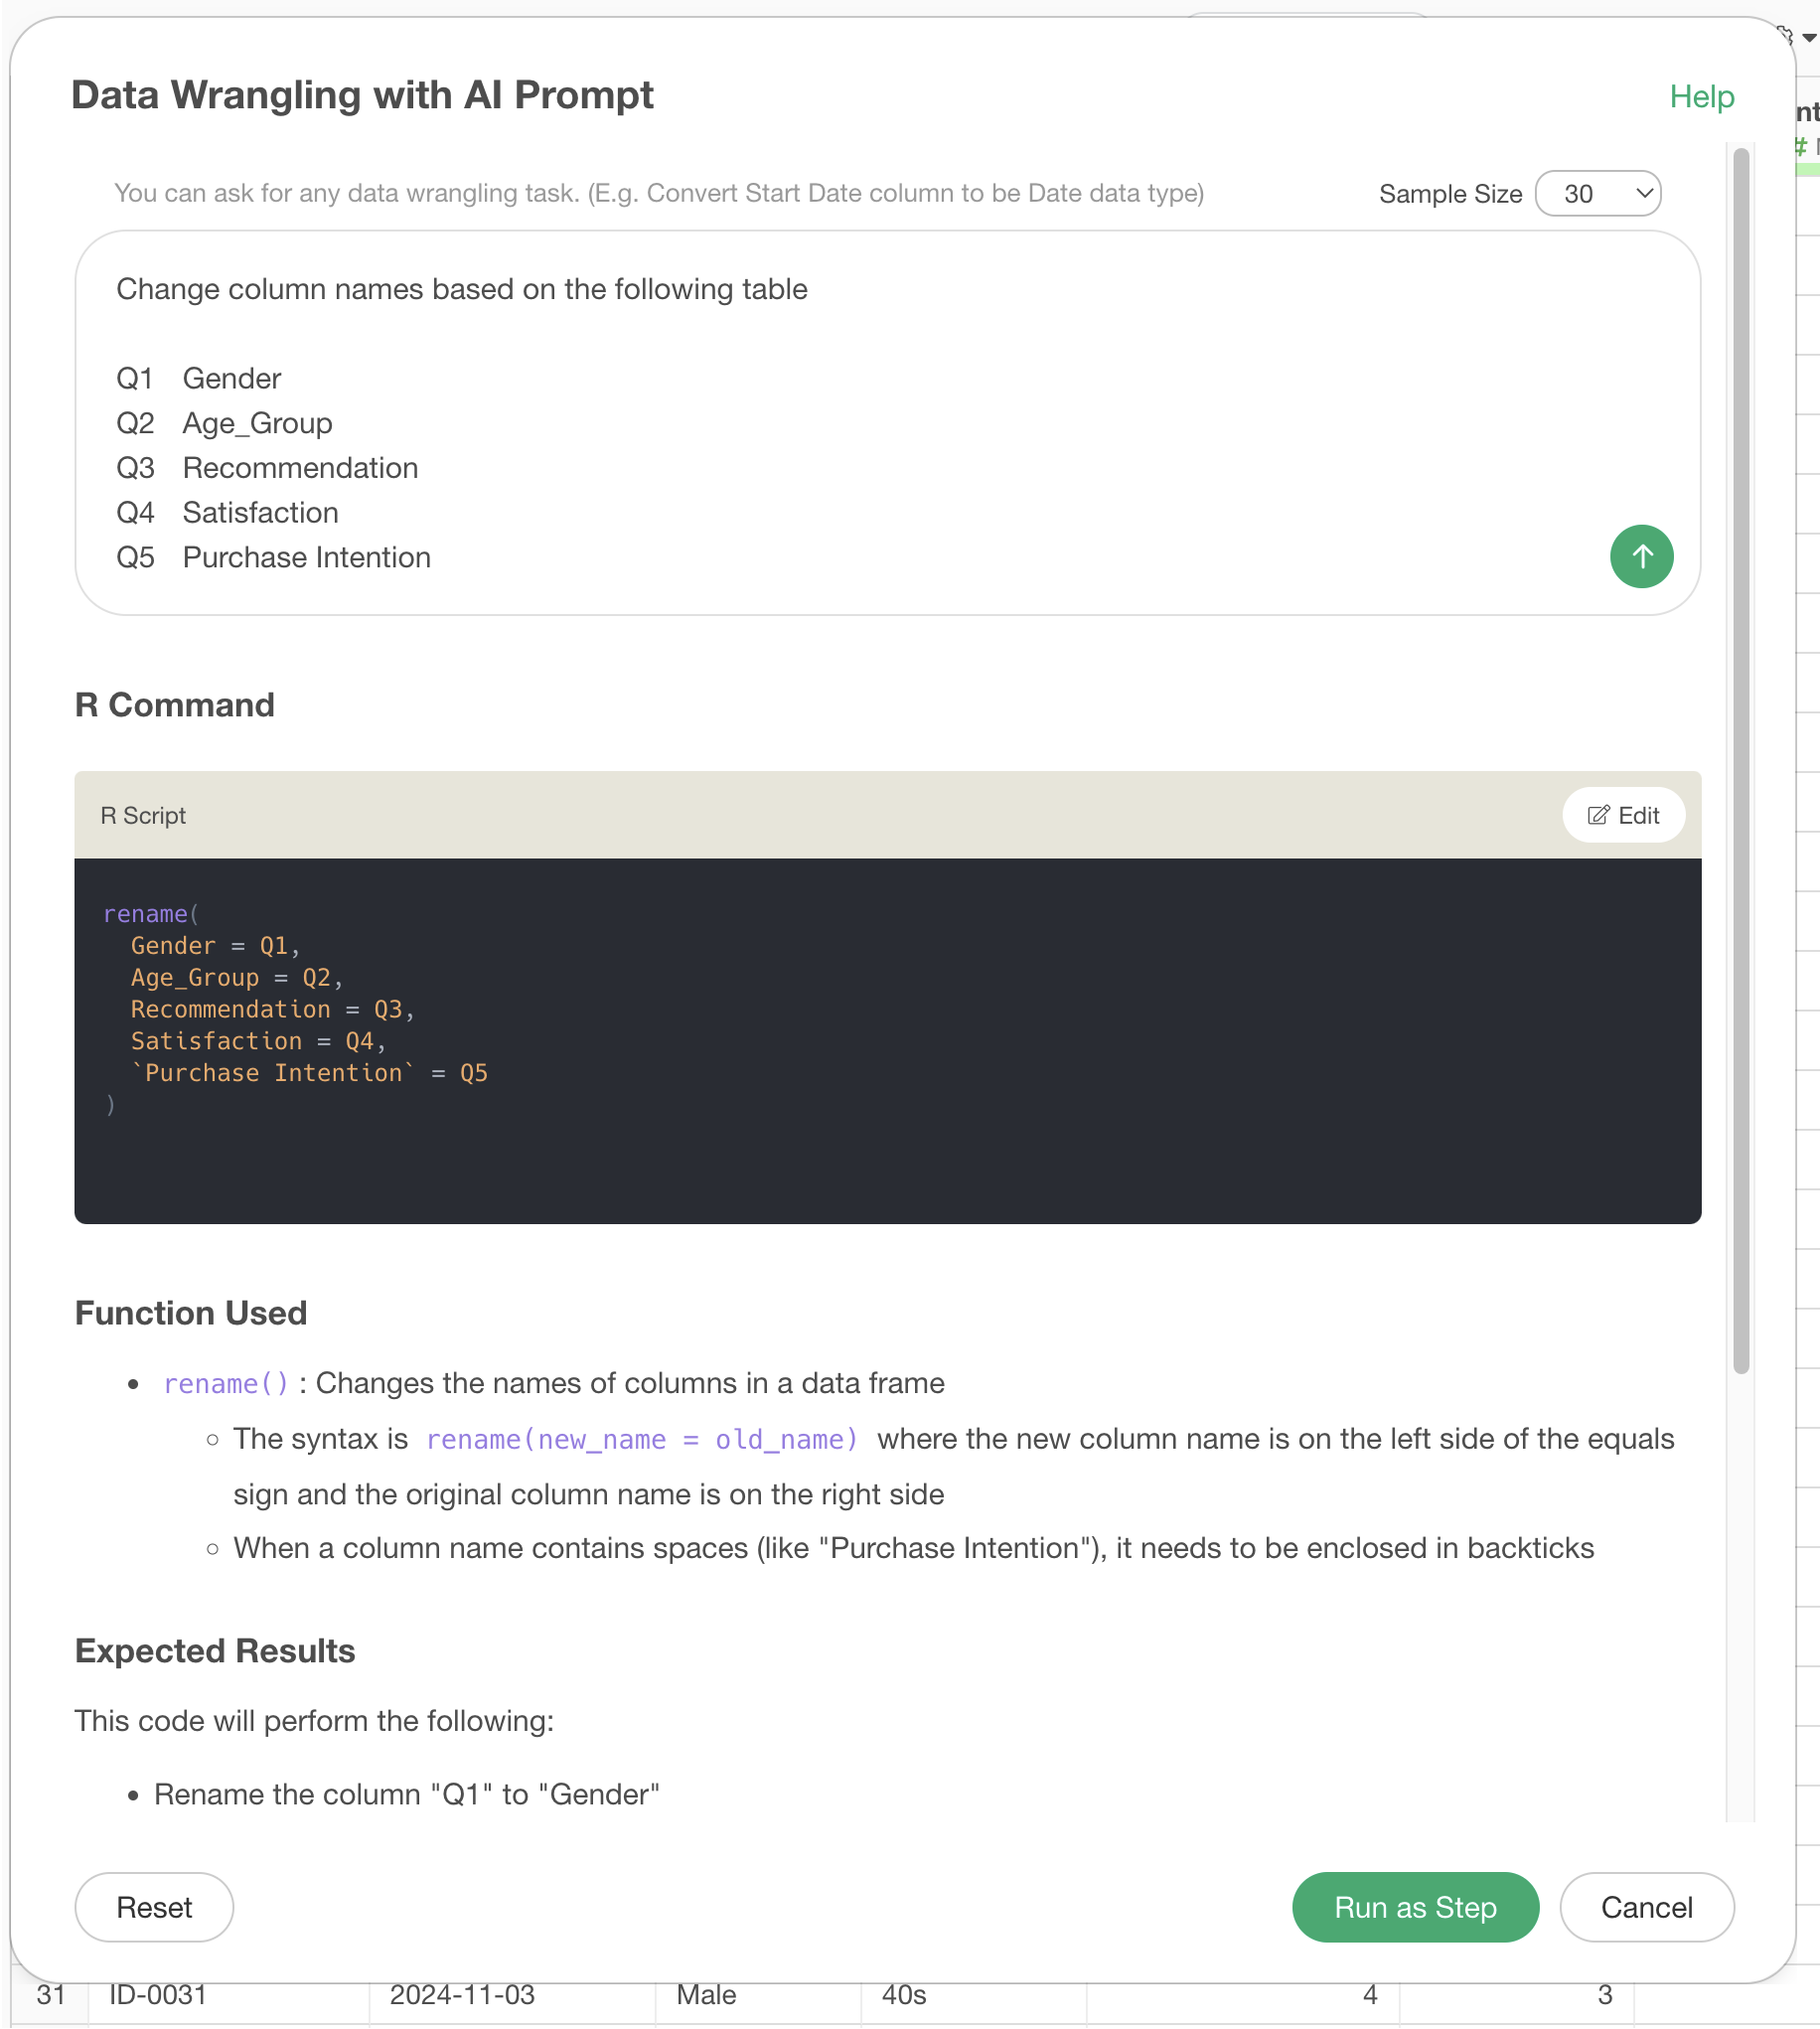
The first is to change the column names themselves using AI prompts as follows:
Change column names based on the following table
Q1 Gender Q2 Age_Group Q3 Recommendation Q4 Satisfaction Q5 Purchase Intention
The second is to use the column names to be processed in the AI prompt:
Calculate monthly NPS using Q3

By clearly communicating which column to use for calculation, the accuracy of the AI prompt improves.
In this way, while AI prompts can respond flexibly, it’s important that the column names of the data clearly indicate what they represent in order to obtain more accurate results.
Want to try it with your own data?
This time, we introduced how to create marketing KPI calculations using AI prompts.
If you want to calculate marketing KPIs using your own data, we also offer a 30-day free trial, so please give it a try!