Using AI Prompts to Calculate Sales Metrics (KPIs)
To measure the effectiveness of sales activities, it’s necessary to monitor appropriate metrics (KPIs). Important indicators for measuring sales performance include:
- Sales from new and existing customers
- Sales per customer
- Customer acquisition cost
- Profit margin
- Order rate
However, calculating these metrics or creating charts to monitor them can be quite challenging. This is because various data processing and calculations are often required.
For example, let’s focus on “sales per customer,” which represents the average revenue generated from a single customer.
If you only have order data where each row represents a single order, you need to use this data to calculate sales per customer.

In that case, you need to calculate using the following steps:
- Aggregate sales and number of customers by month
- Divide sales by number of customers for each month to calculate sales per customer
As a result, many people don’t have enough time to work on this and often end up unable to monitor such metrics.
Calculating Sales Metrics Using AI Prompts
However, here’s some Good News!
Since Exploratory v12, data wrangling (processing, formatting) has become quick and easy through the AI prompt interface.
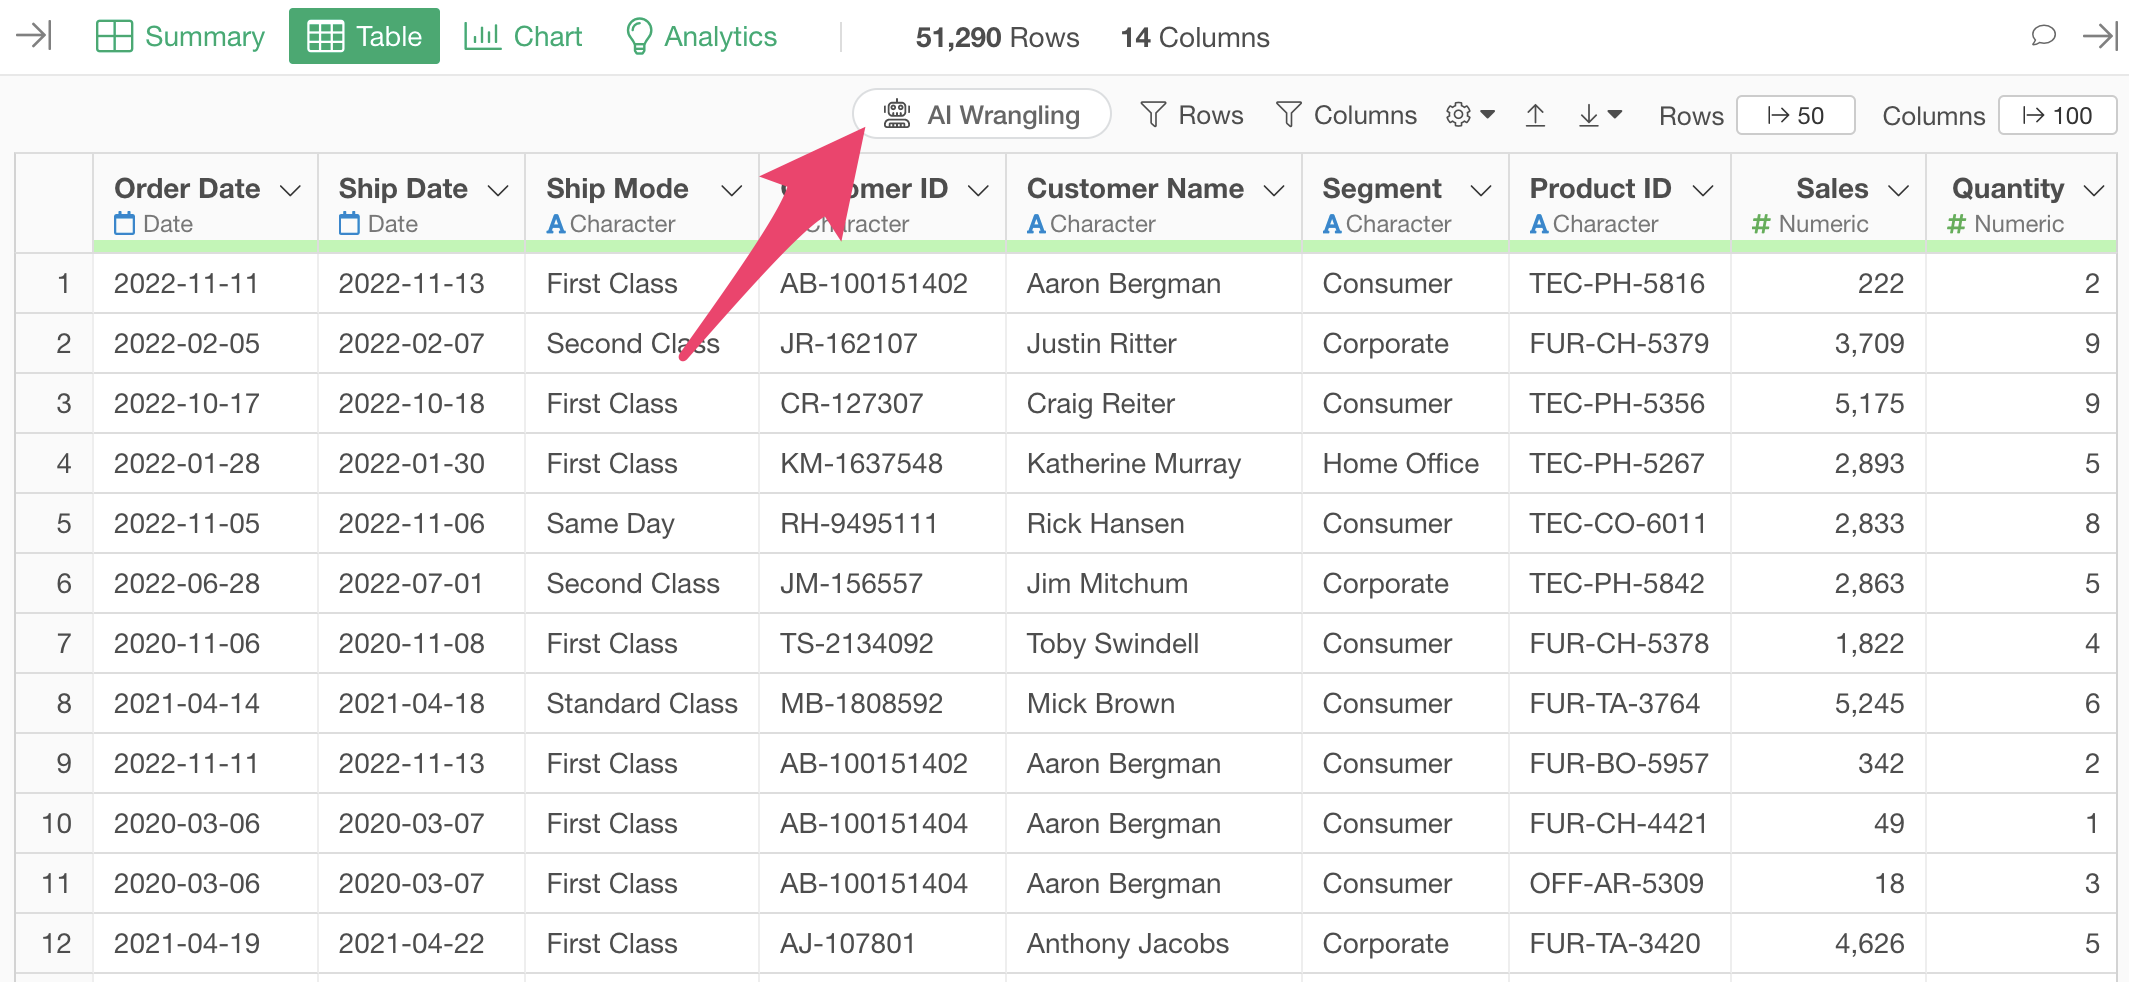
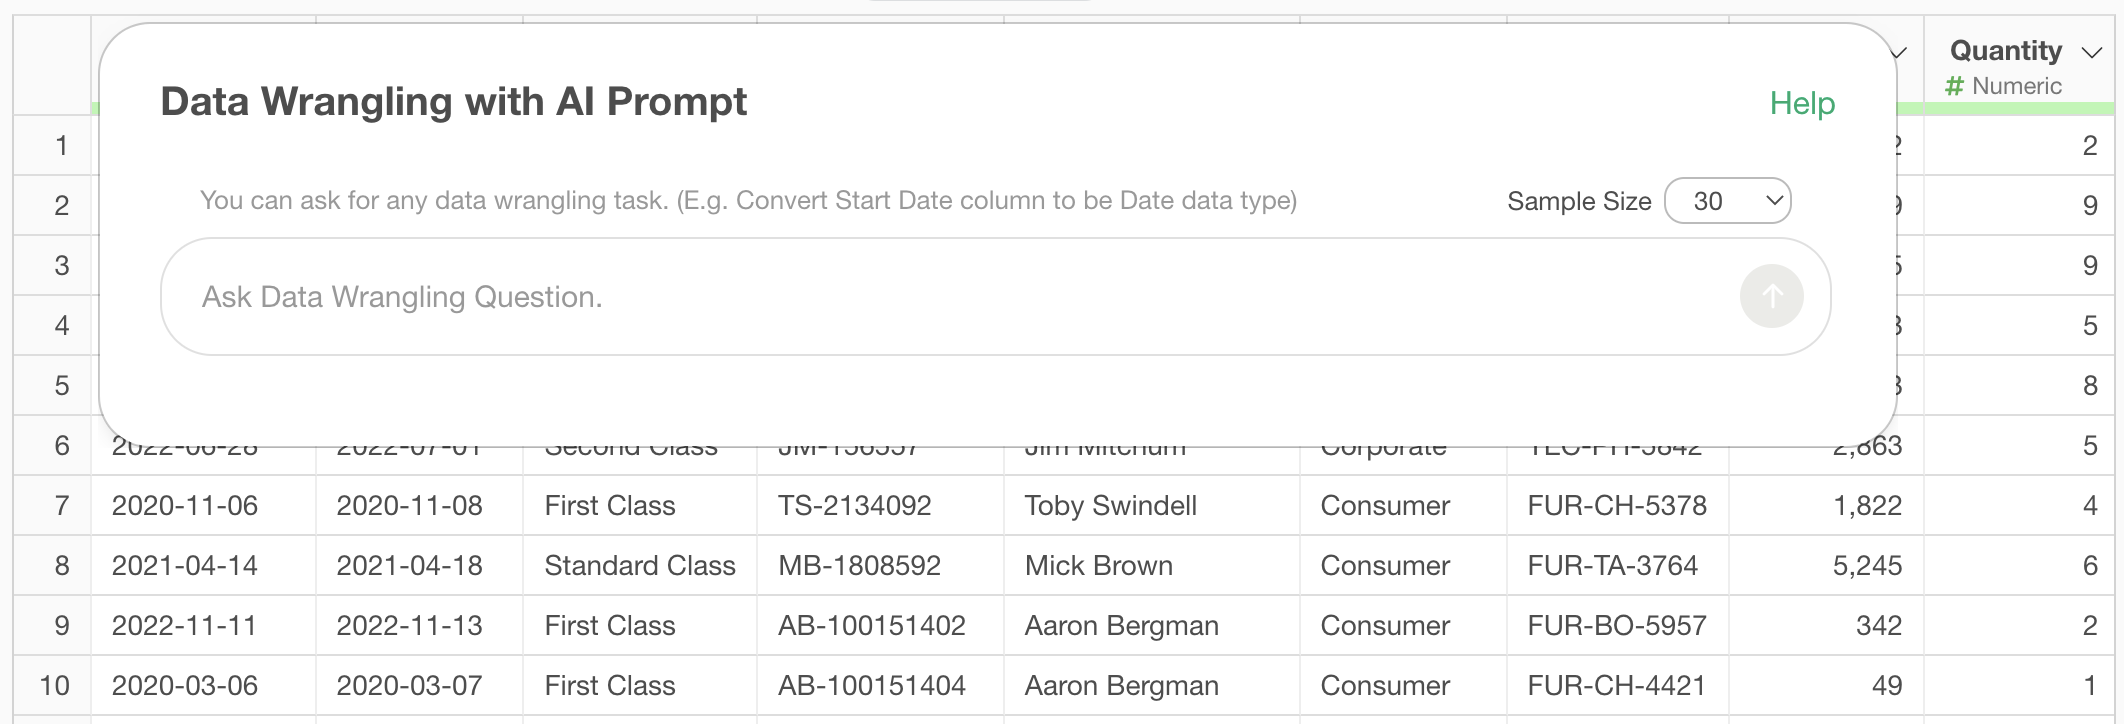
By simply clicking the “AI Wrangling” button and entering instructions for data processing in the prompt window, you can automatically generate R code to create the expected data.
This data wrangling feature using AI prompts is not limited to general data processing. Surprisingly, it can quickly and easily create sales metrics as well.
From here, we’ll introduce methods for calculating sales metrics using AI prompts, divided into three patterns.
1. Creating Sales per Customer
The first pattern involves entering the name of the metric you want to calculate into the prompt window, which then generates a multi-step script to calculate the metric all at once.
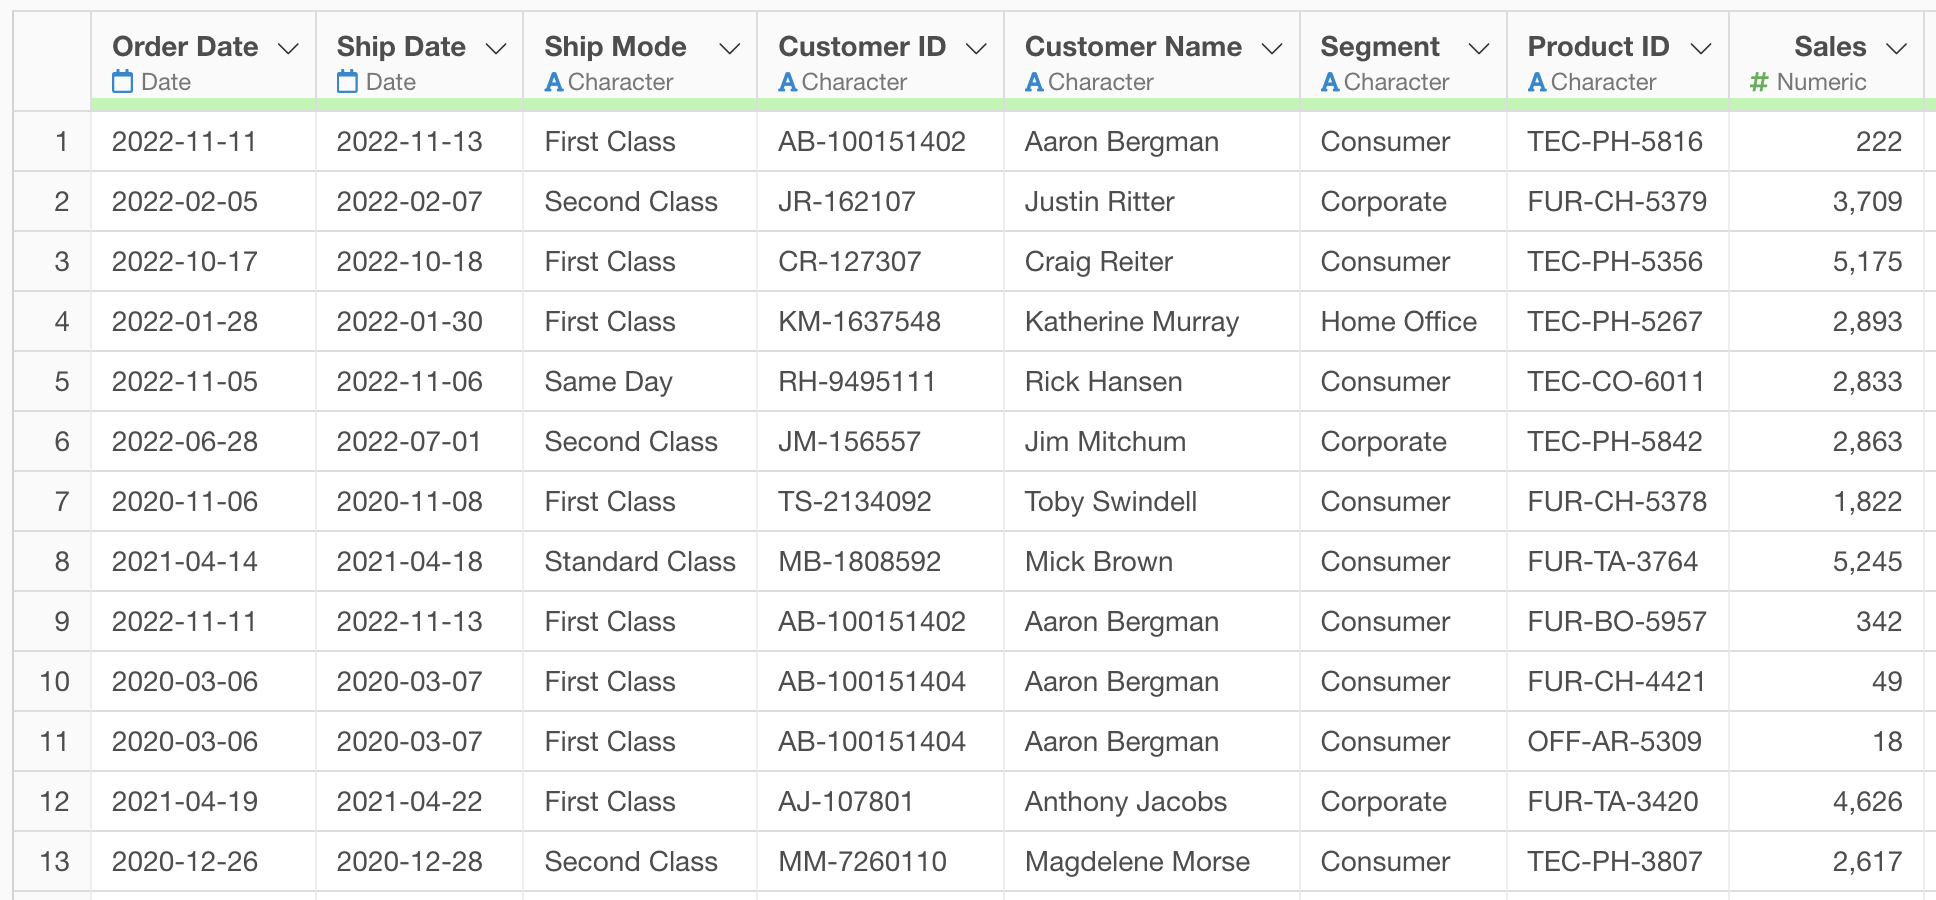
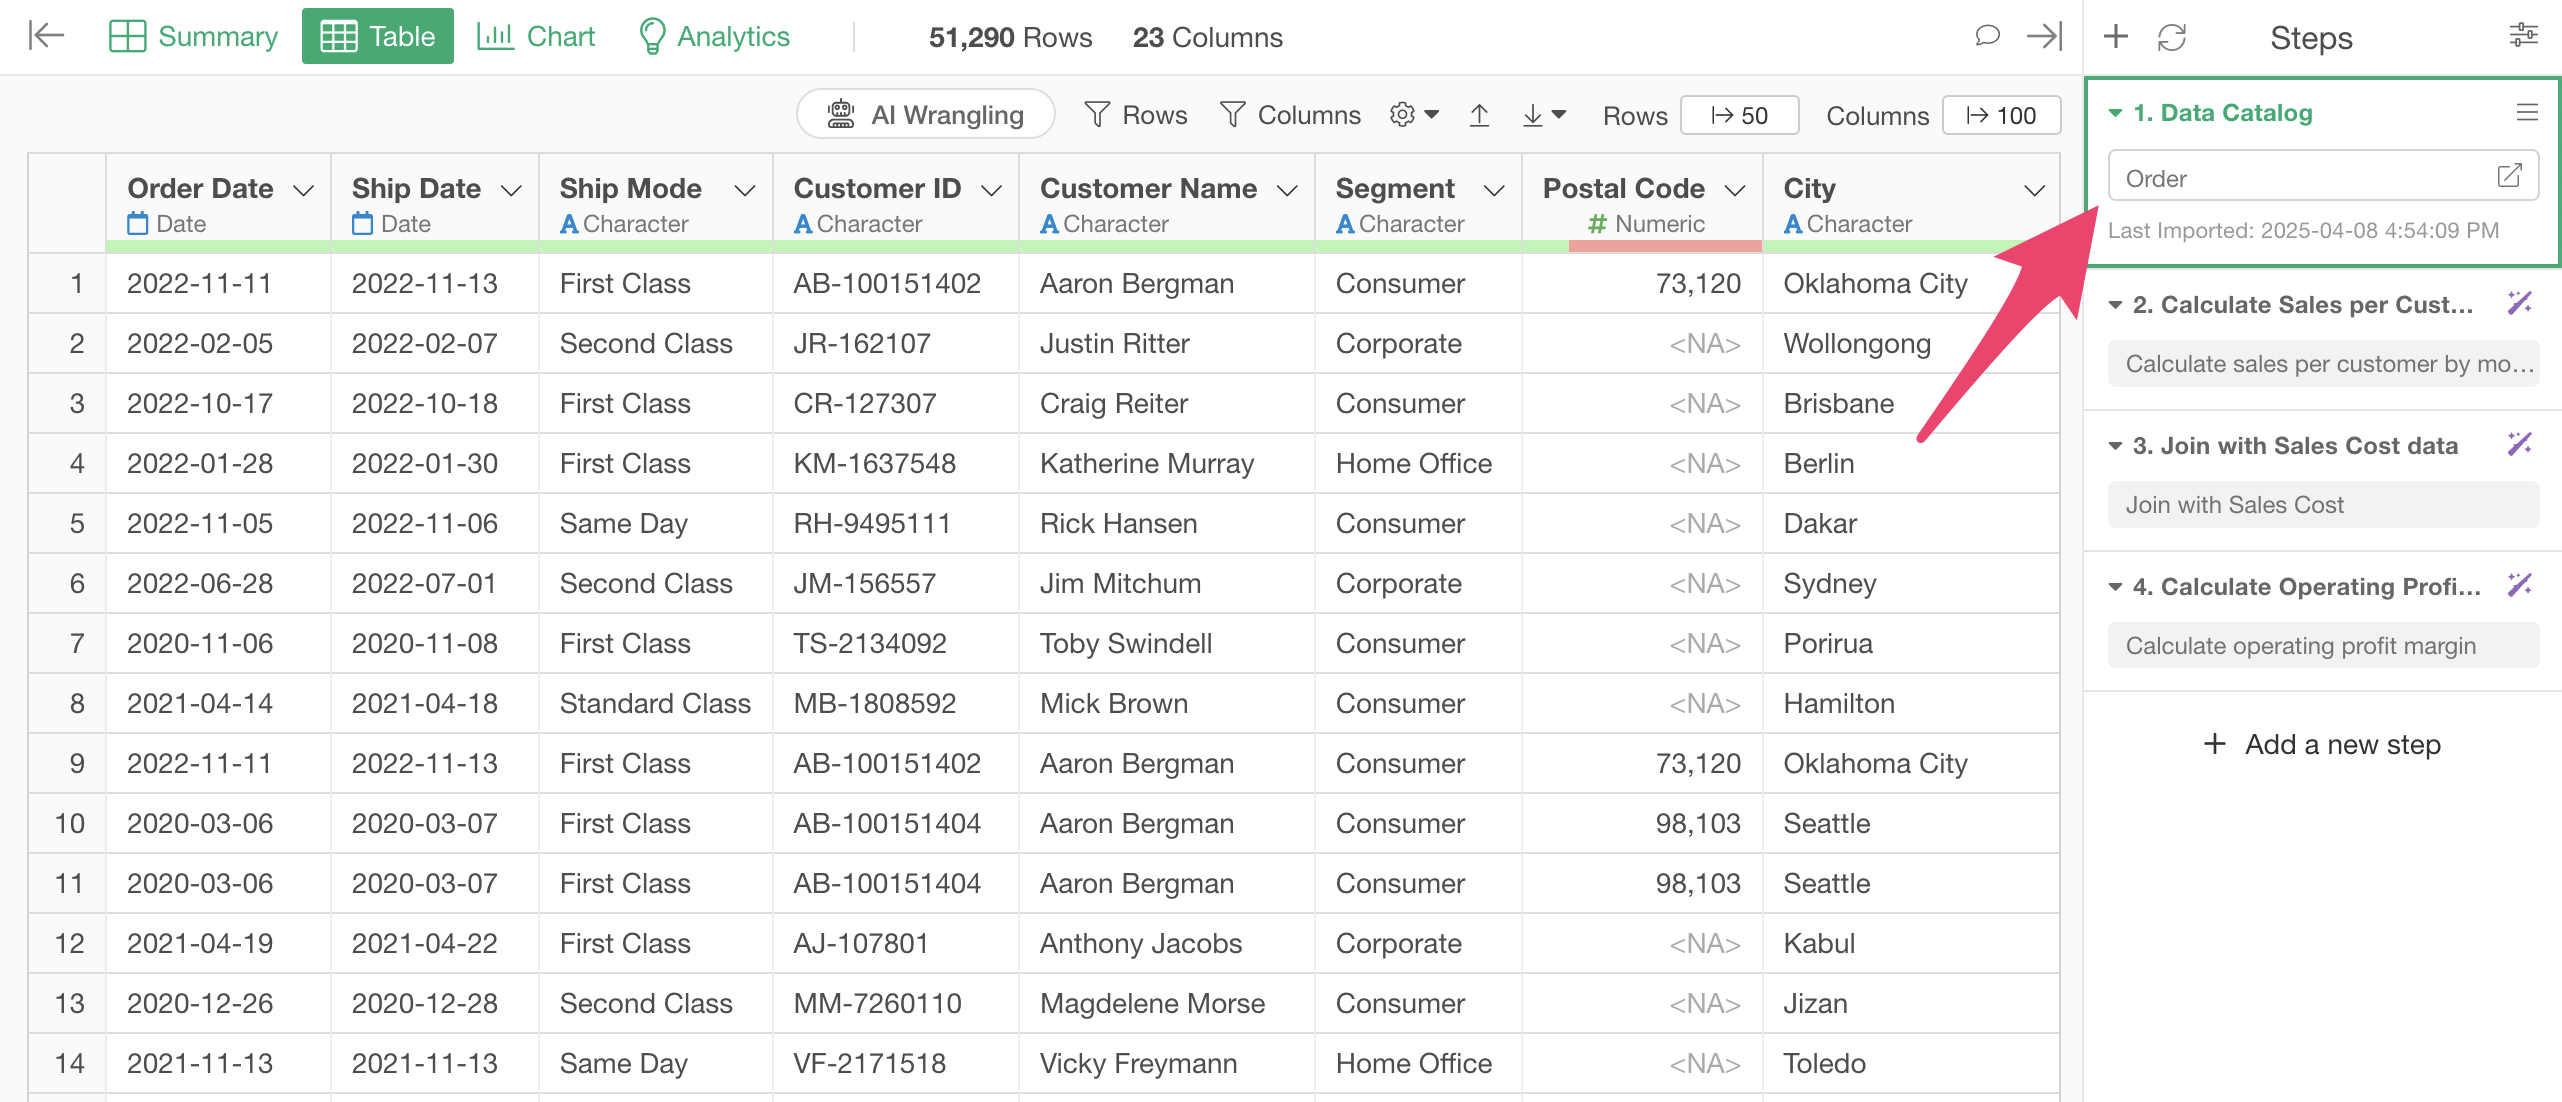
Here, we’ll introduce how to create sales per customer with the AI Prompt. The sample data used this time can be downloaded from here.
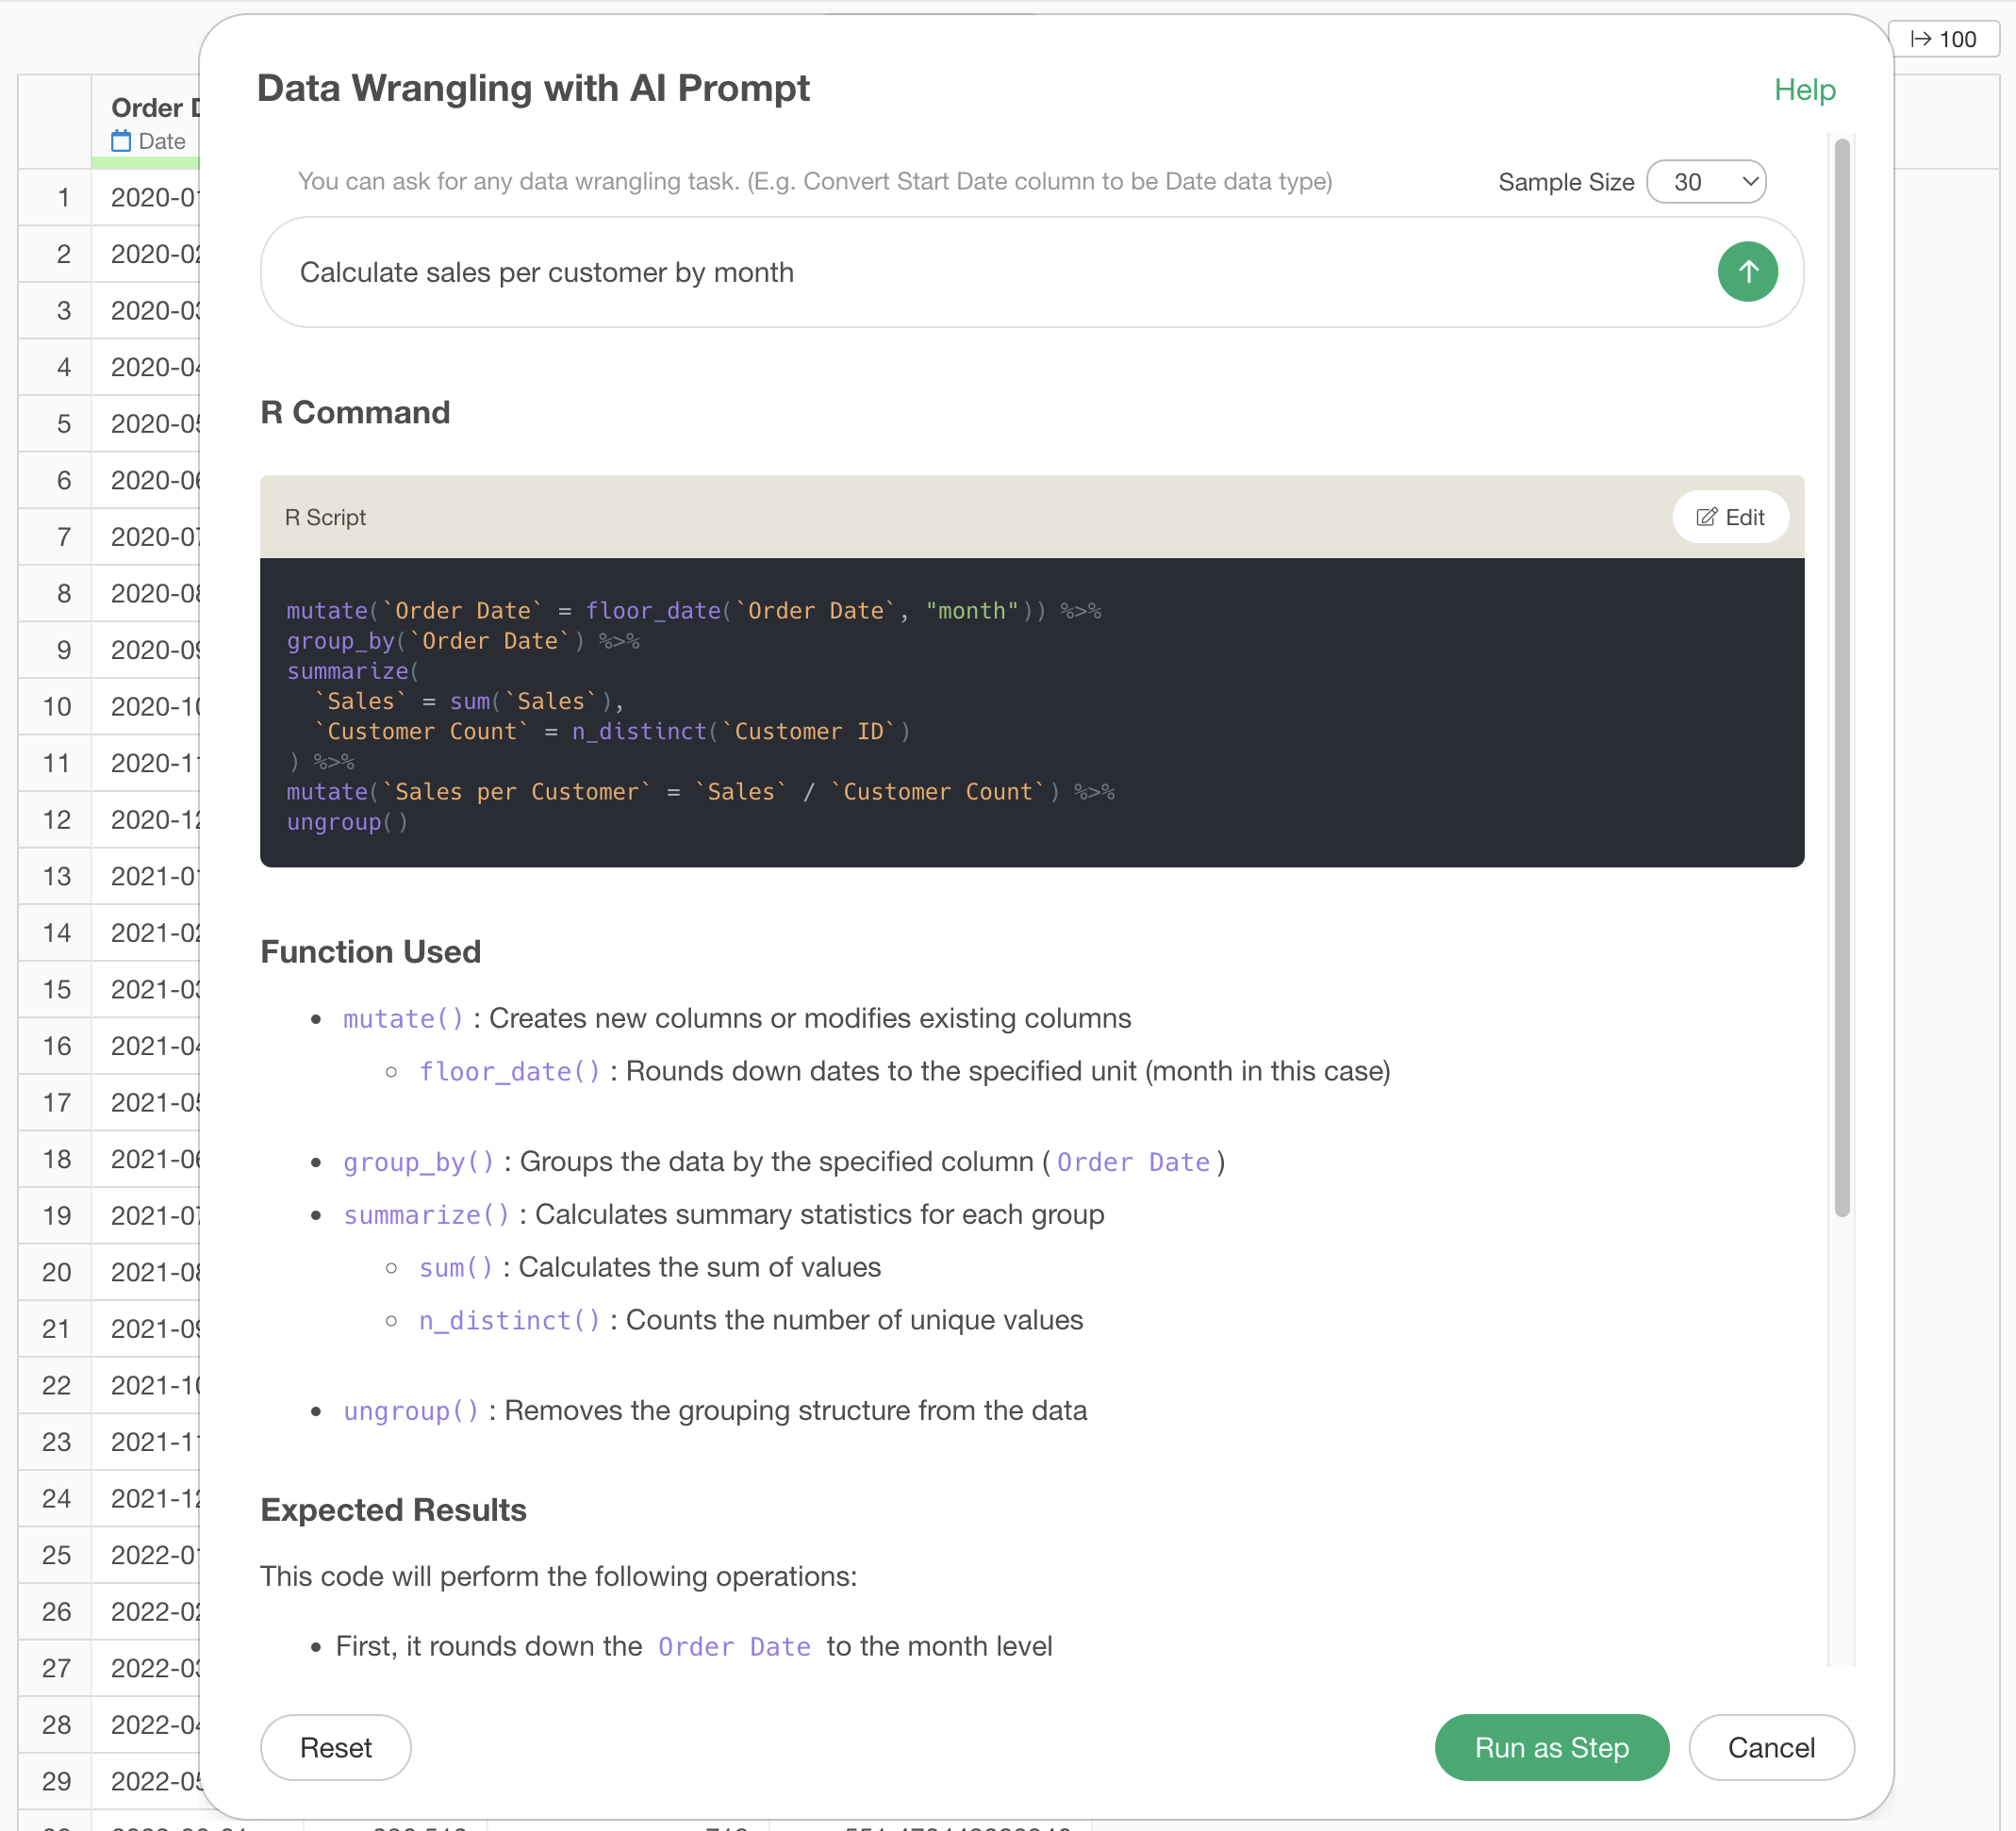
After displaying the prompt window, enter the following text in the prompt and execute:
Calculate sales per customer by month
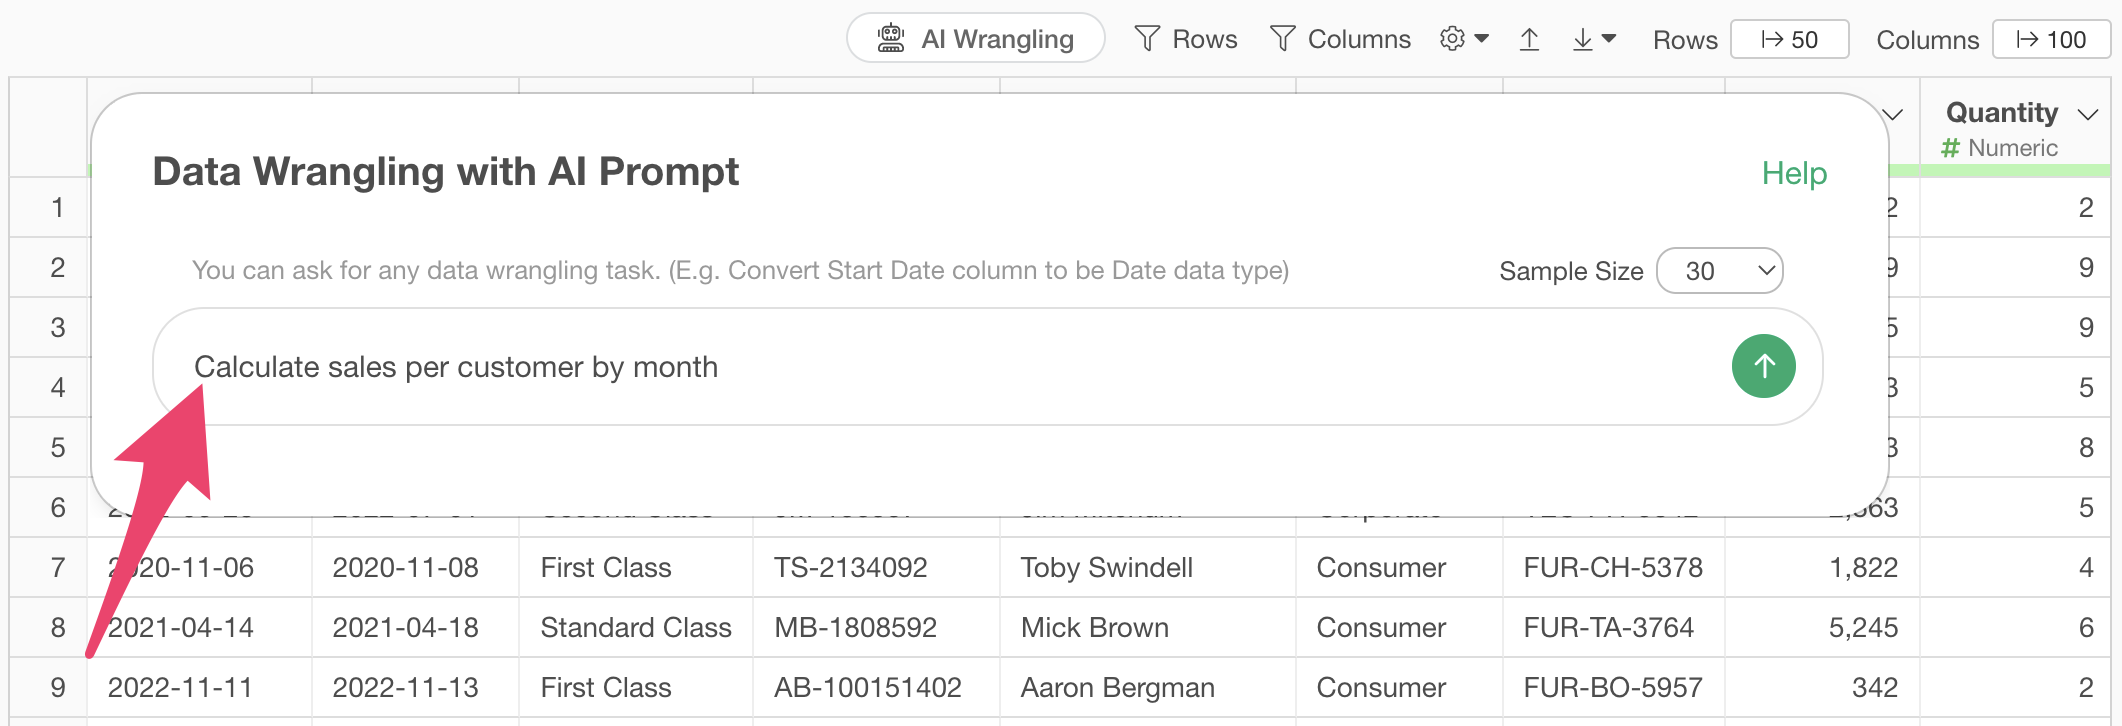
This will generate the R code needed to fulfill your input request. All you need to do is press the “Run as Step” button.
 Clicking
the “Run as Step” button will add the AI-generated code as a step and
run the process.
Clicking
the “Run as Step” button will add the AI-generated code as a step and
run the process.
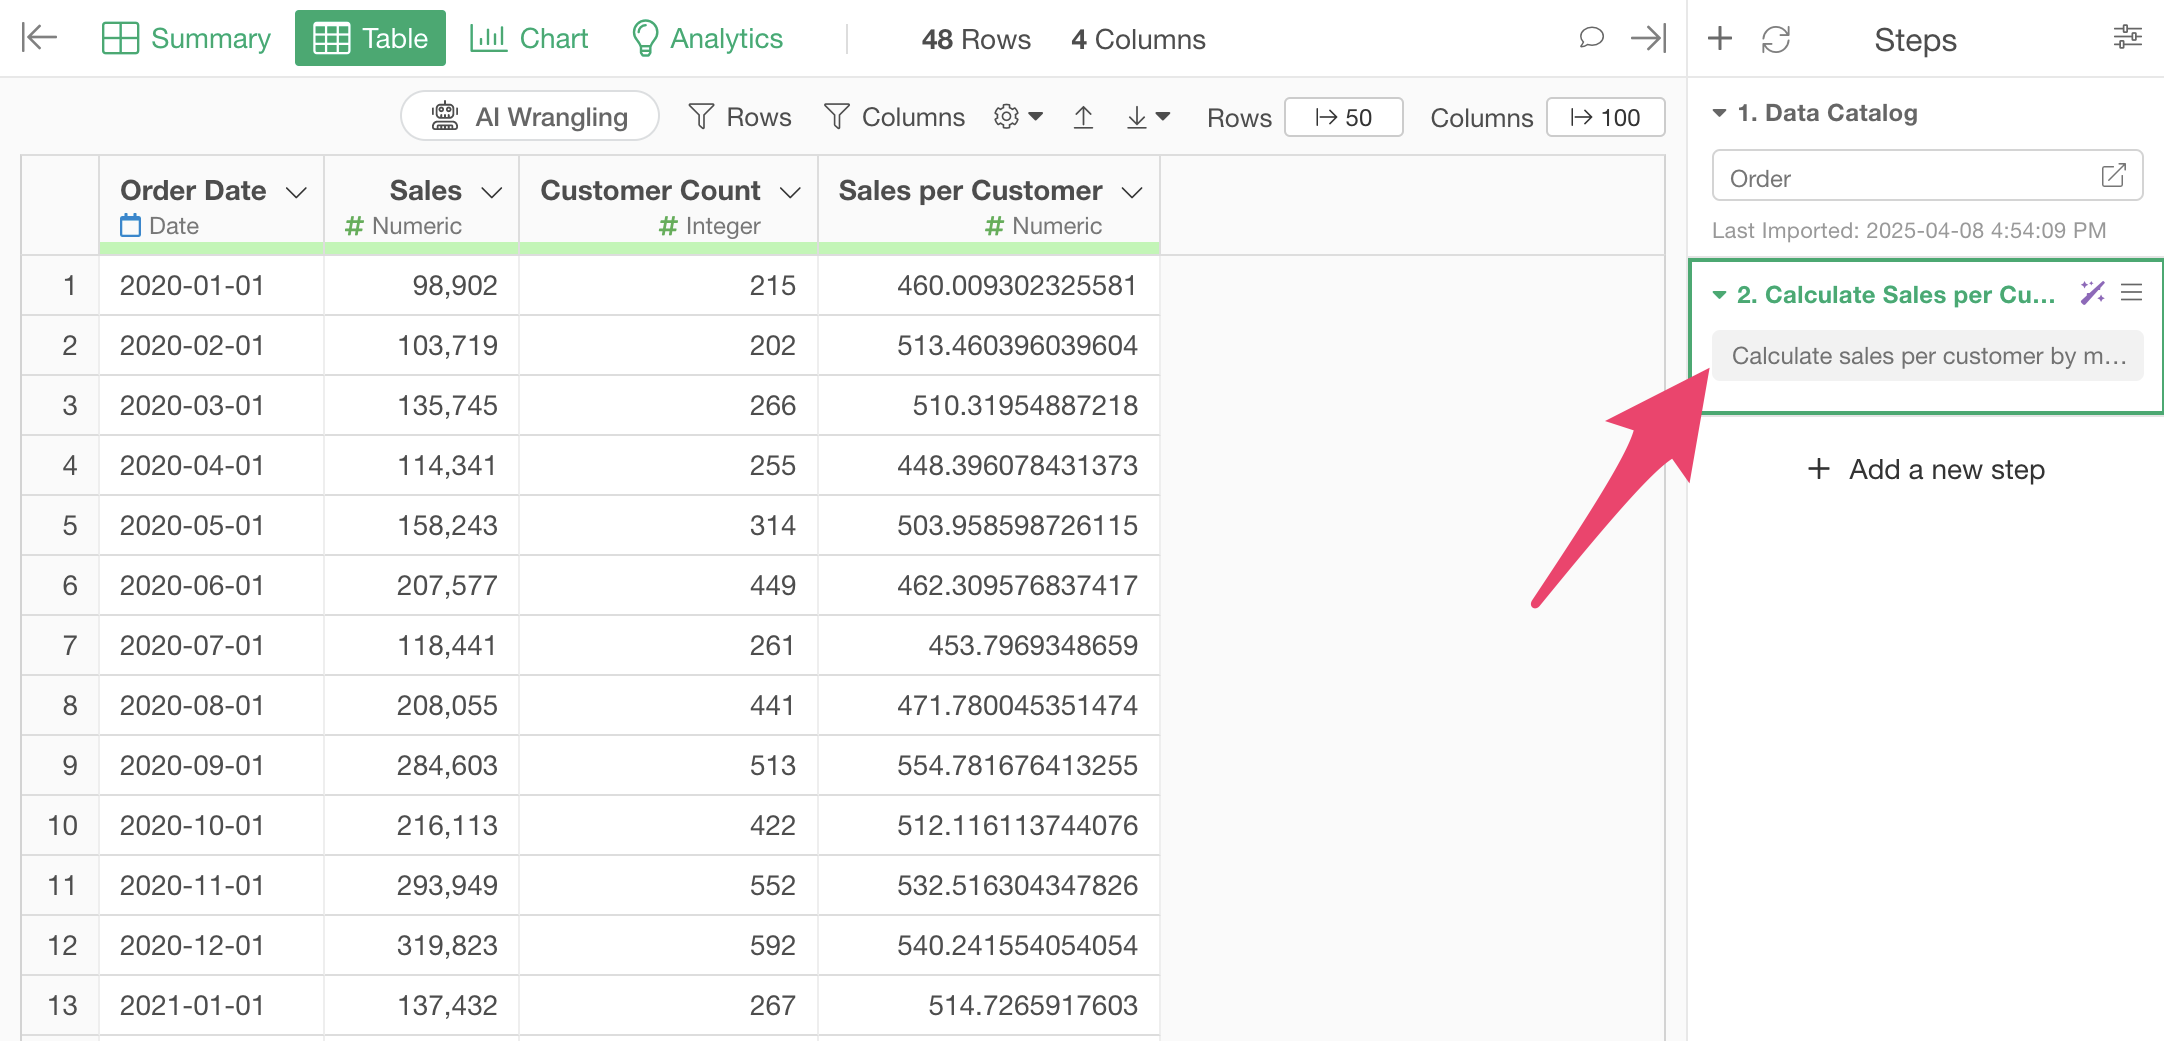
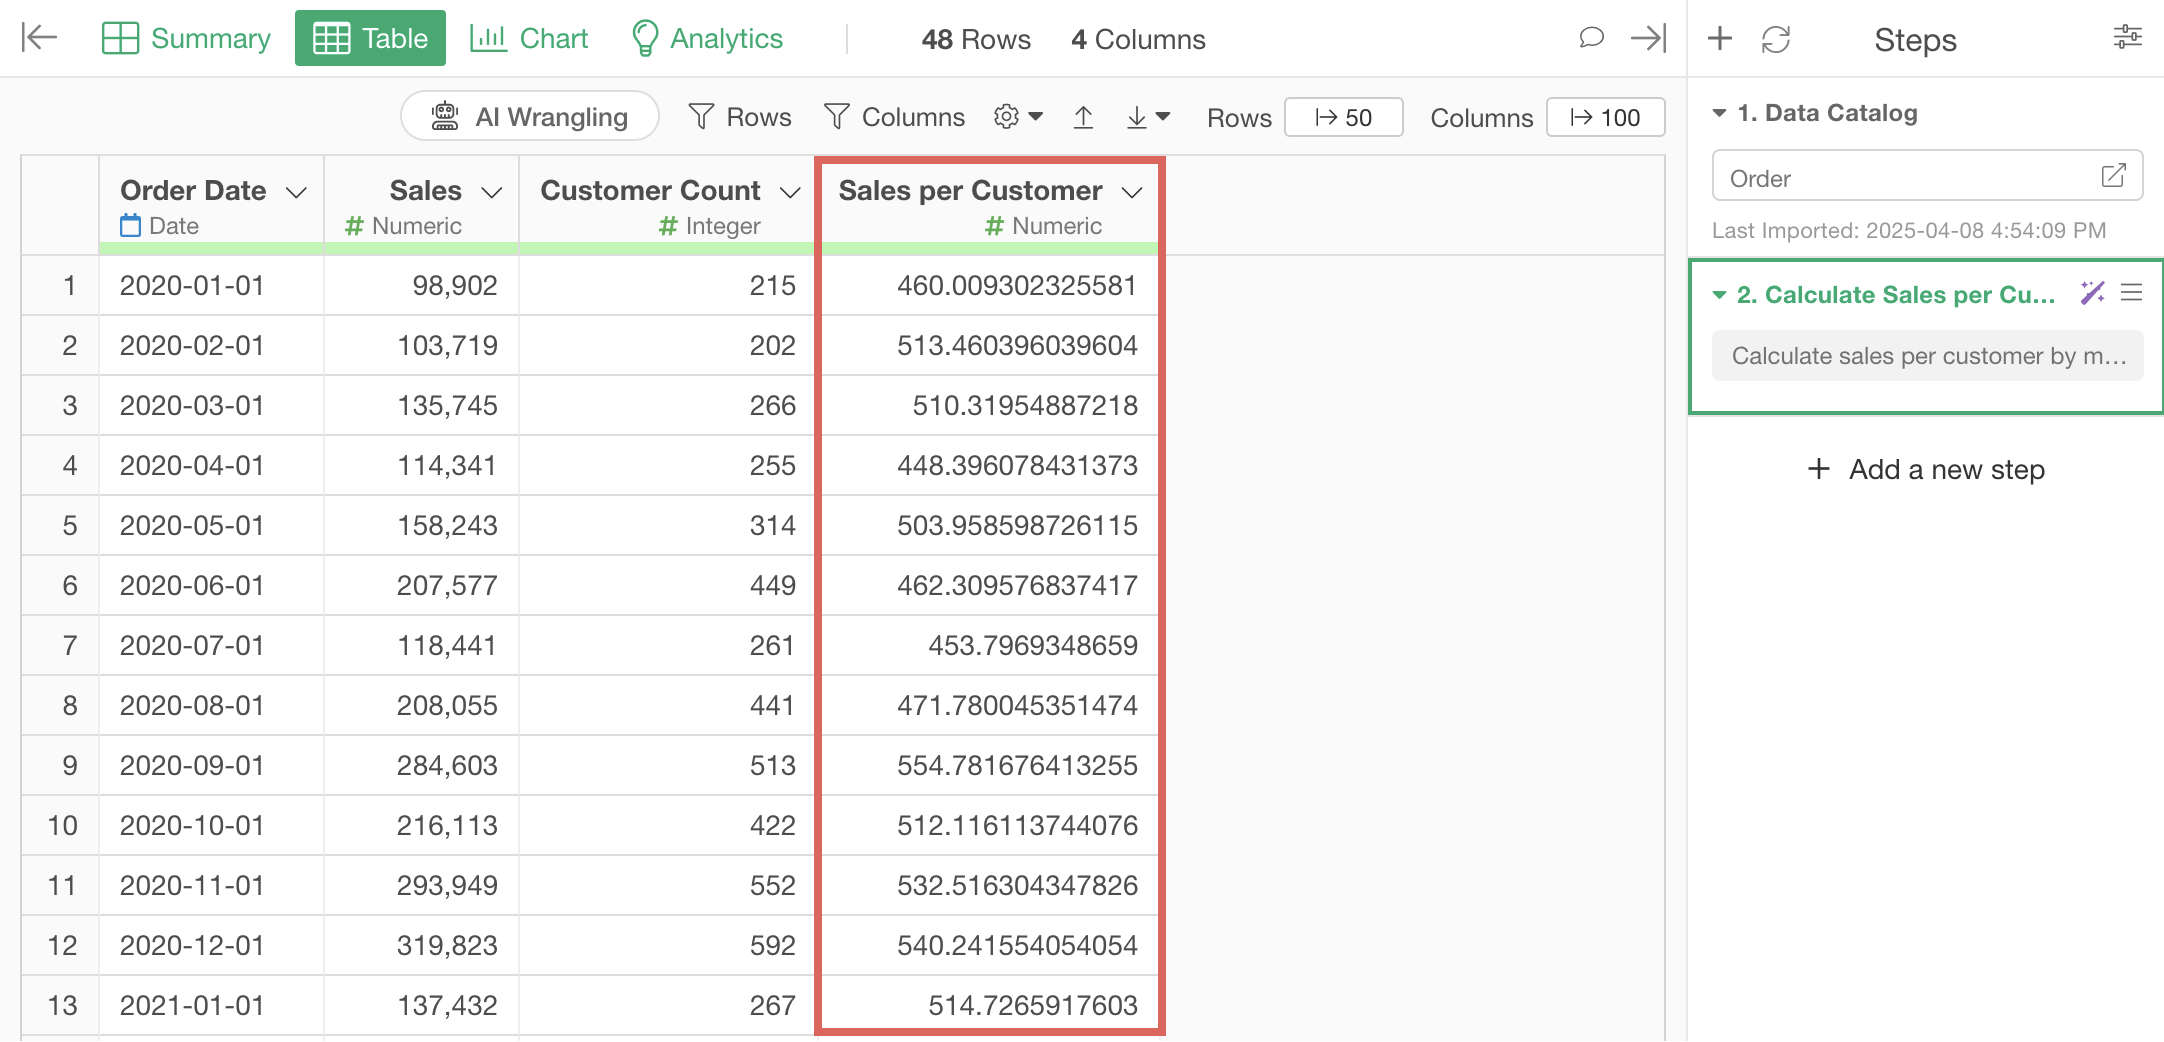
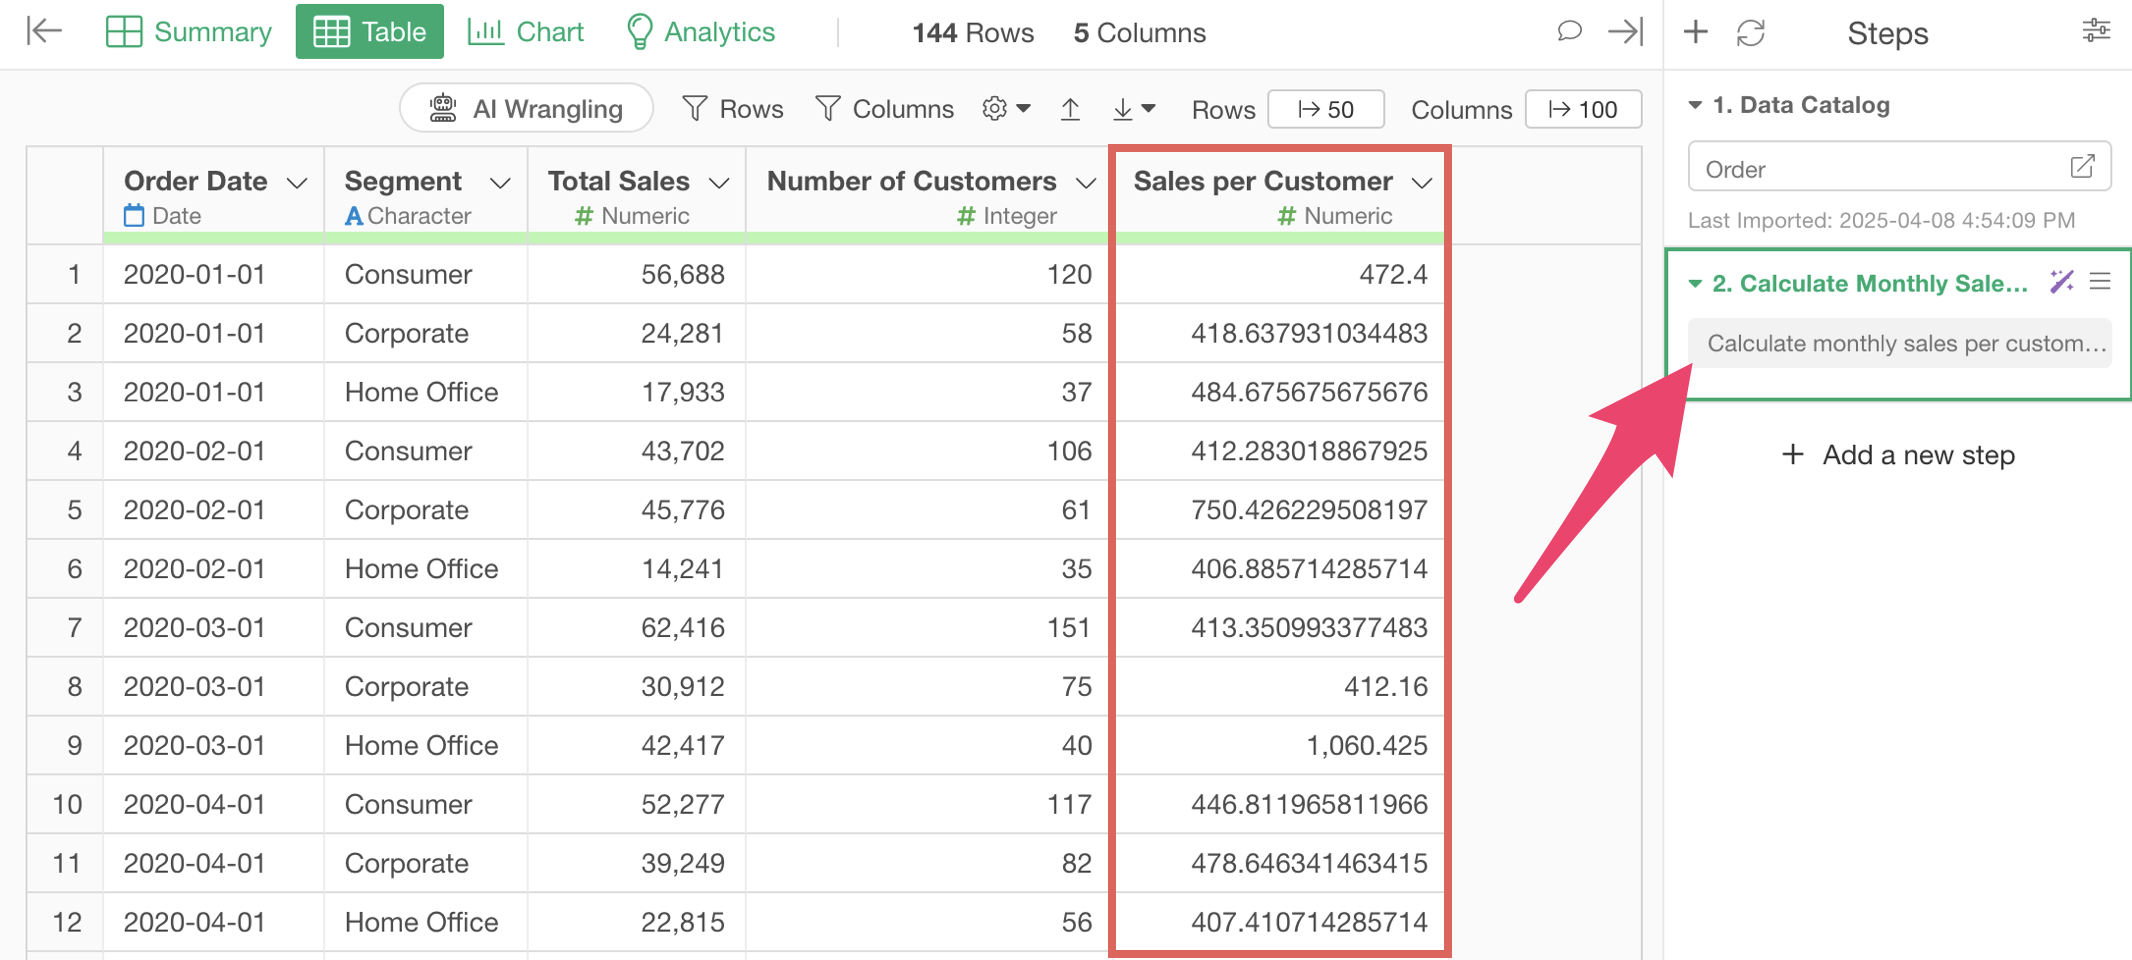
Even without knowing complex calculation methods or data processing techniques, you can quickly and easily calculate the monthly sales per customer.
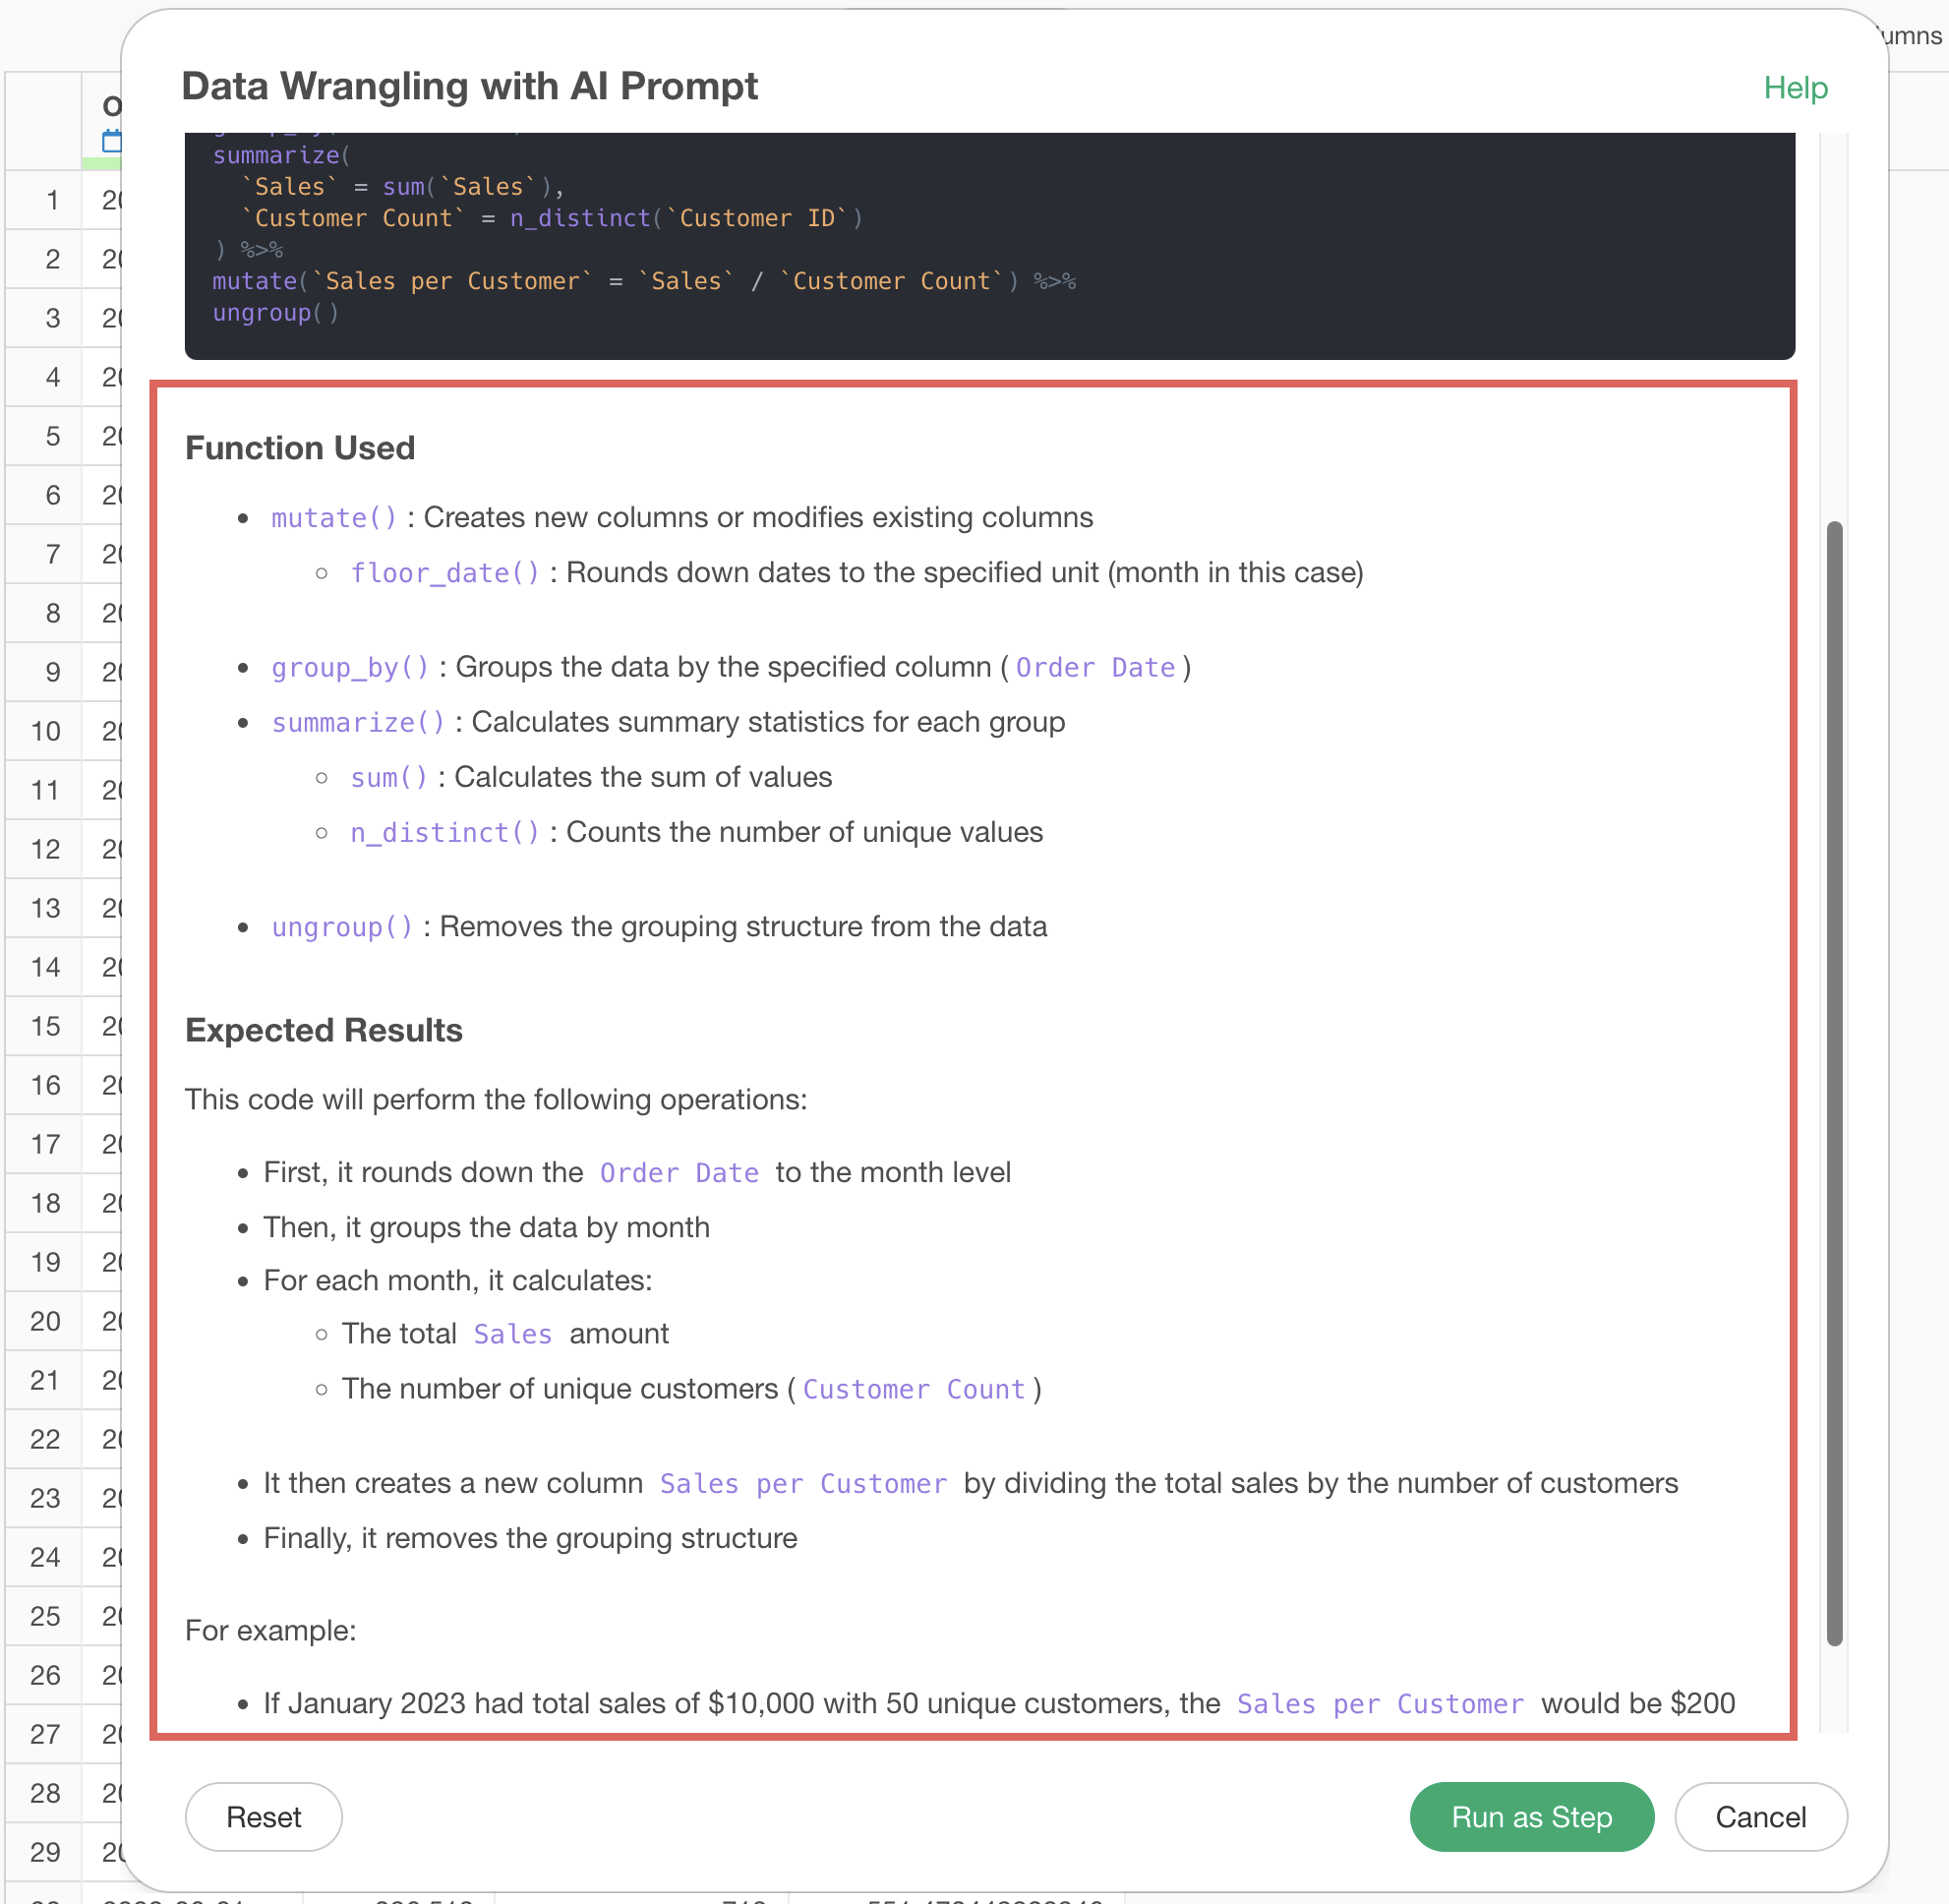
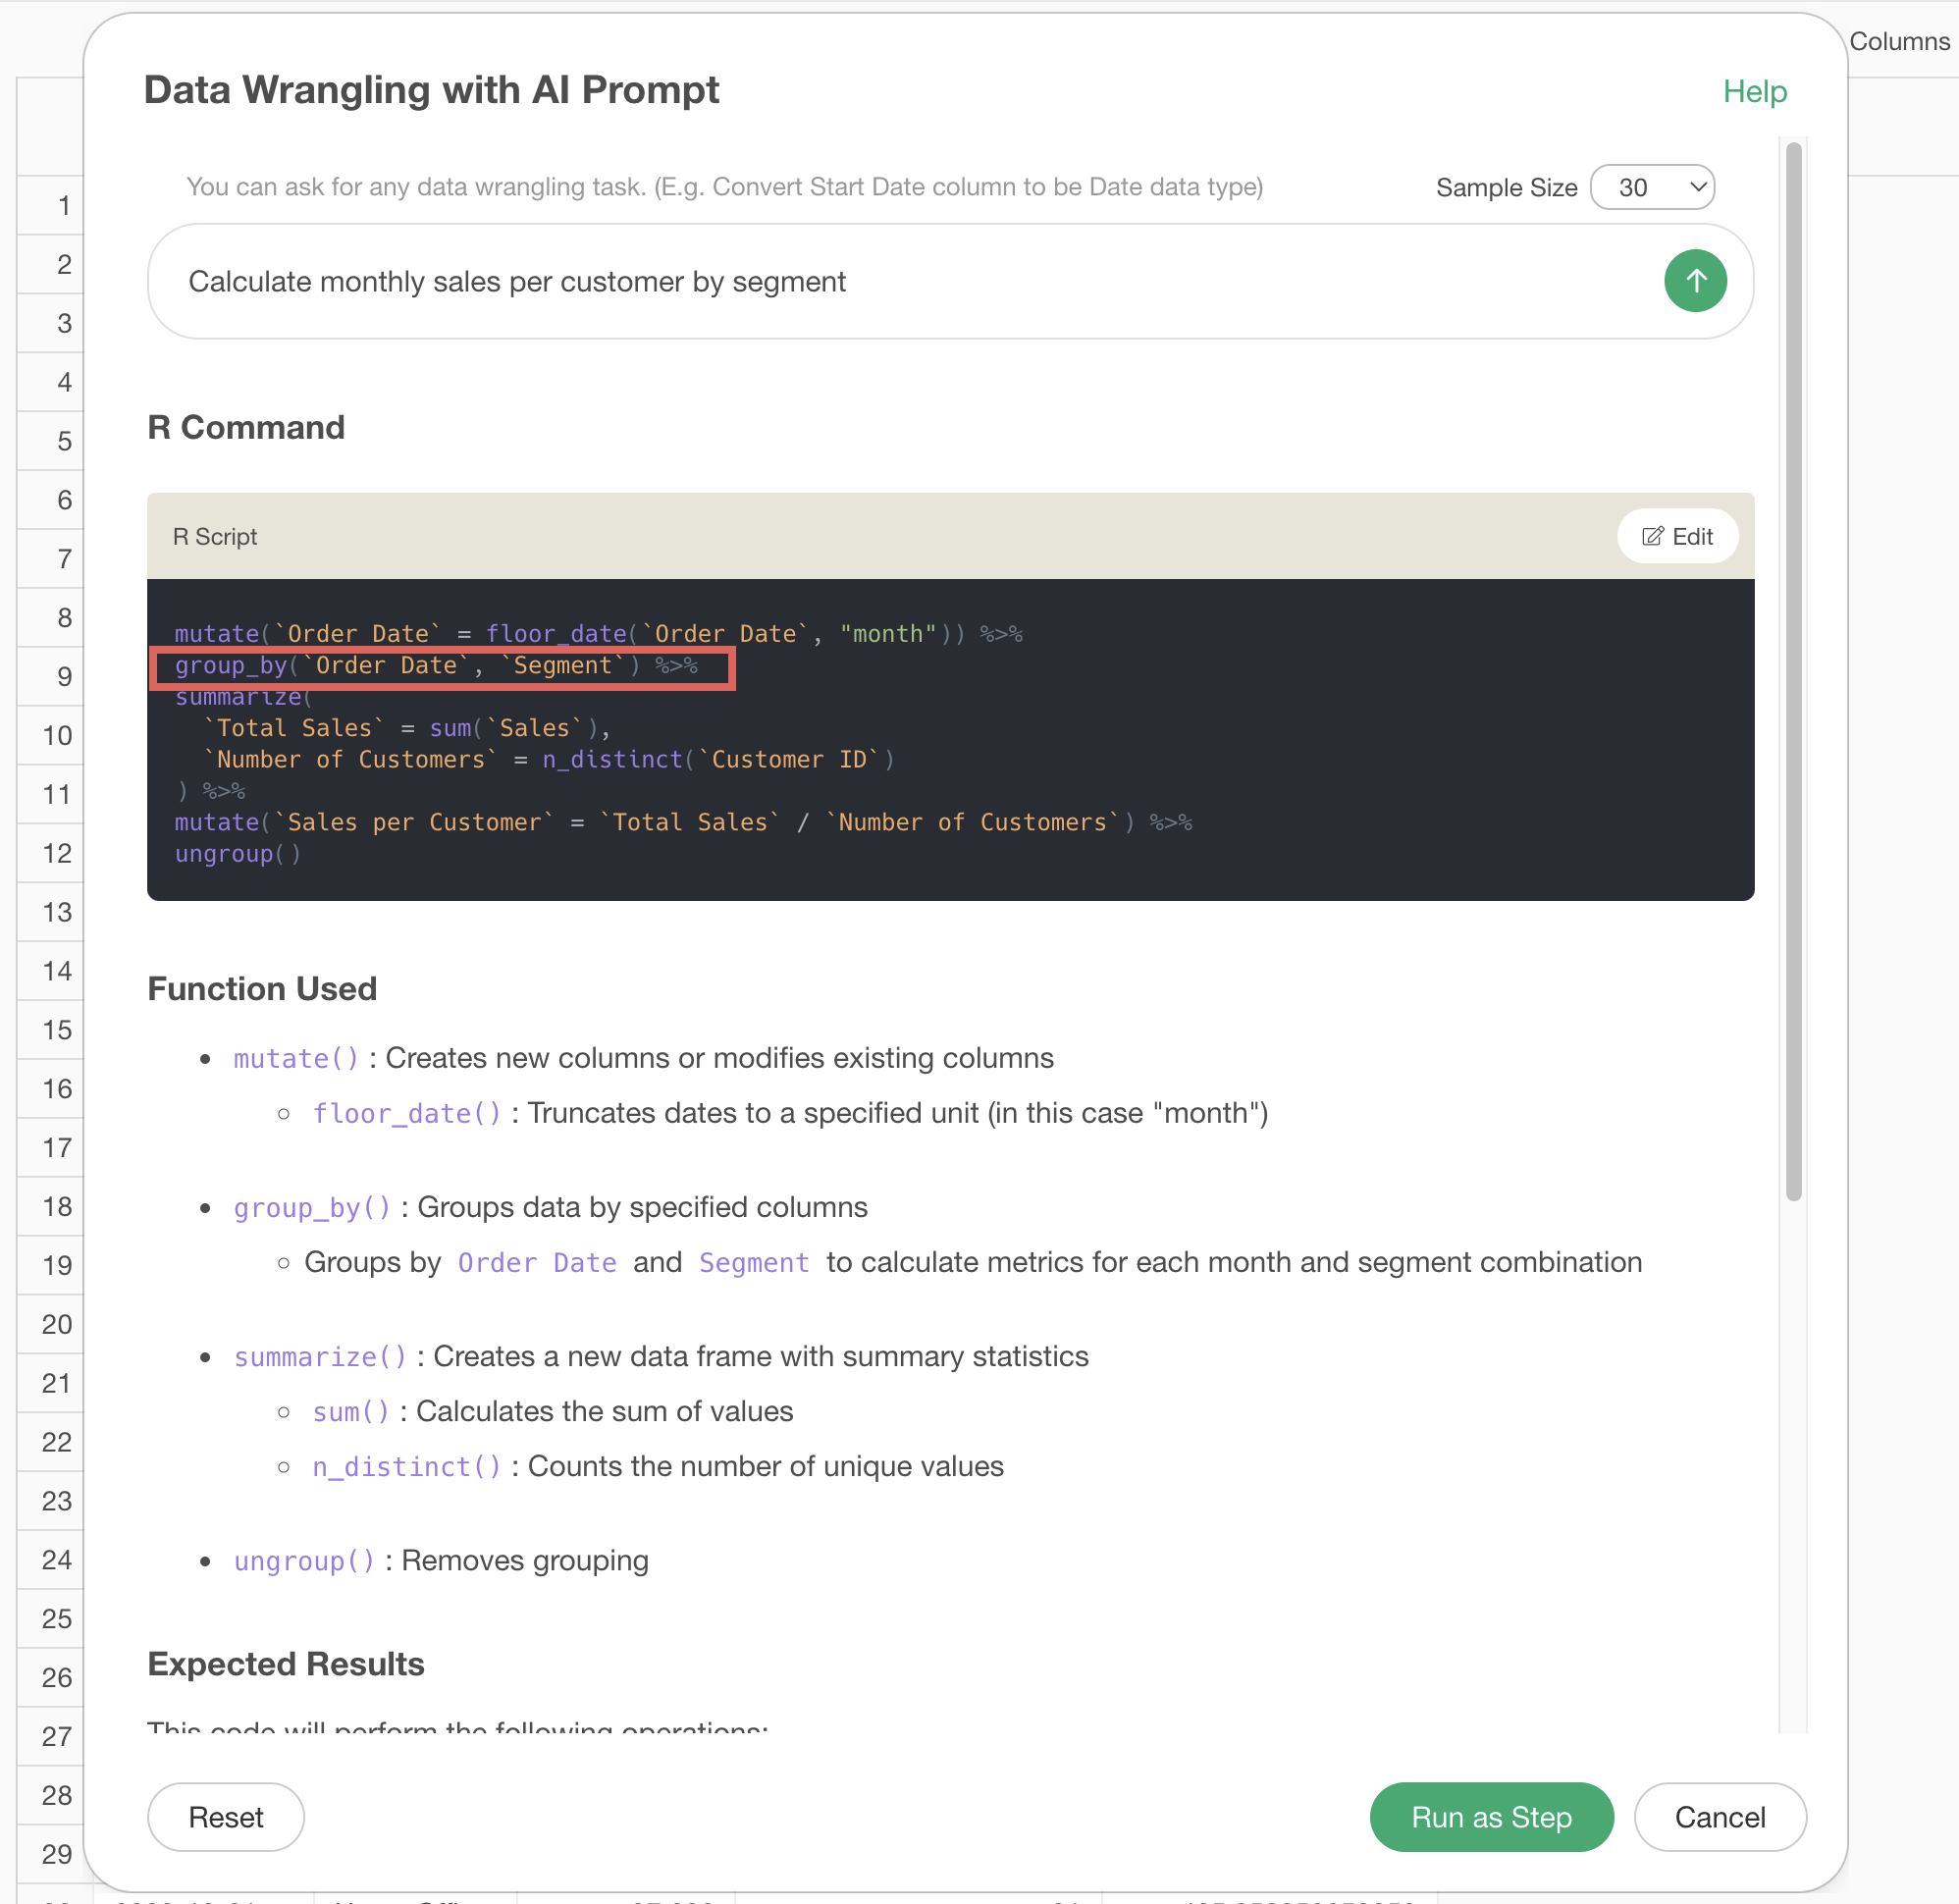
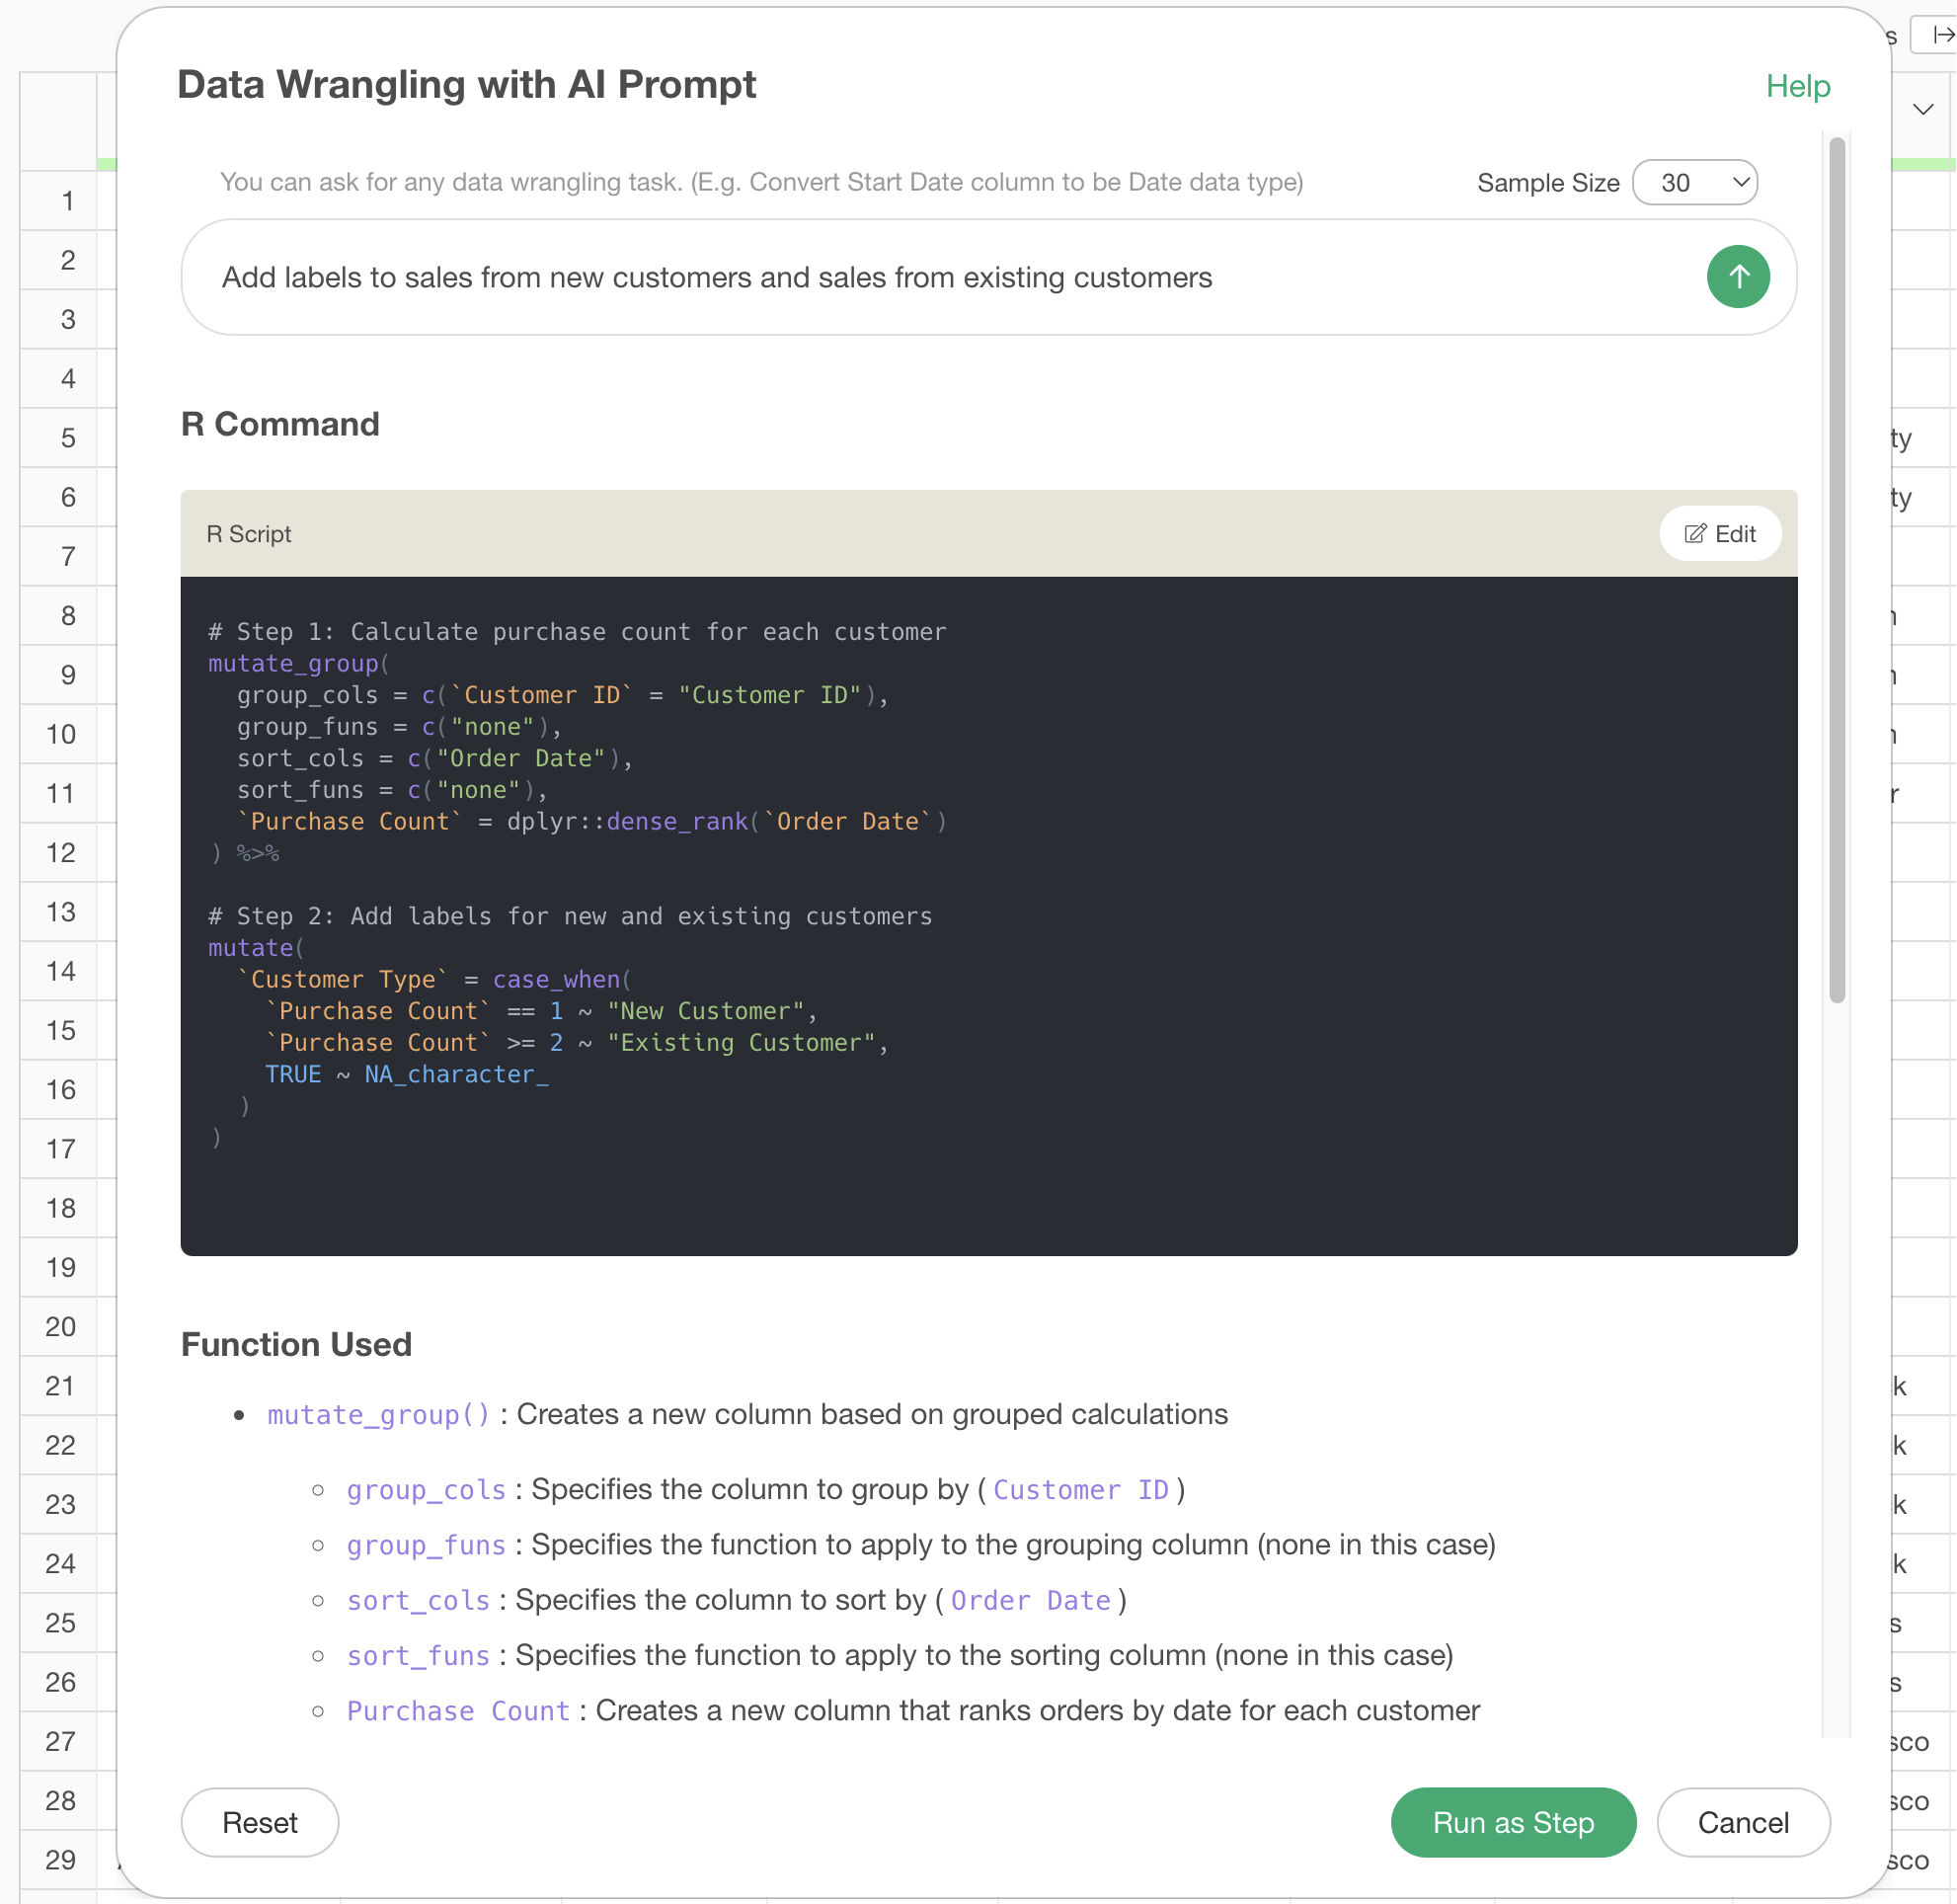
By the way, you can check exactly what the R script for data processing is doing within the AI prompt dialog.
This time, sales per customer was calculated monthly by default.
However, you can further develop this and throw instructions to the prompt to calculate the monthly sales per customer for each customer segment.
First, open the token in the step added by the AI prompt.
When the original prompt dialog opens, re-enter the following text in the prompt:
Calculate monthly sales per customer by segment
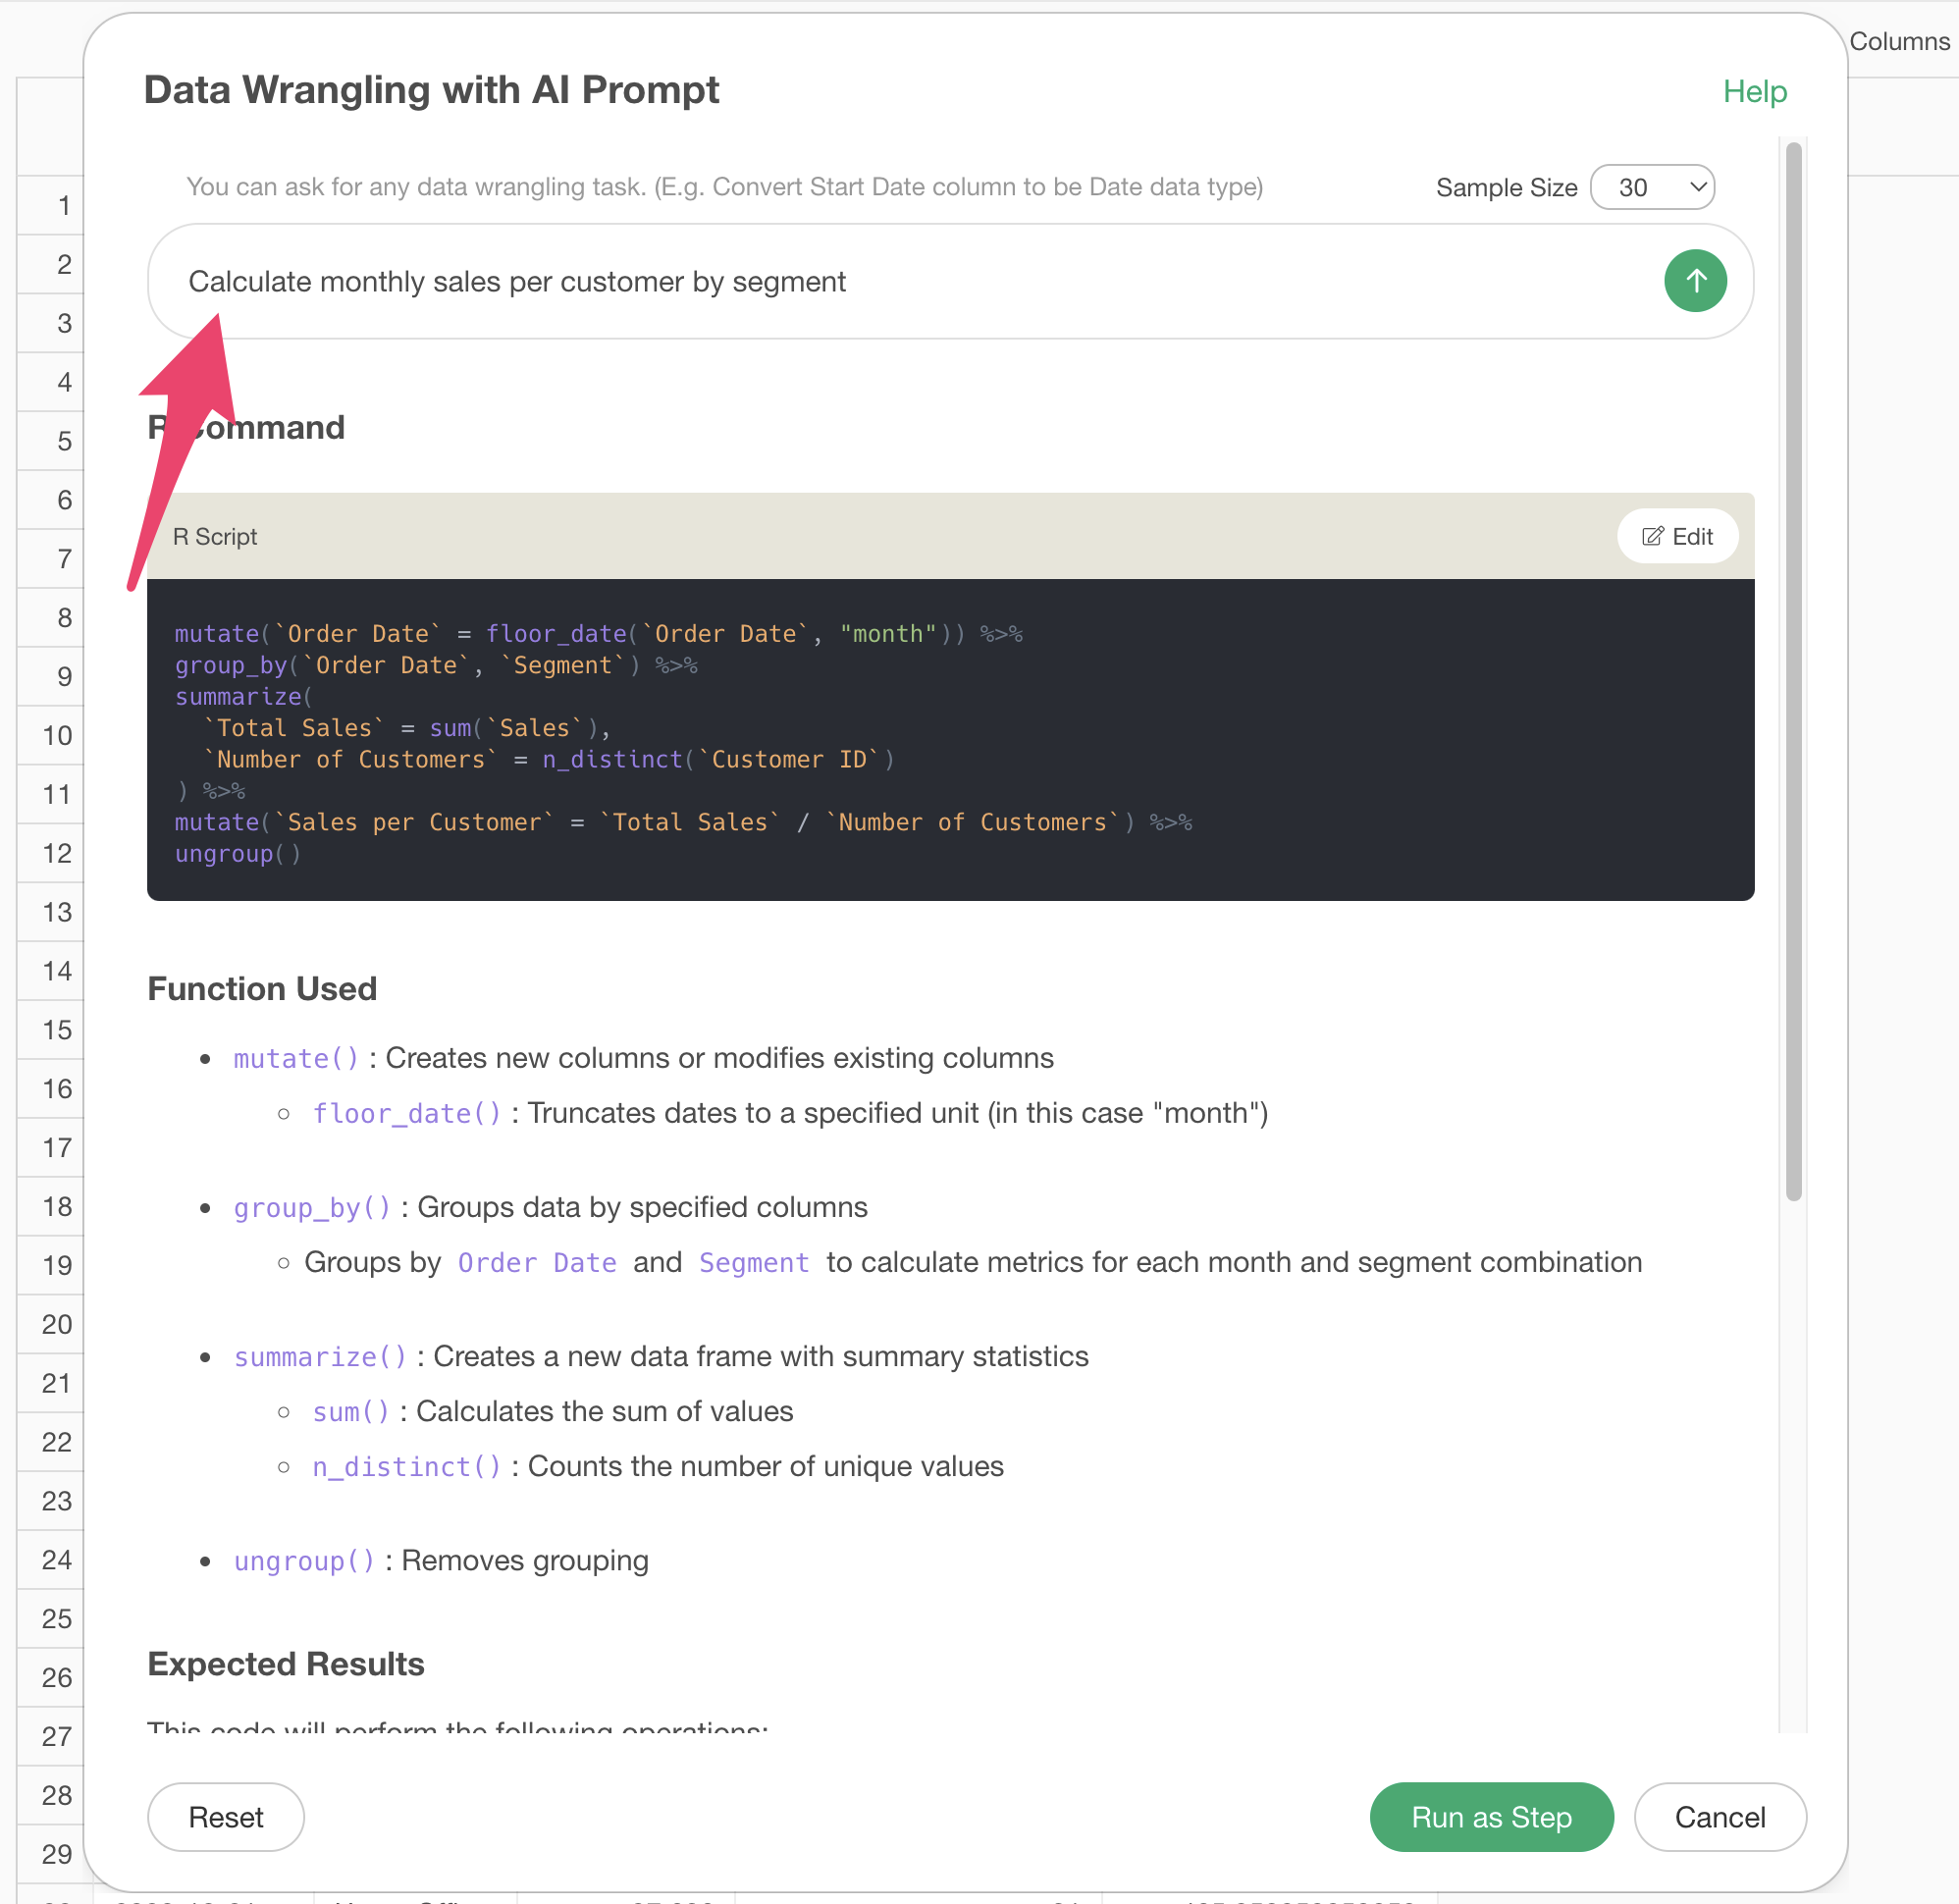
Then, a step to perform calculations for each segment will be added, so go ahead and run it.
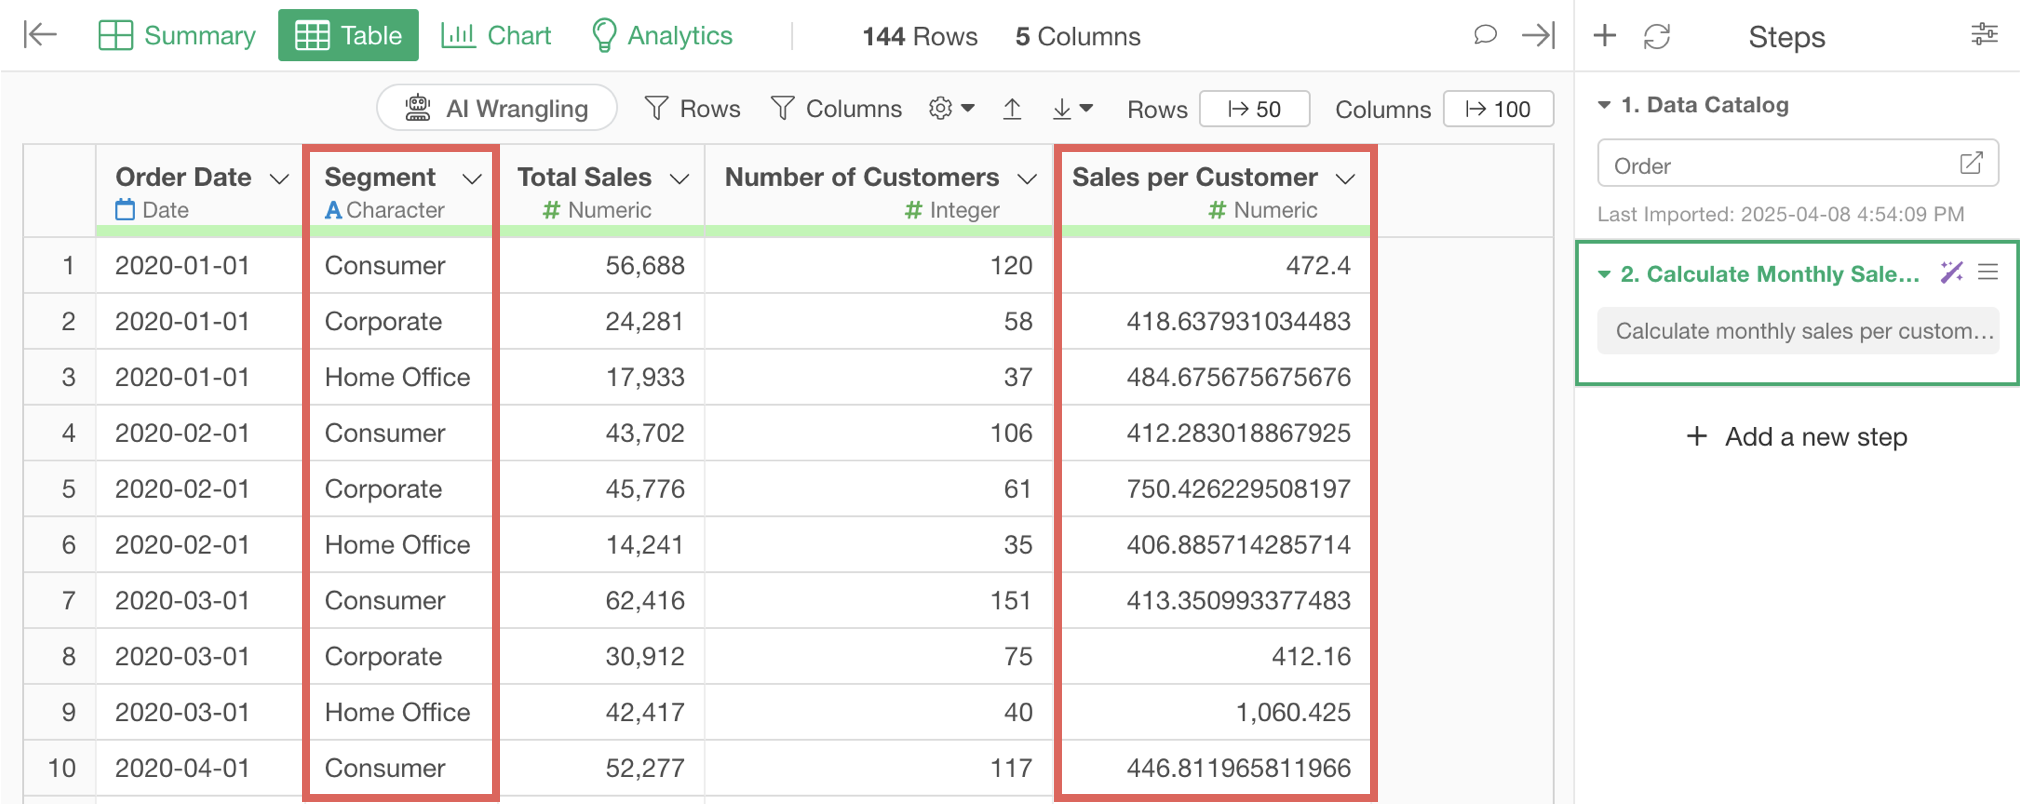
 With
this, we were able to calculate the sales per customer for each
segment.
With
this, we were able to calculate the sales per customer for each
segment.
Sales KPIs that can be created in the same way
If you have data similar to what we used, the following sales KPIs can be created with AI prompt, just like “sales per customer”:
- Sales from new and existing customers
- Sales per customer
- F2(n) conversion rate
2. Creating Operating Profit Margin
The second pattern is one where you should prepare the data in a certain form before creating business metrics.
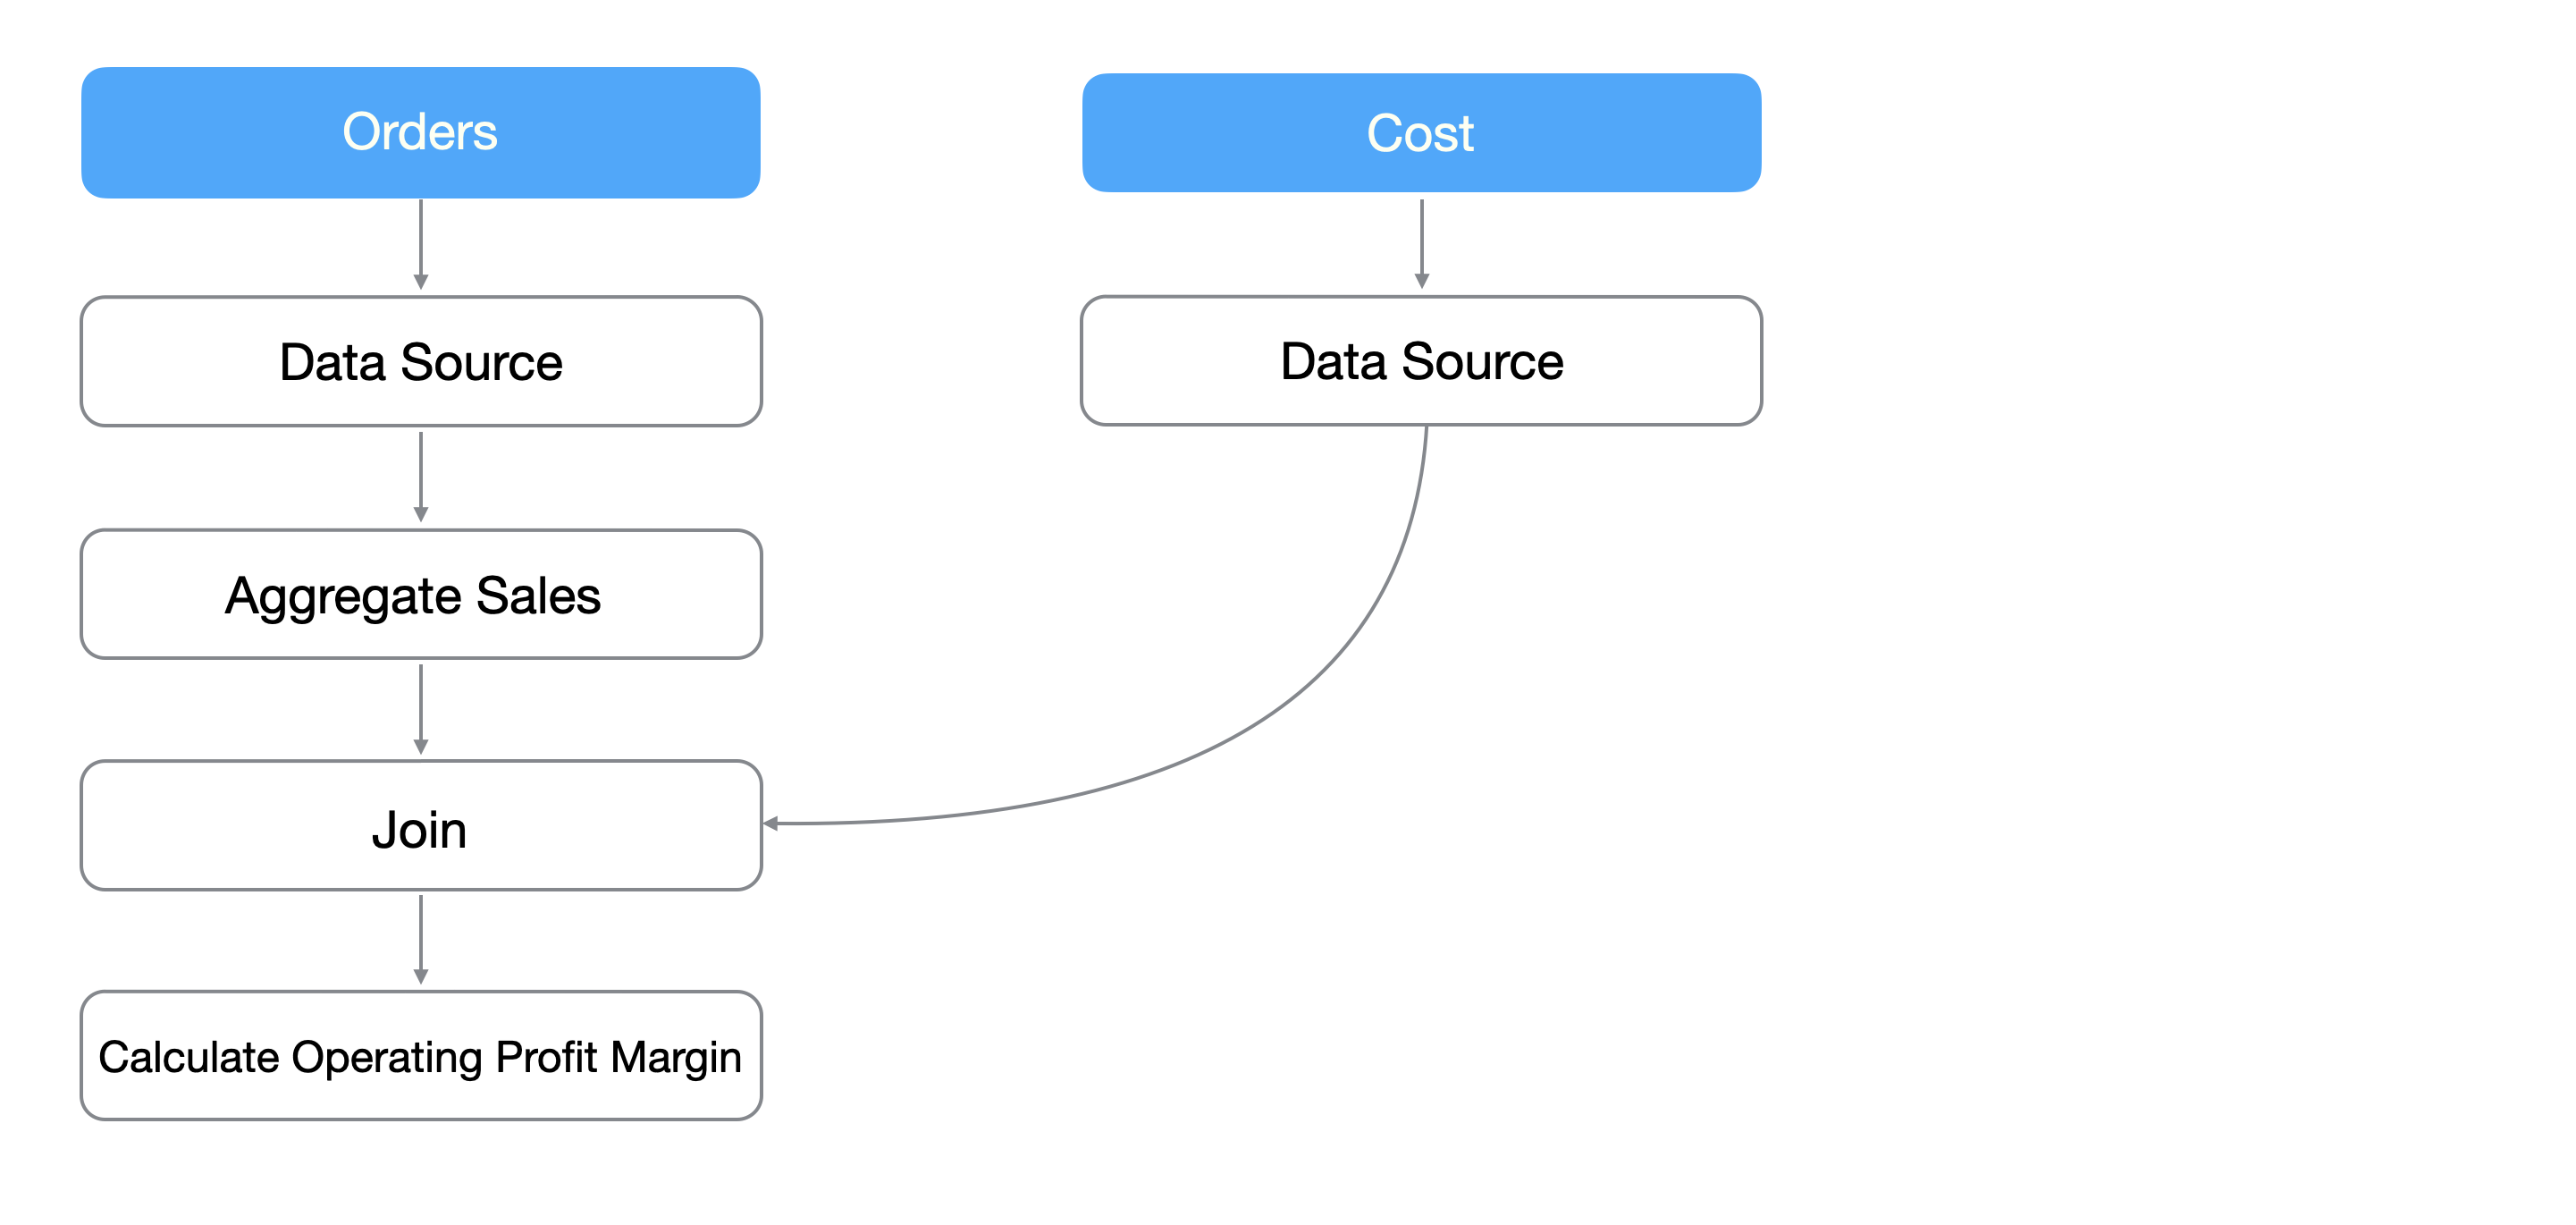
For example, to calculate monthly operating profit margin using the formula below, you need to calculate based on sales and cost data.
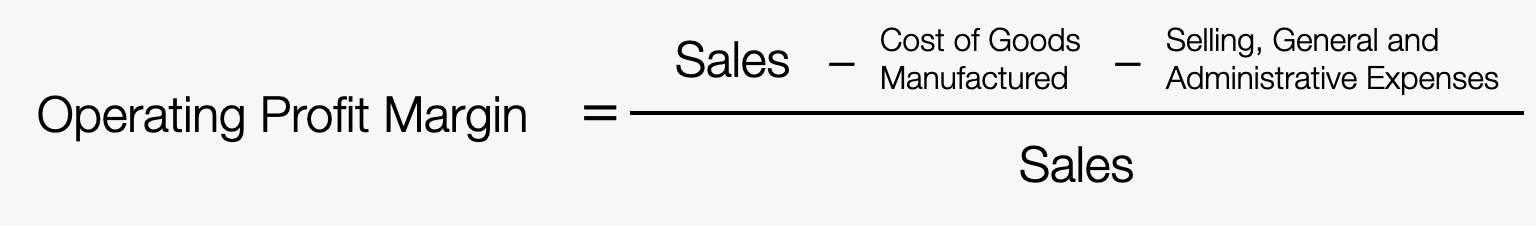
However, since aggregated sales data may not be readily available, or sales and cost data may be managed separately, in such cases, you need to aggregate data by month, combine sales and cost data, and then calculate the monthly operating profit margin.
Using AI prompts, you can easily execute these processes without specialized knowledge of data processing.
From here, we’ll introduce how to calculate operating profit margin using AI prompts.
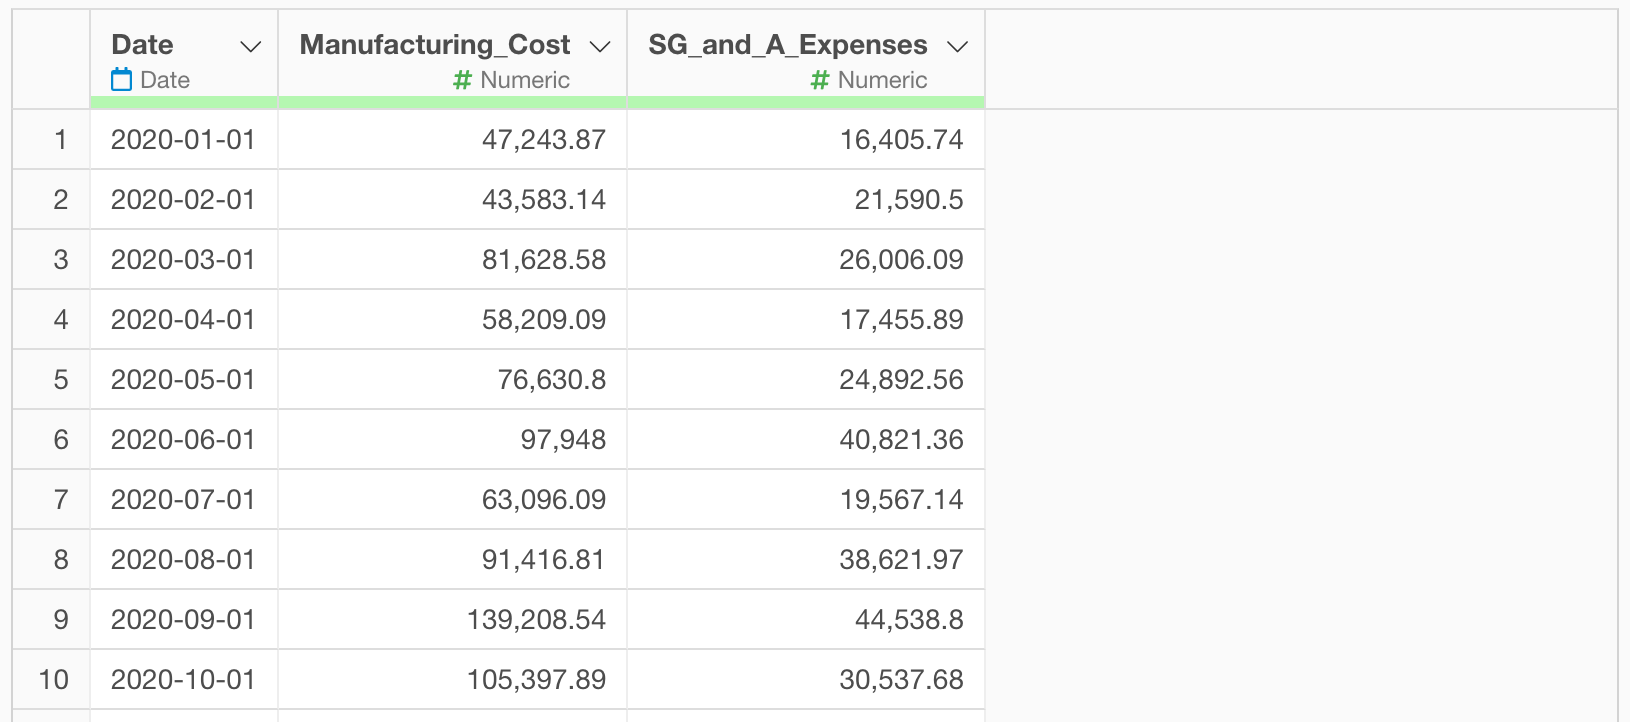
In this example, we’ll calculate operating profit margin using order data where each row represents a single order, and monthly cost data. You can download the sample data from the following links:
1. Aggregate sales by month
Since we’re starting from the state where we’ve already calculated monthly sales per customer, we don’t need to aggregate sales by month.
2. Combining cost data
Next, we’ll combine the monthly cost data with the sales data.
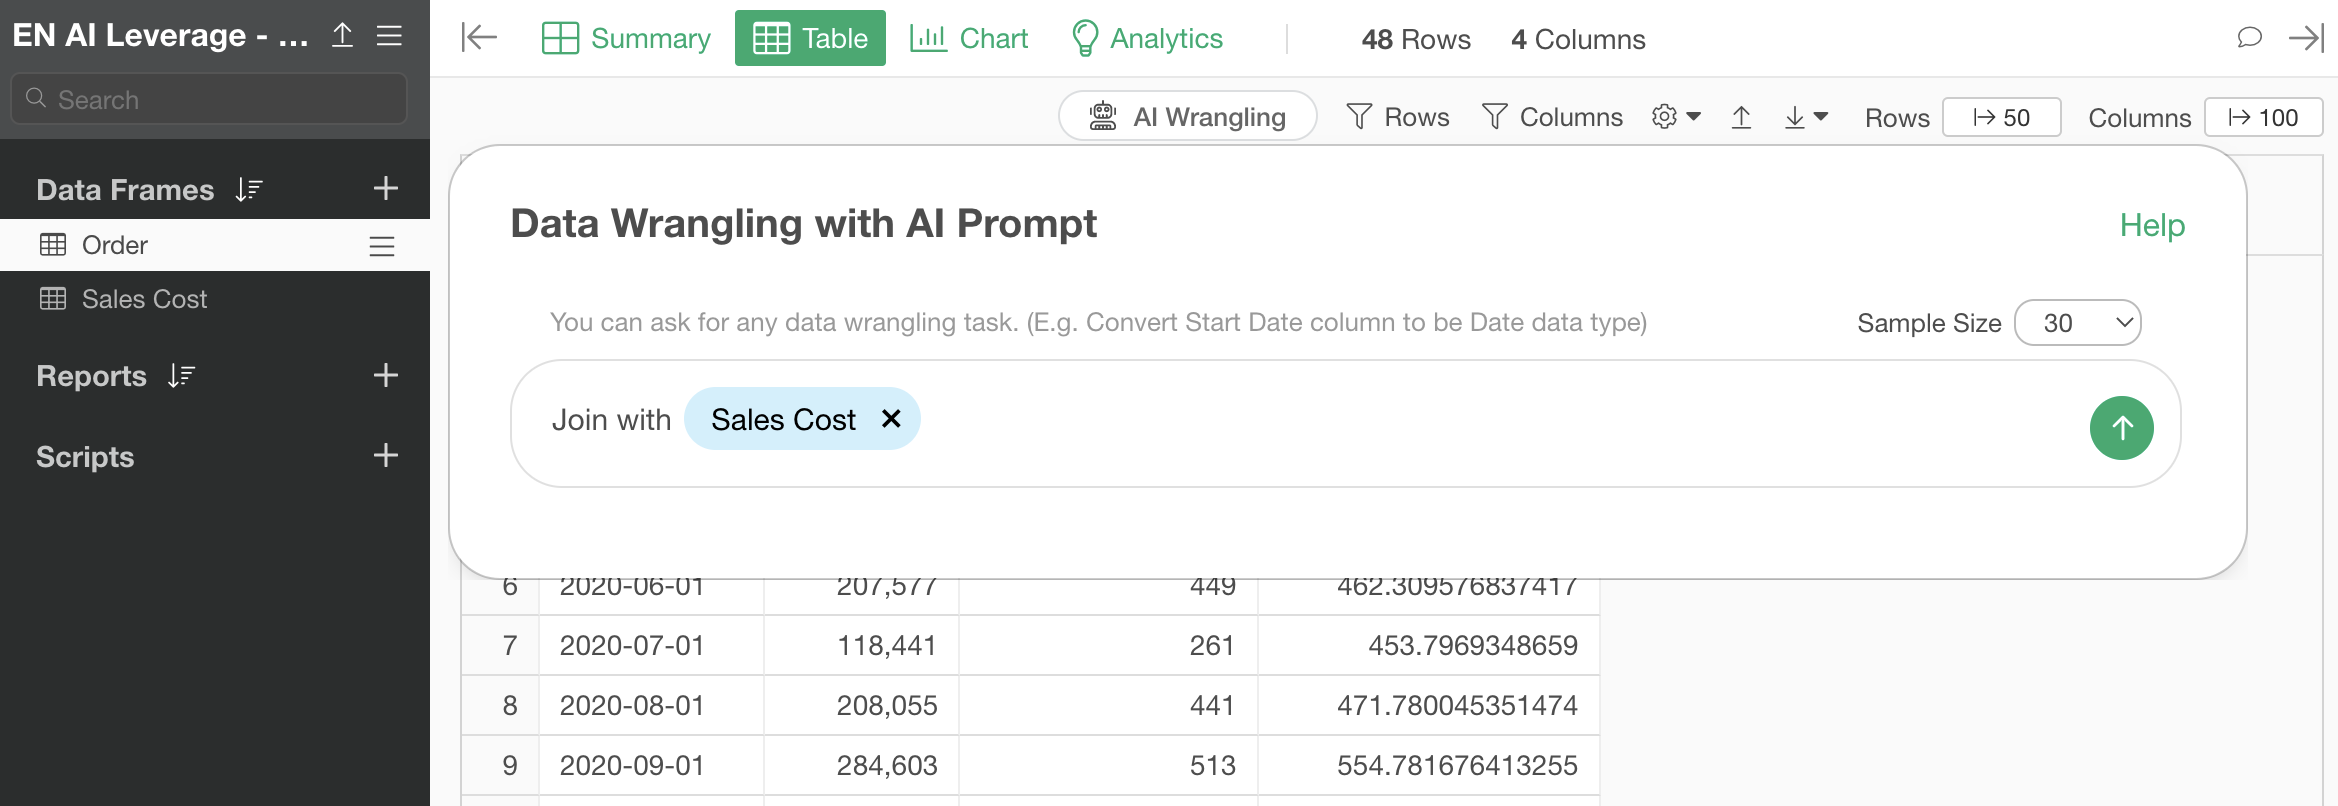
To combine two datasets, type “$” in the AI prompt dialog.
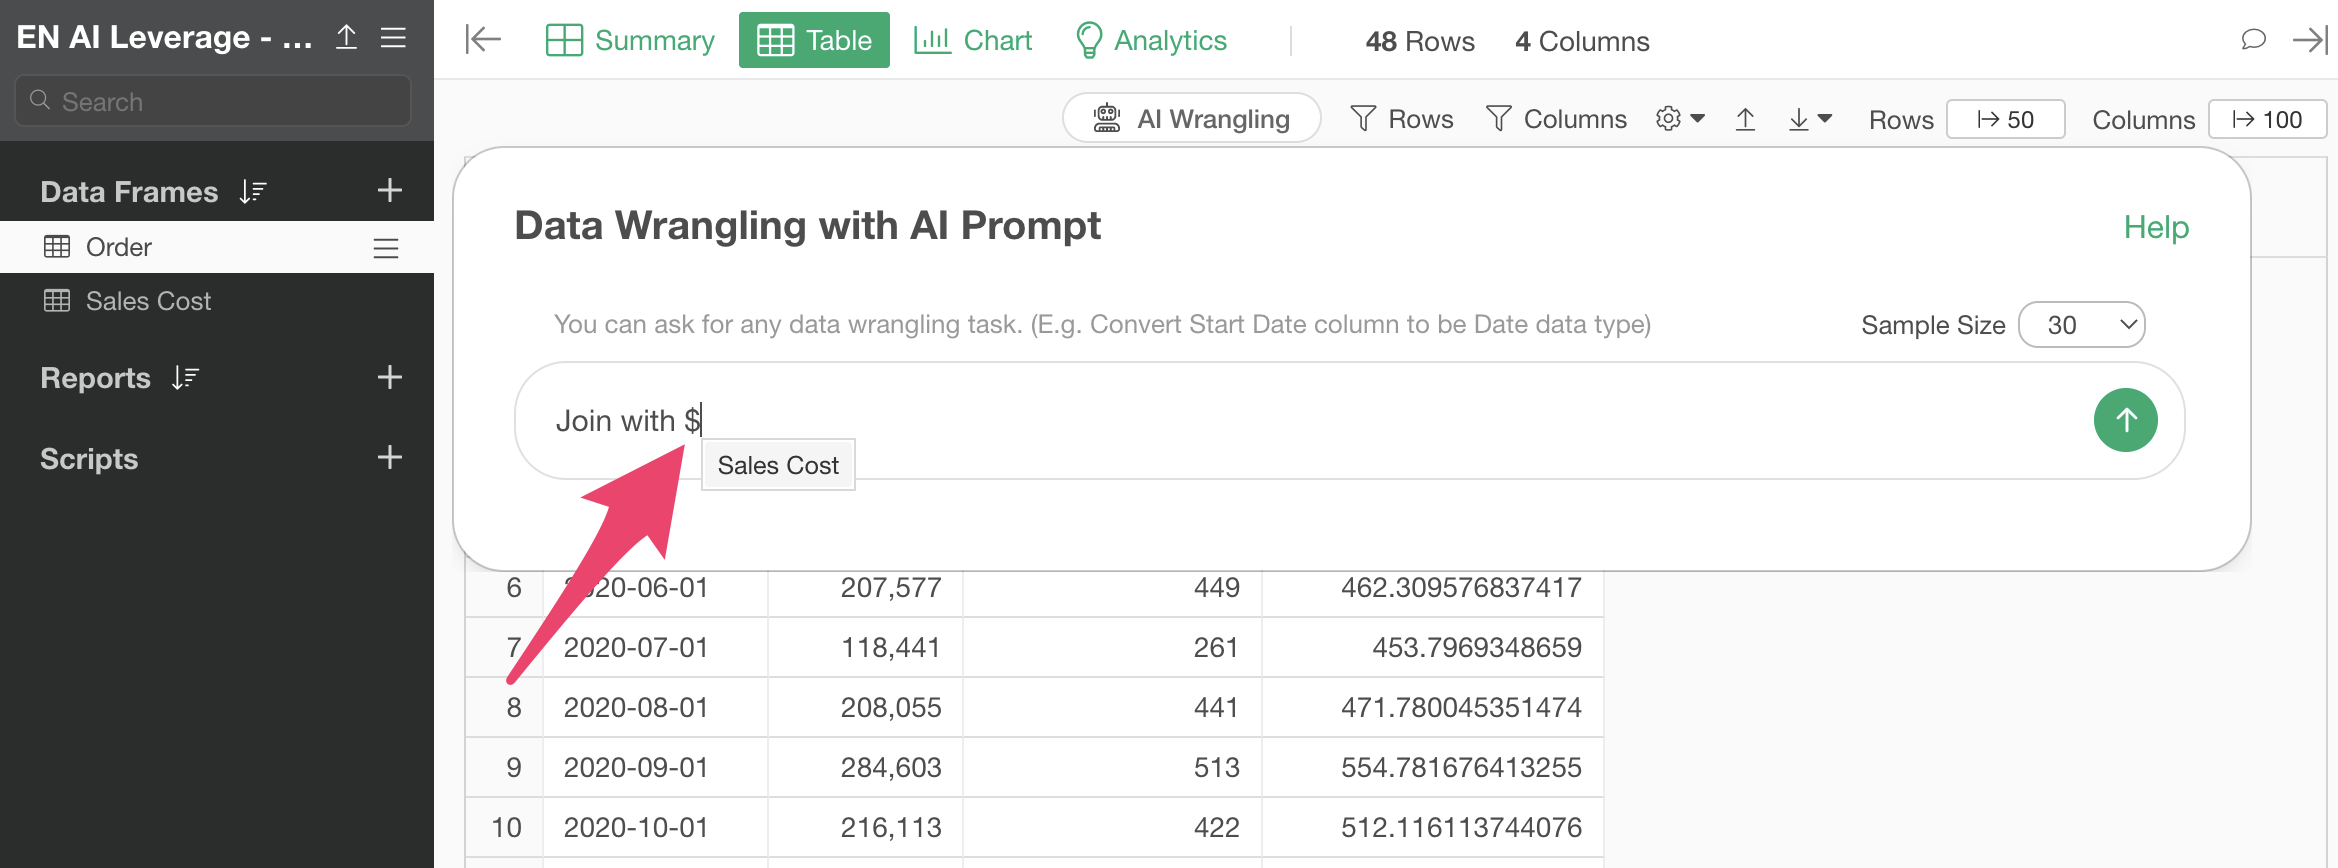
This will display all data frames in the same project, allowing you to select the data frame you want to process.
Select the cost data frame, enter the following text in the prompt window, and execute:
Join with Sales Cost
This will generate R commands to combine the two datasets, which you can then execute.
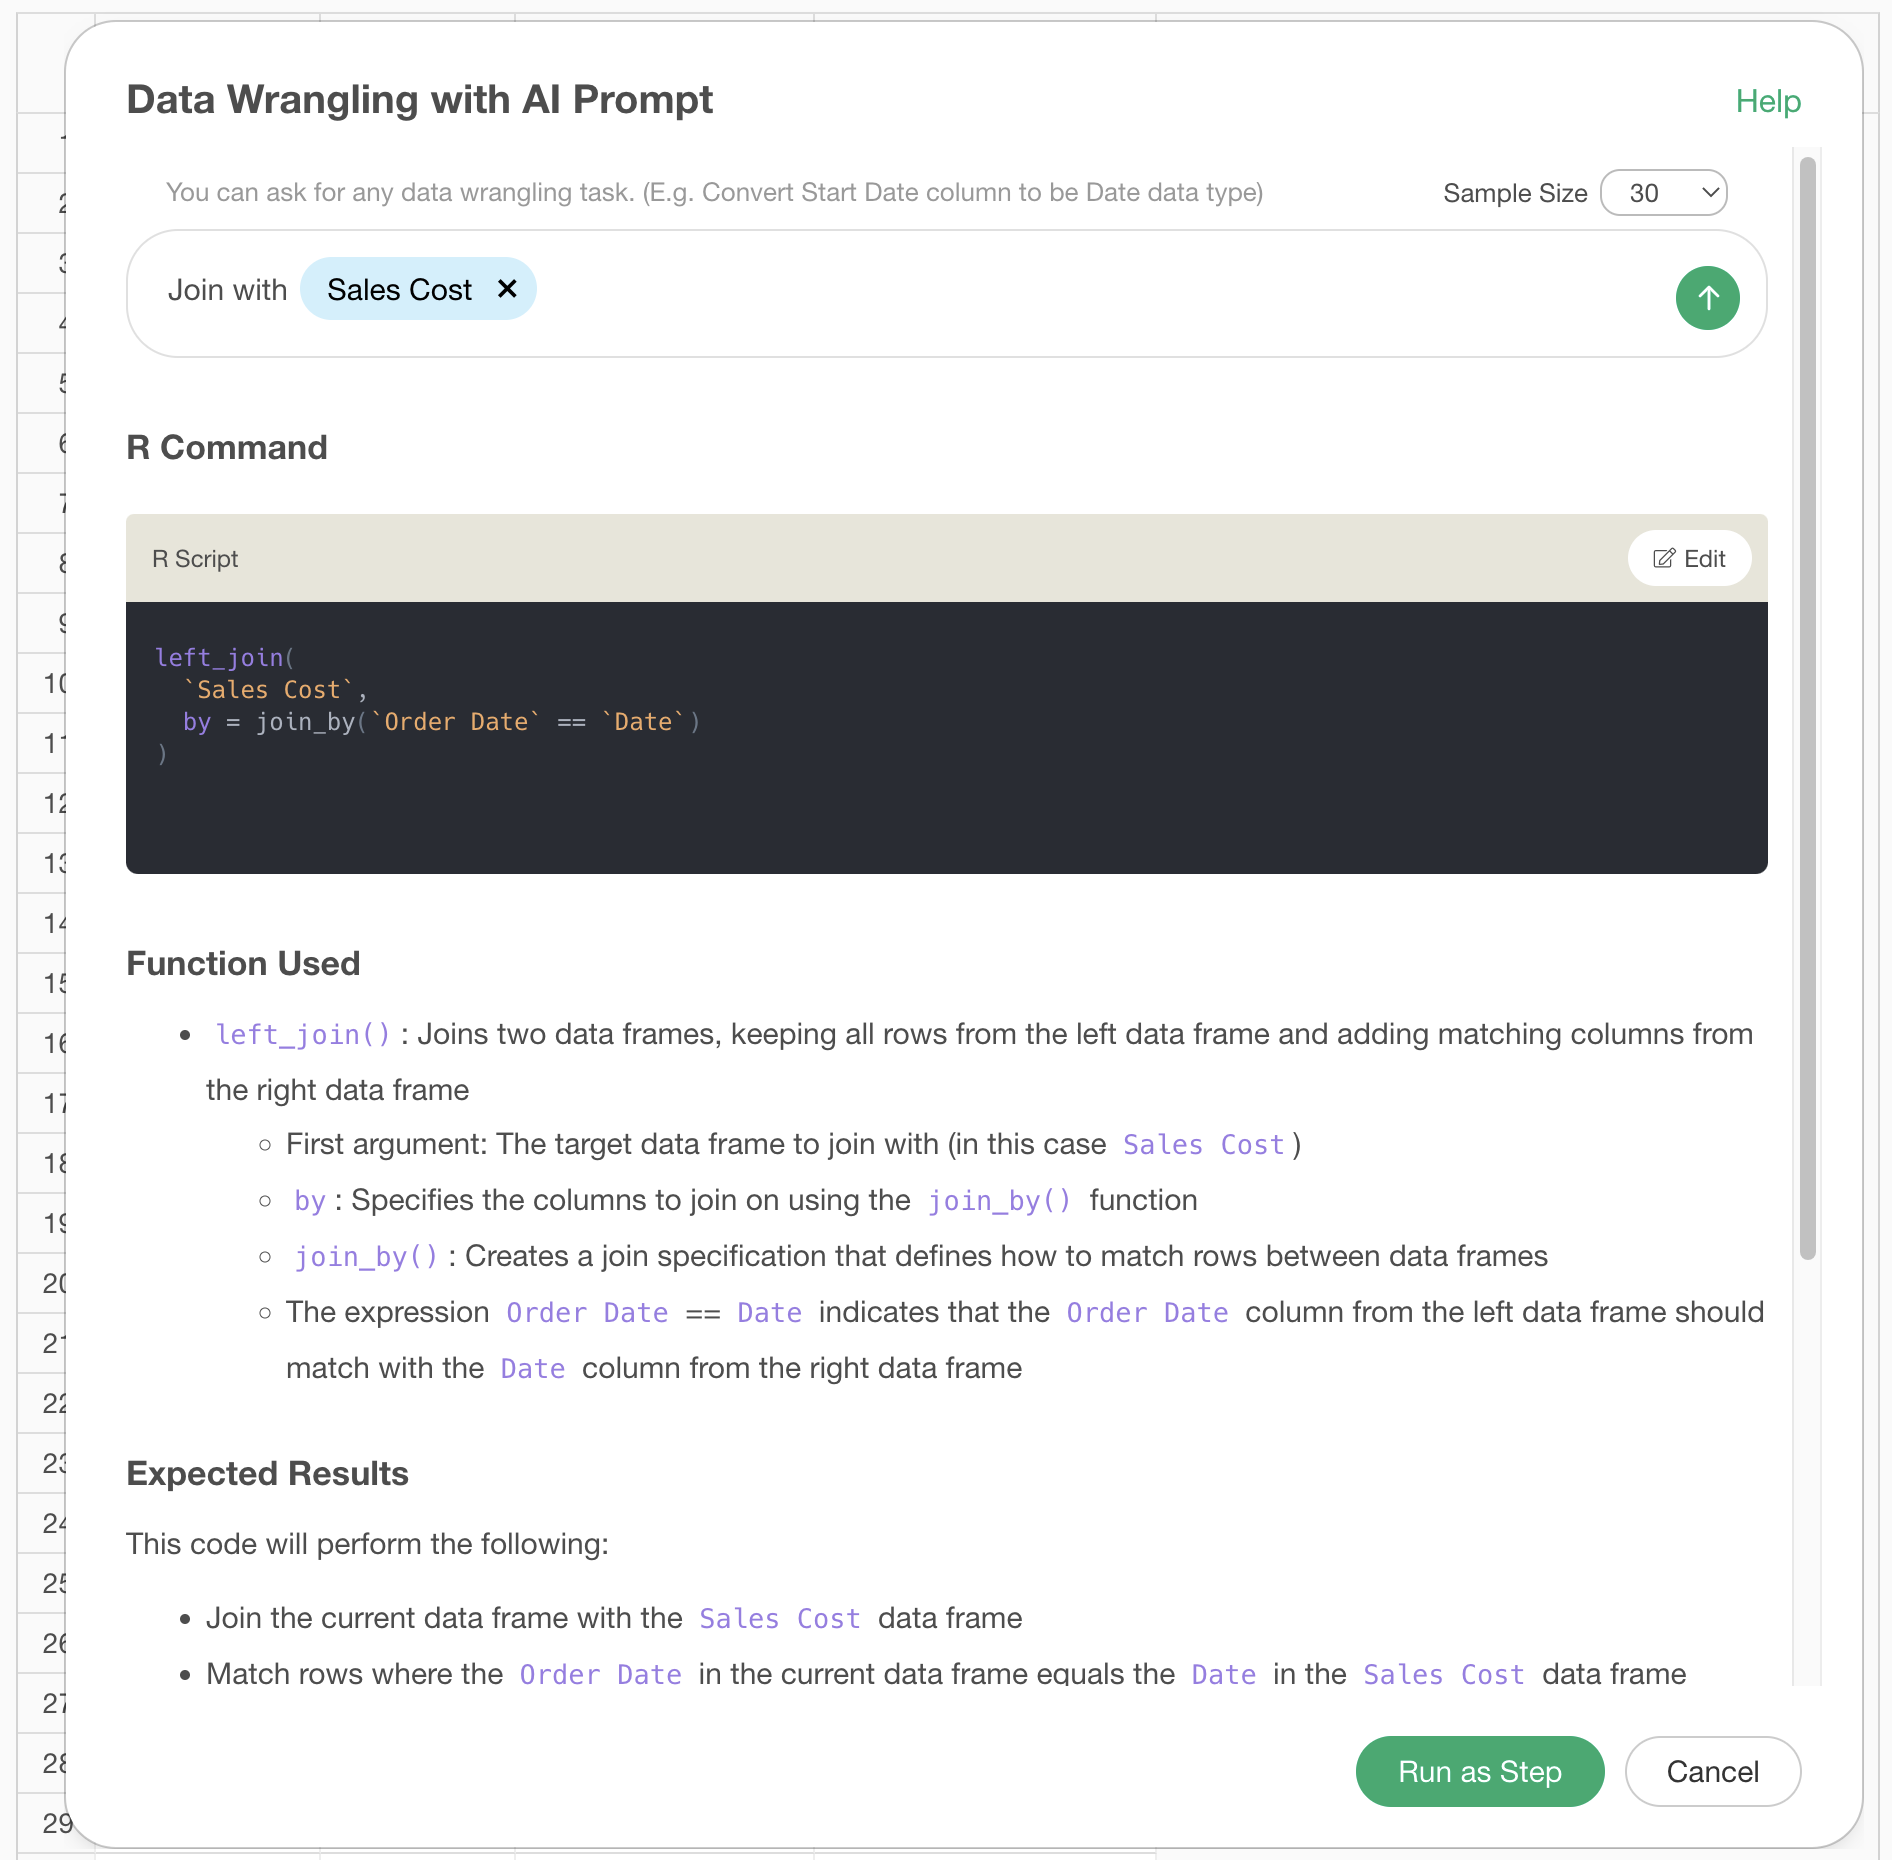
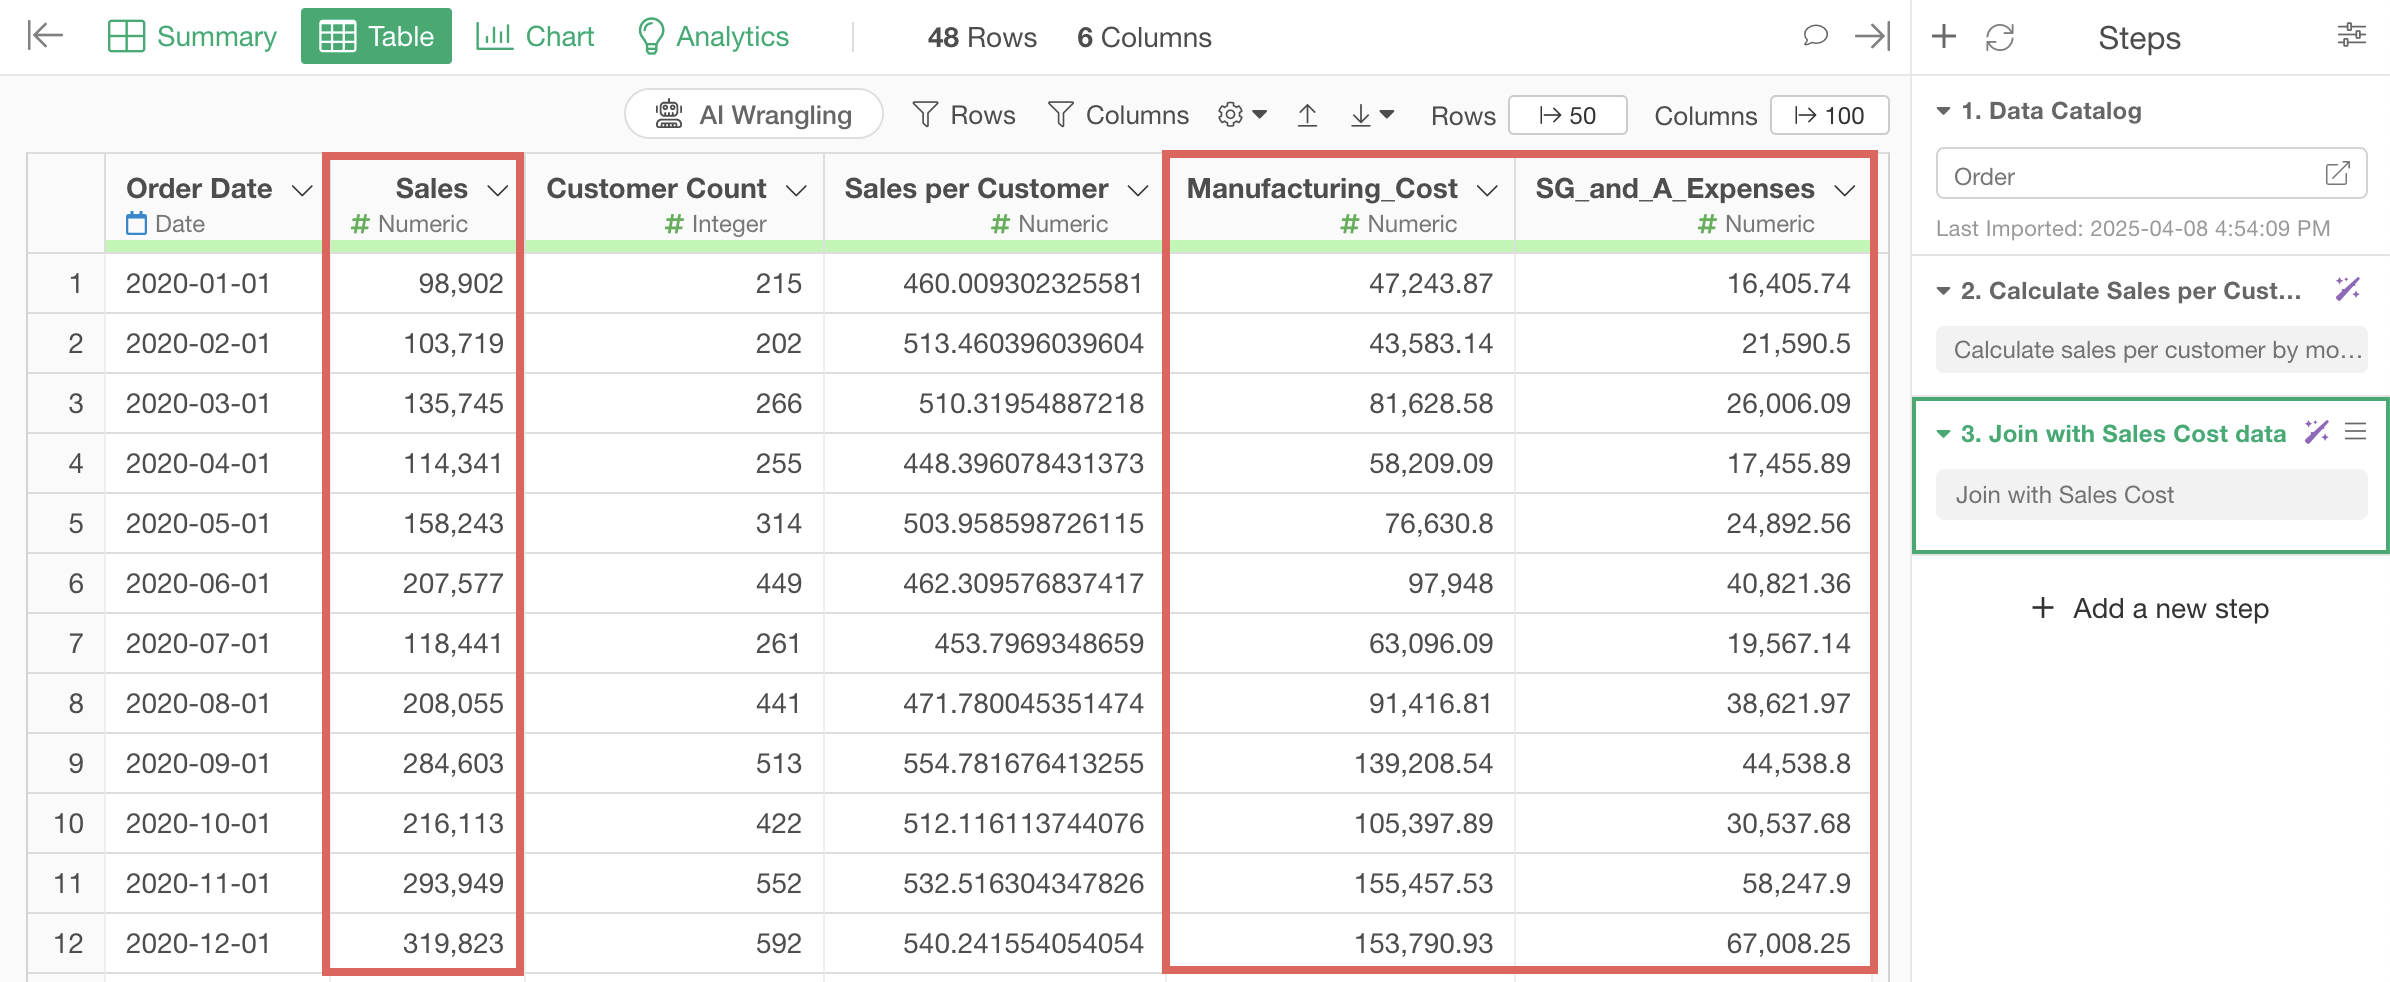
This allows you to combine sales and cost information needed to calculate operating profit margin into a single data frame.
3. Calculating operating profit margin
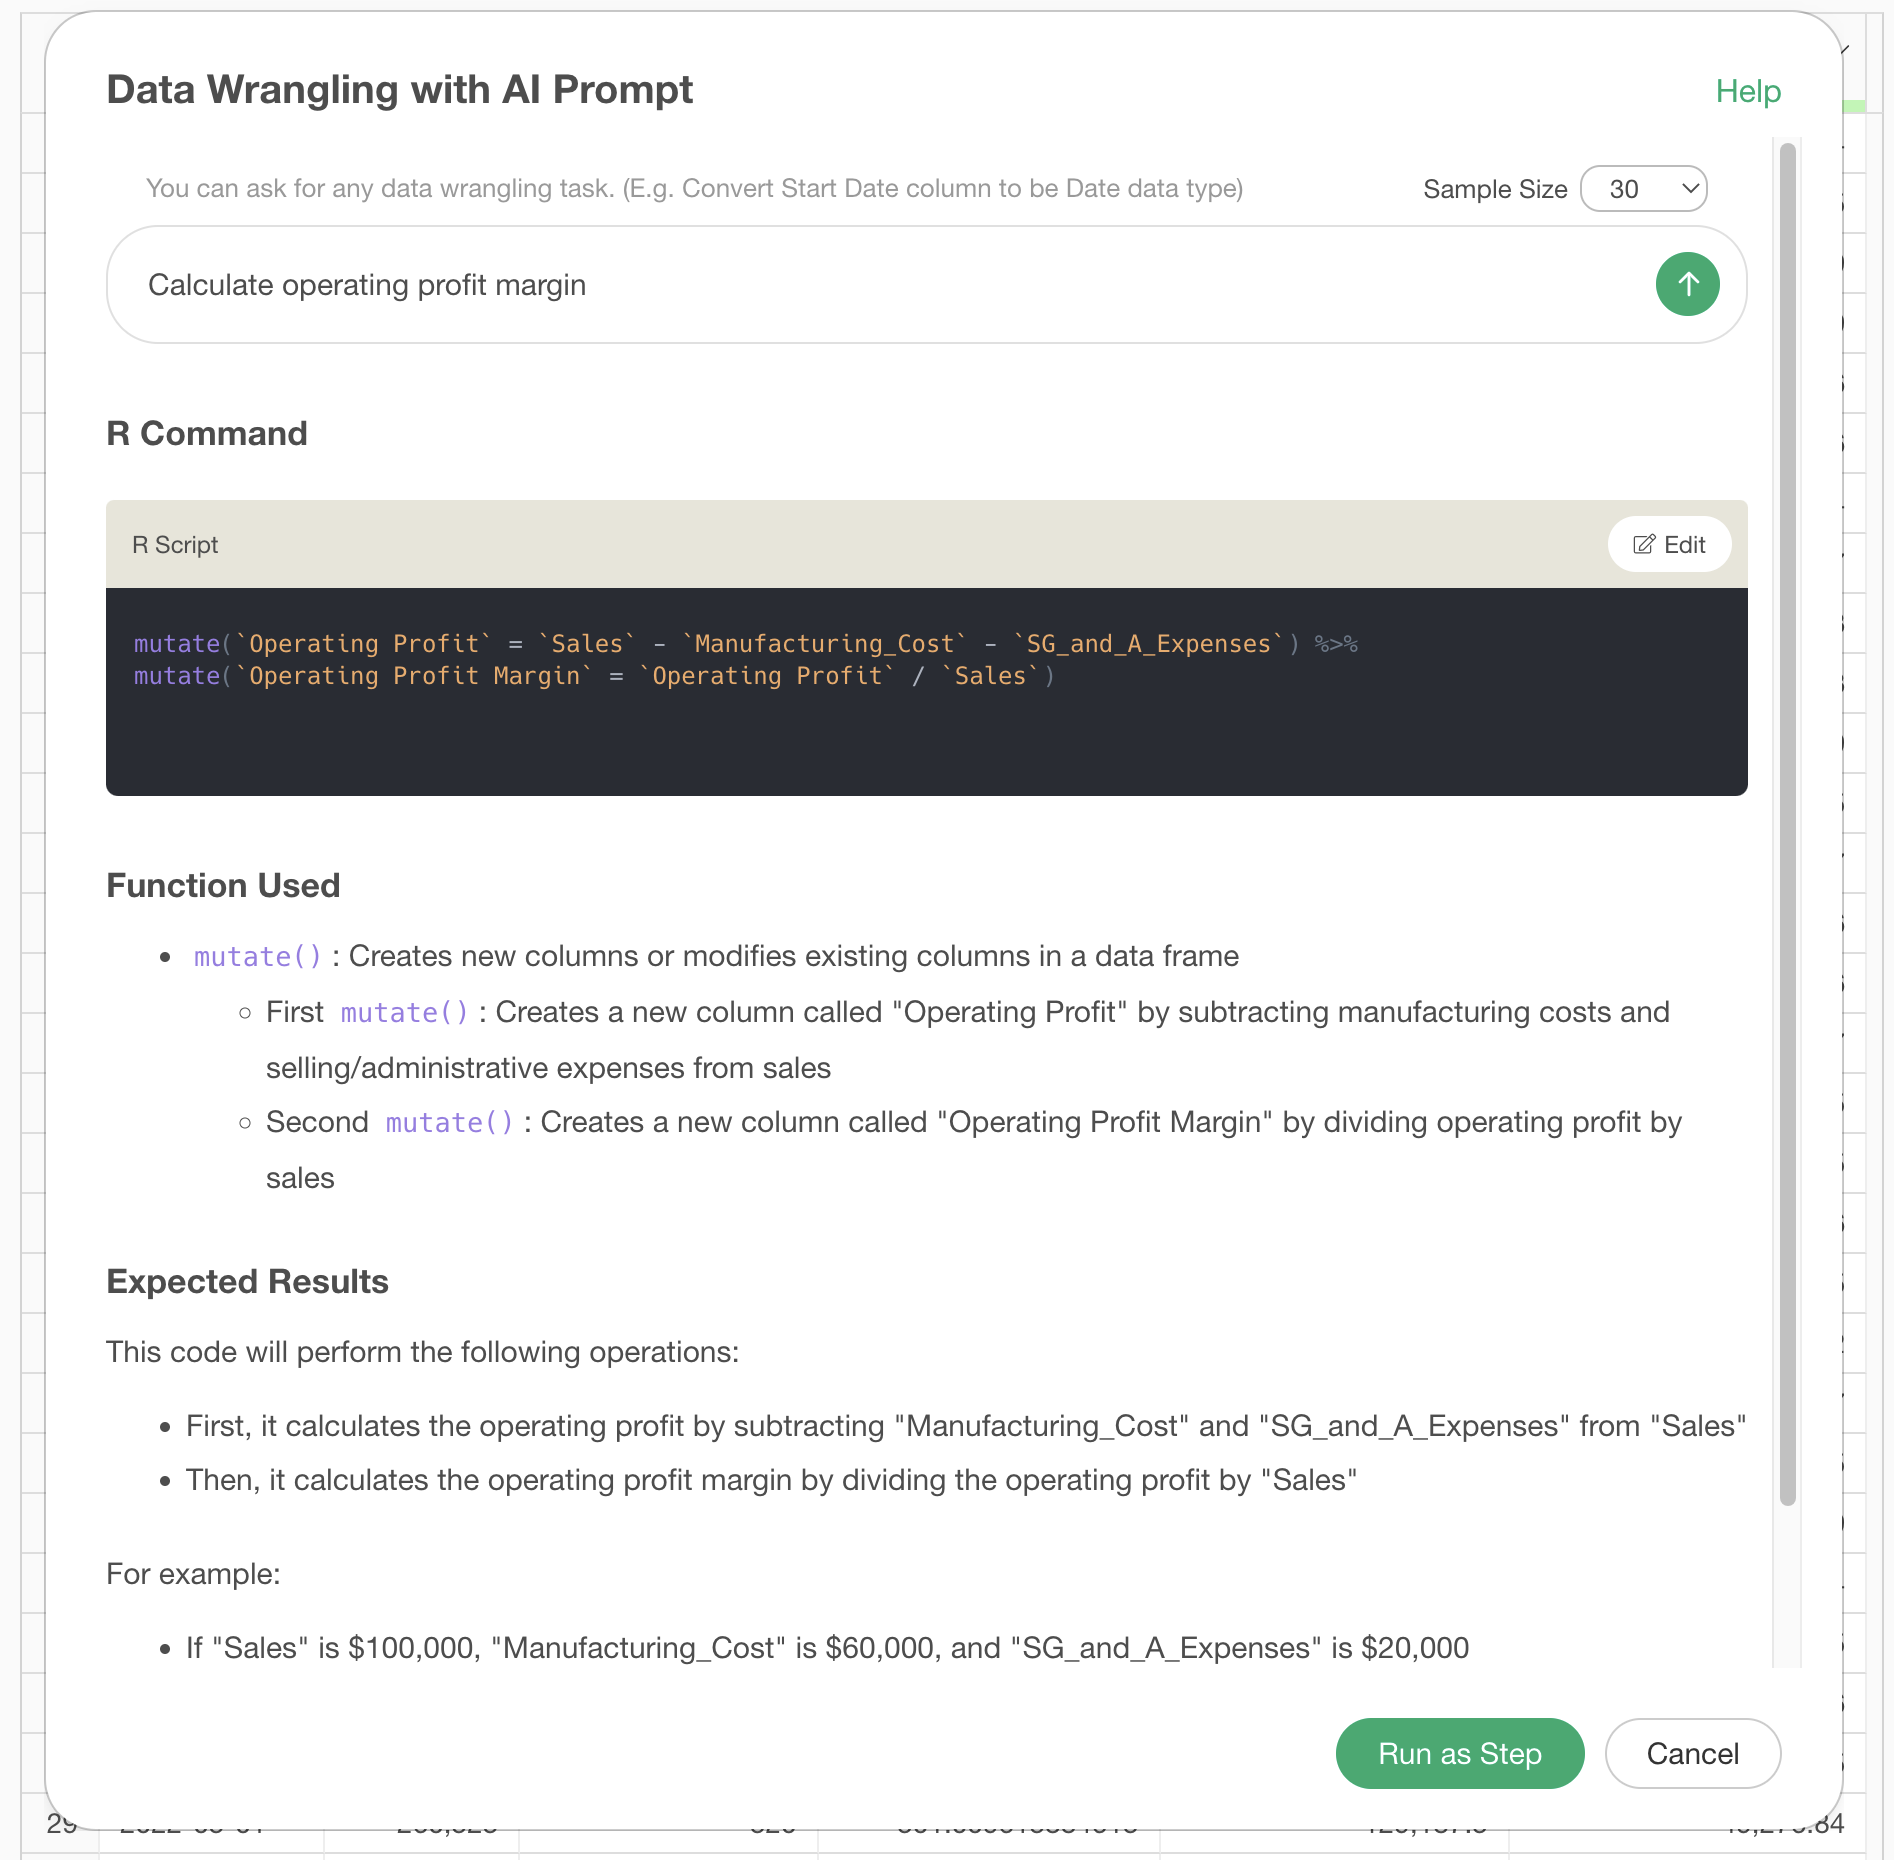
Finally, we’ll calculate the operating profit margin. Display the AI prompt window again, enter the following text, and execute:
Calculate operating profit margin
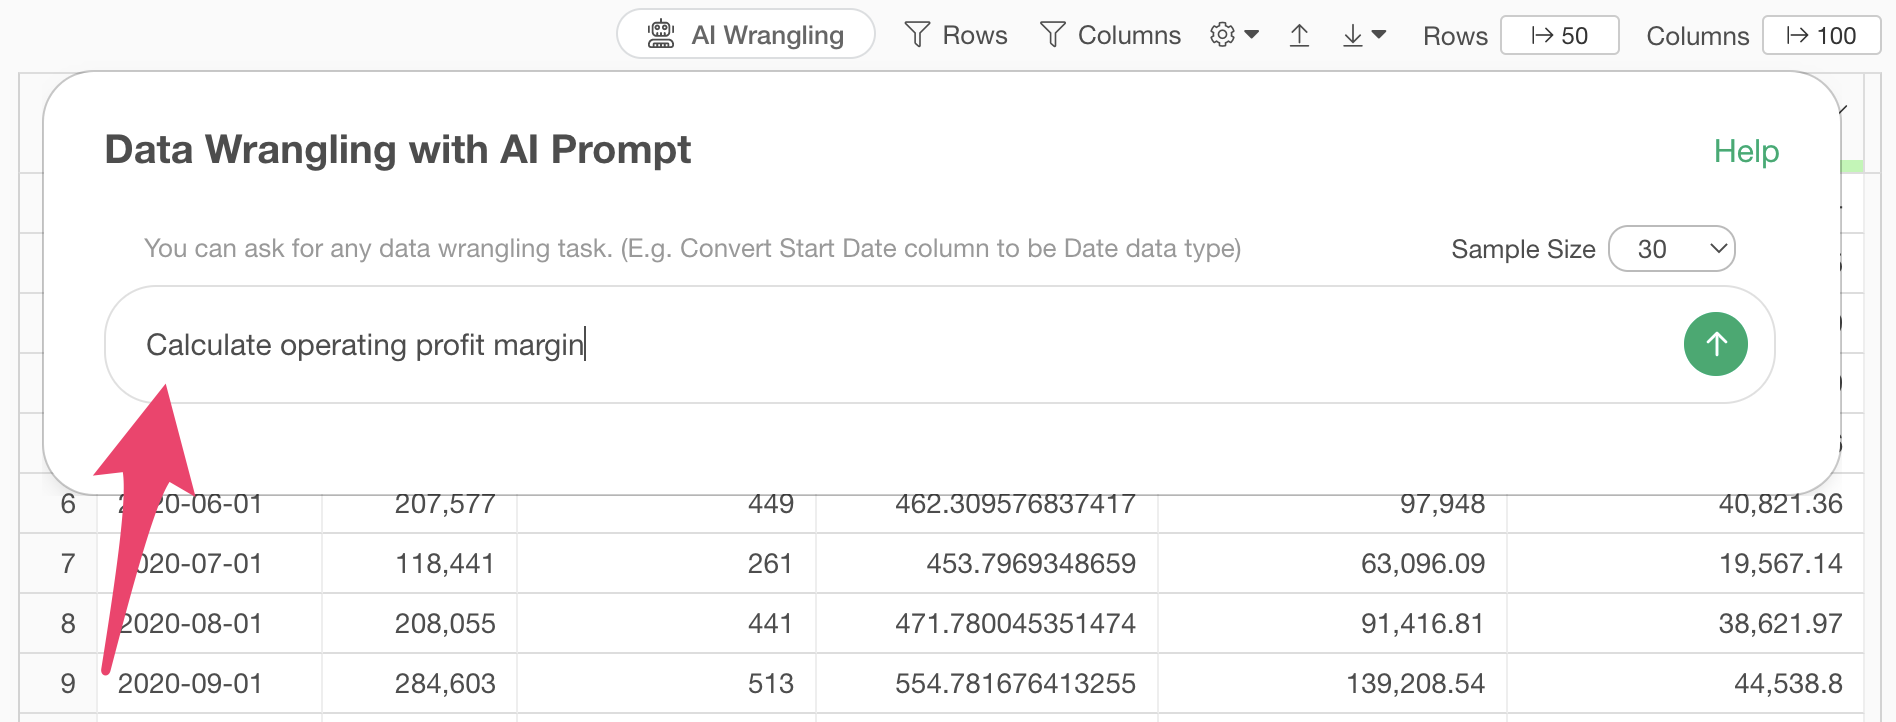
This will generate R codes to calculate operating profit margin, so run them.
With this, we were able to calculate the monthly operating profit margin.
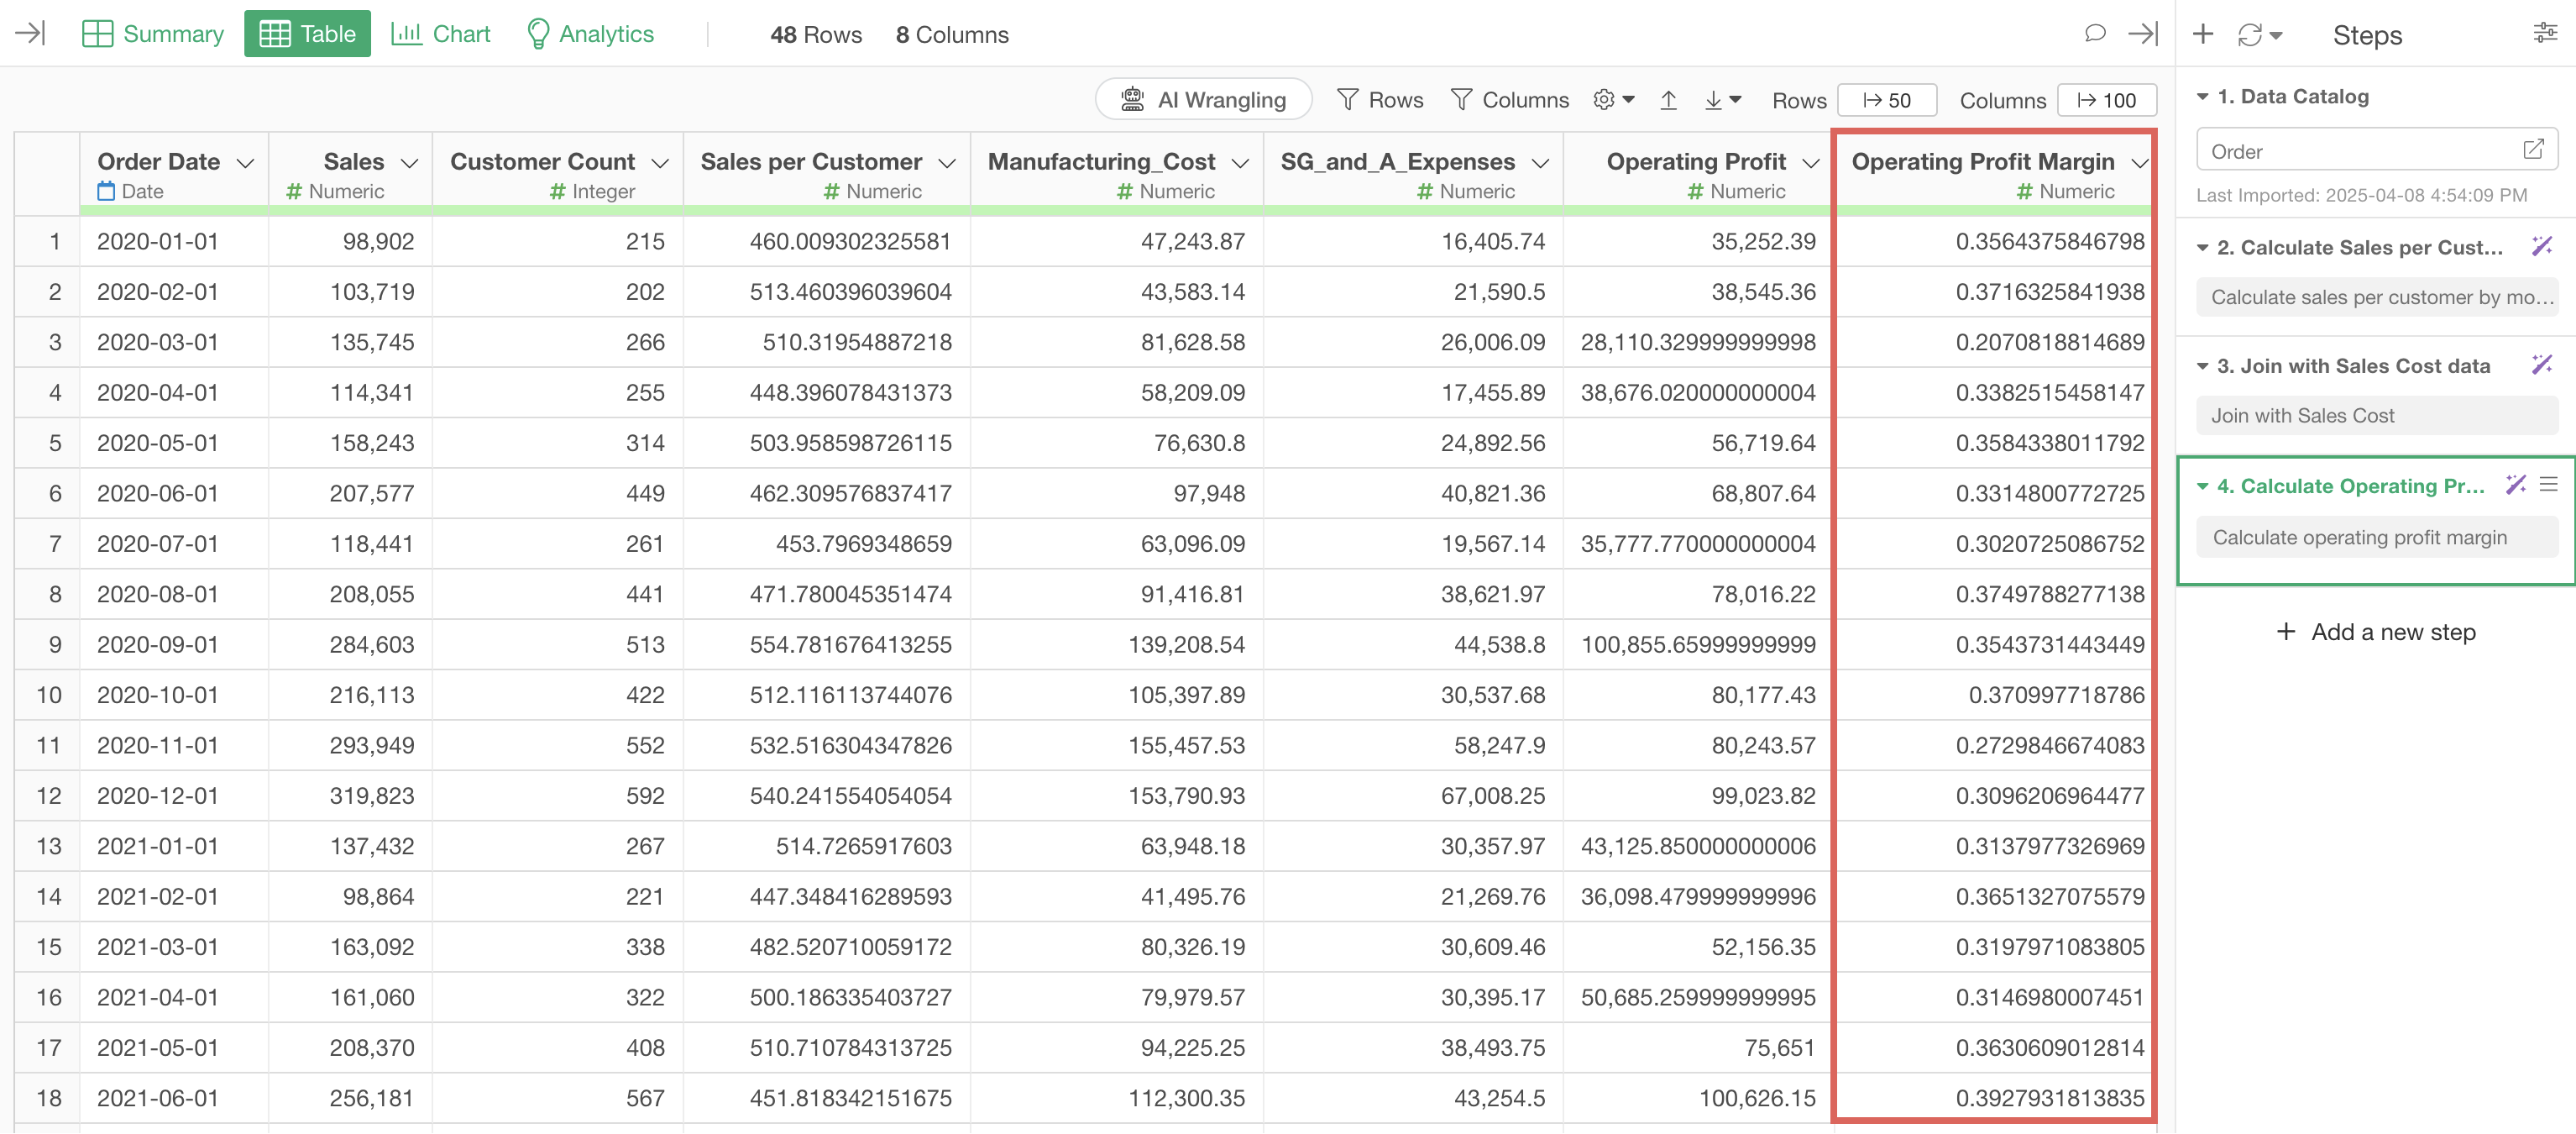
In this way, even for metrics that need to be calculated in combination with multiple data sets, you can easily create them by executing multiple prompts step by step.
3. Calculating Sales from New and Existing Customers
The final pattern is where, once you process the data into the expected form, you can easily perform the final calculation in the chart.
Let’s look at how to identify sales from new customers and sales from existing customers.
In many cases, sales or order data where each row represents a single order doesn’t include information about whether the sale came from a new or existing customer.
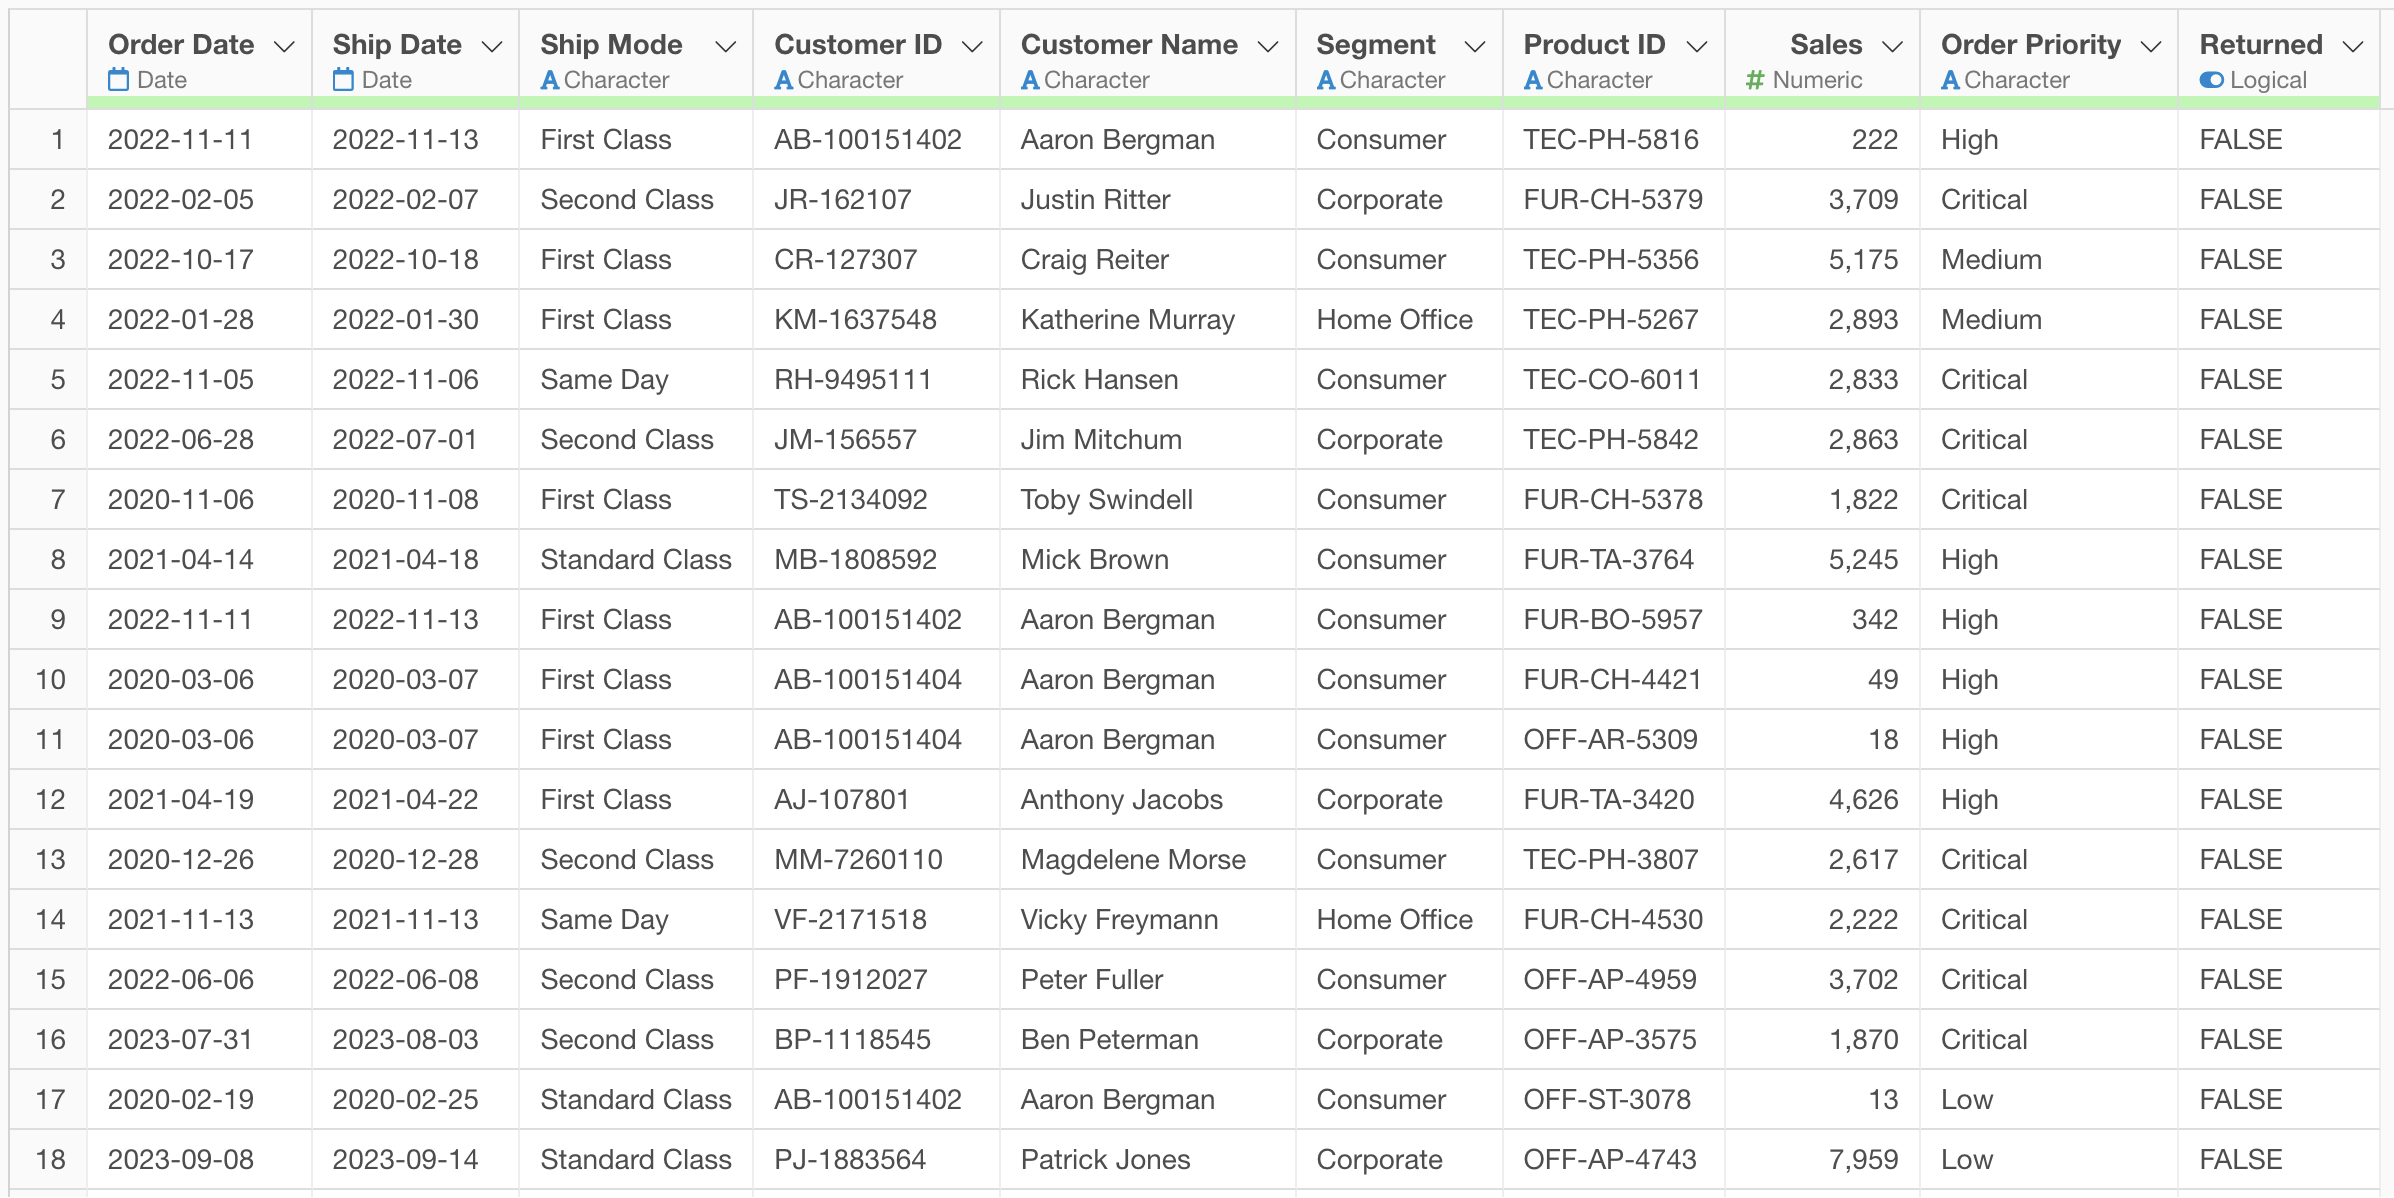
In such cases, by processing the data and adding a label column to identify whether sales are from new or existing customers, you can easily visualize sales from new and existing customers.
From here, we’ll introduce how to use AI prompts to label orders from new customers and existing customers, and visualize each.
Note that we’ll continue using the data frame we created when creating operating profit margin.
Since the data is already aggregated in the current step, we’ll move to a step before aggregation.
Open the AI prompt window, enter the following text, and execute:
Add labels to sales from new customers and sales from existing customers
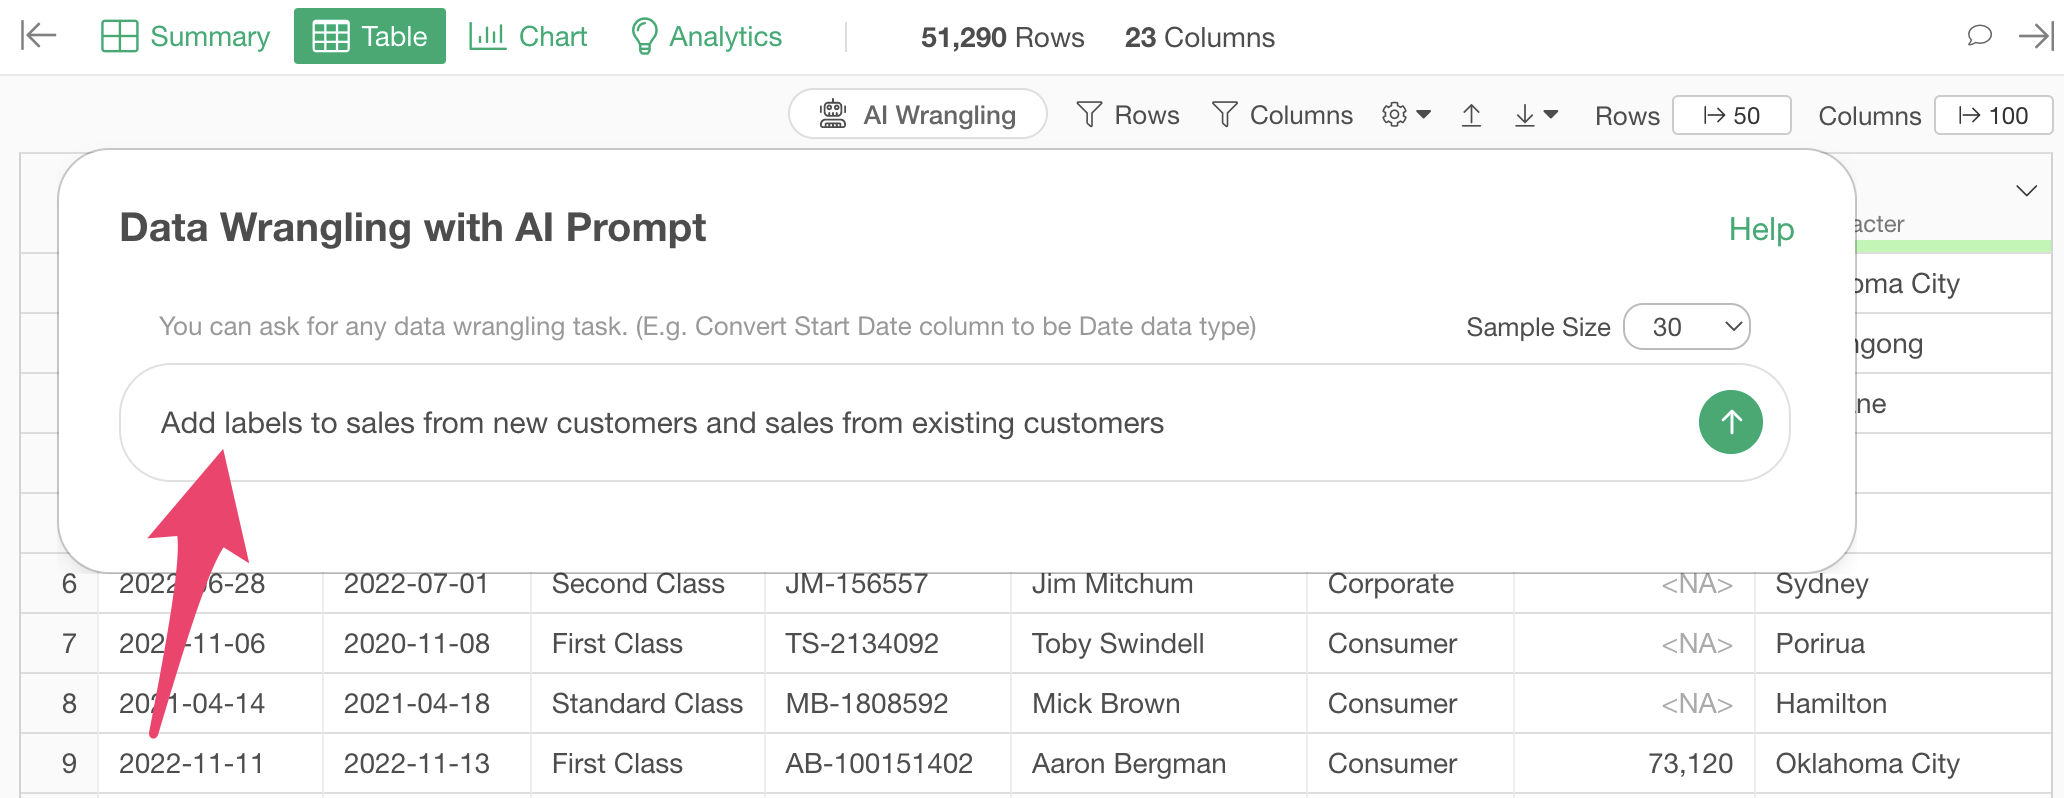
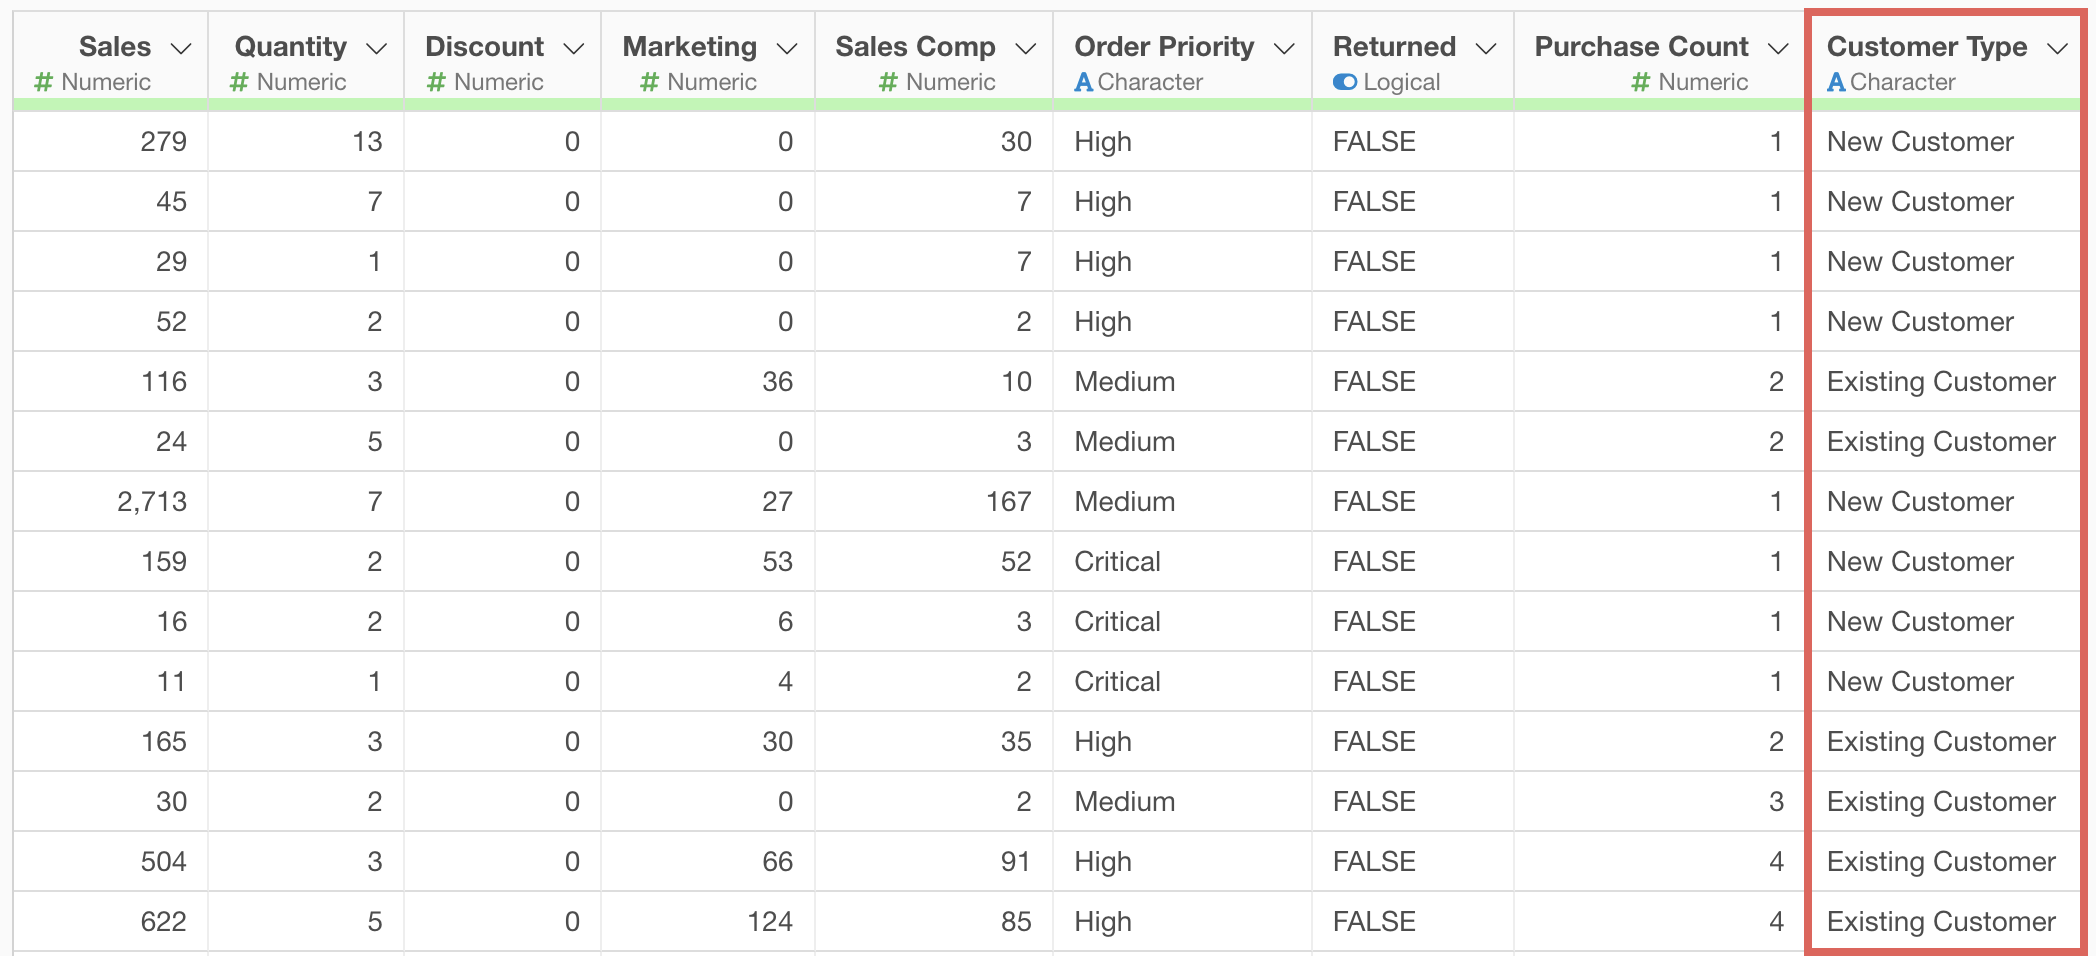
This will display results for labeling sales (orders) from new customers and existing customers, so run it as a step.
We were able to add labels to the data to calculate sales from new customers and existing customers.
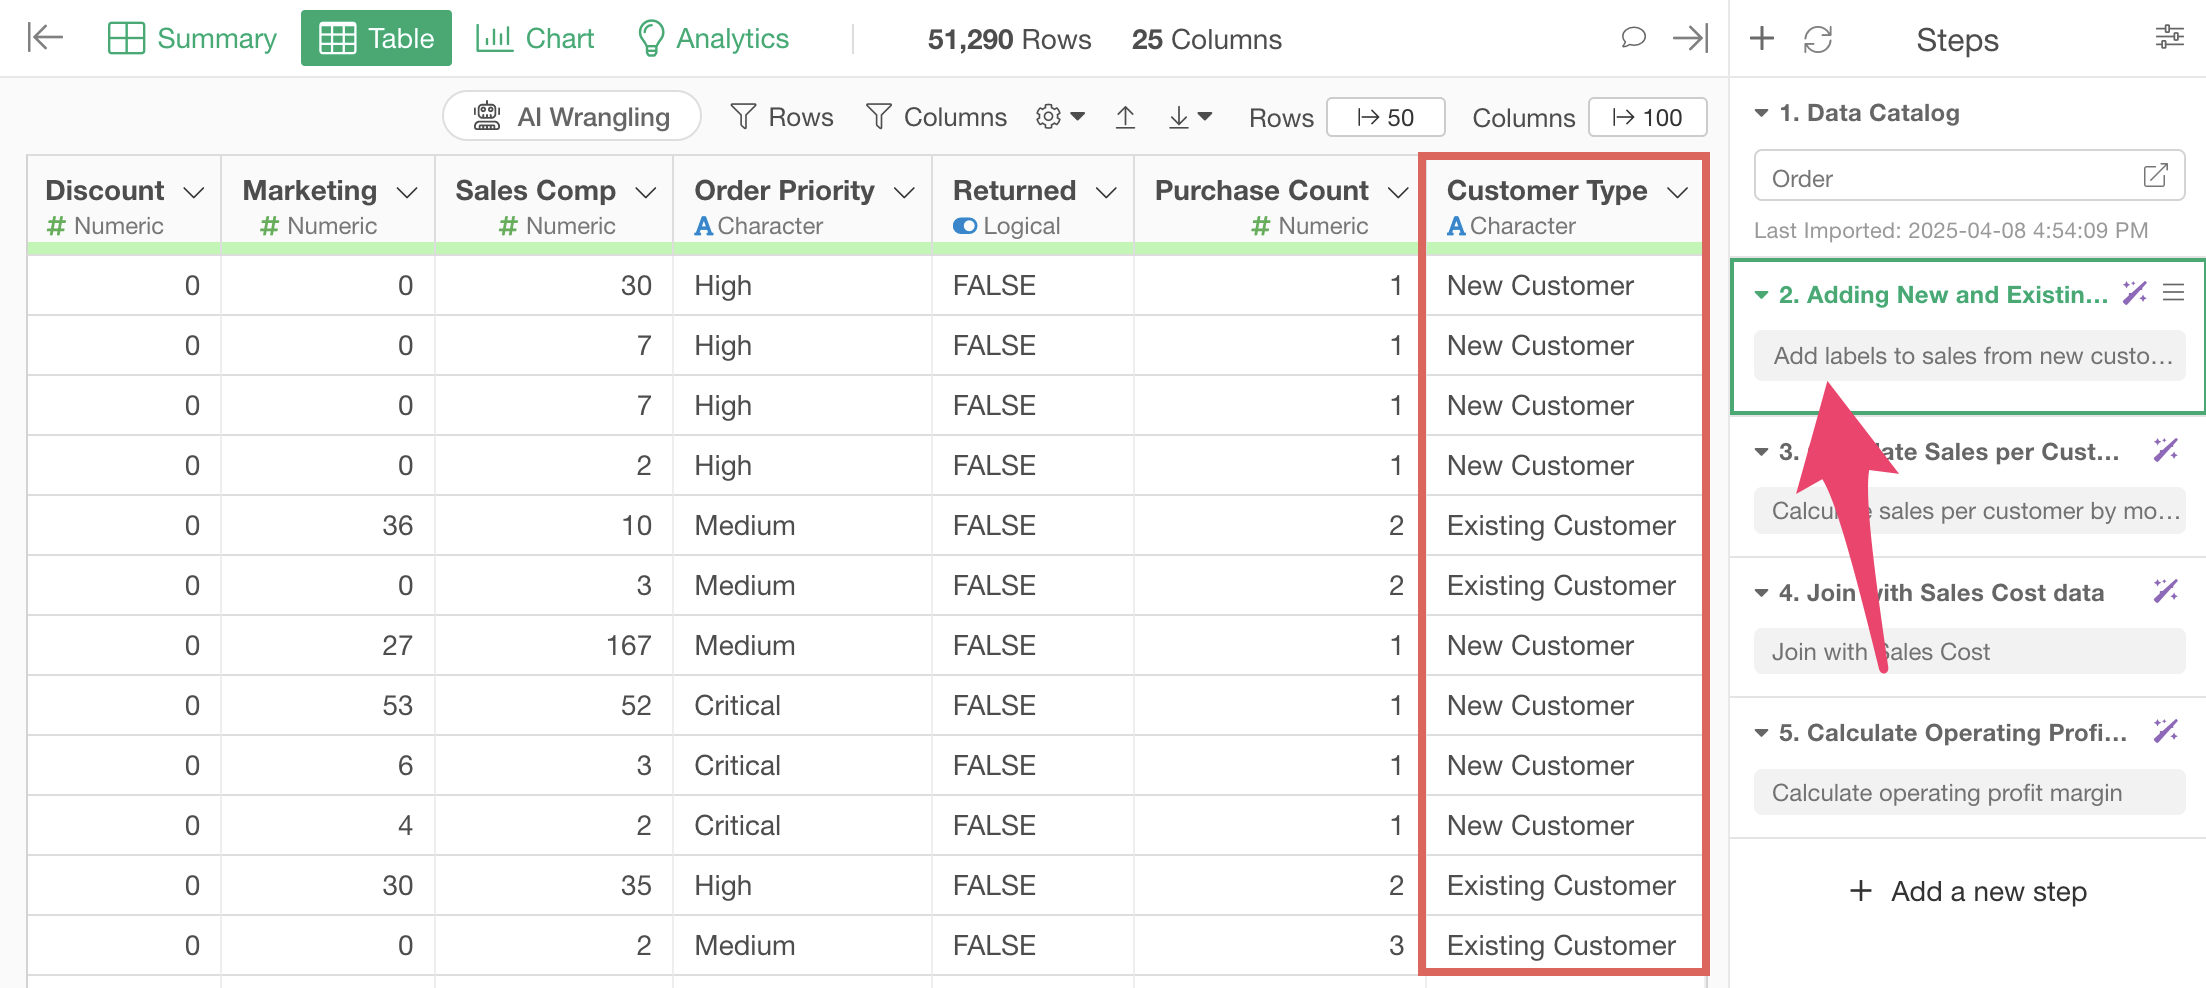
Once the data is prepared like this, you can visualize the trends of sales from new and existing customers in the Chart view.
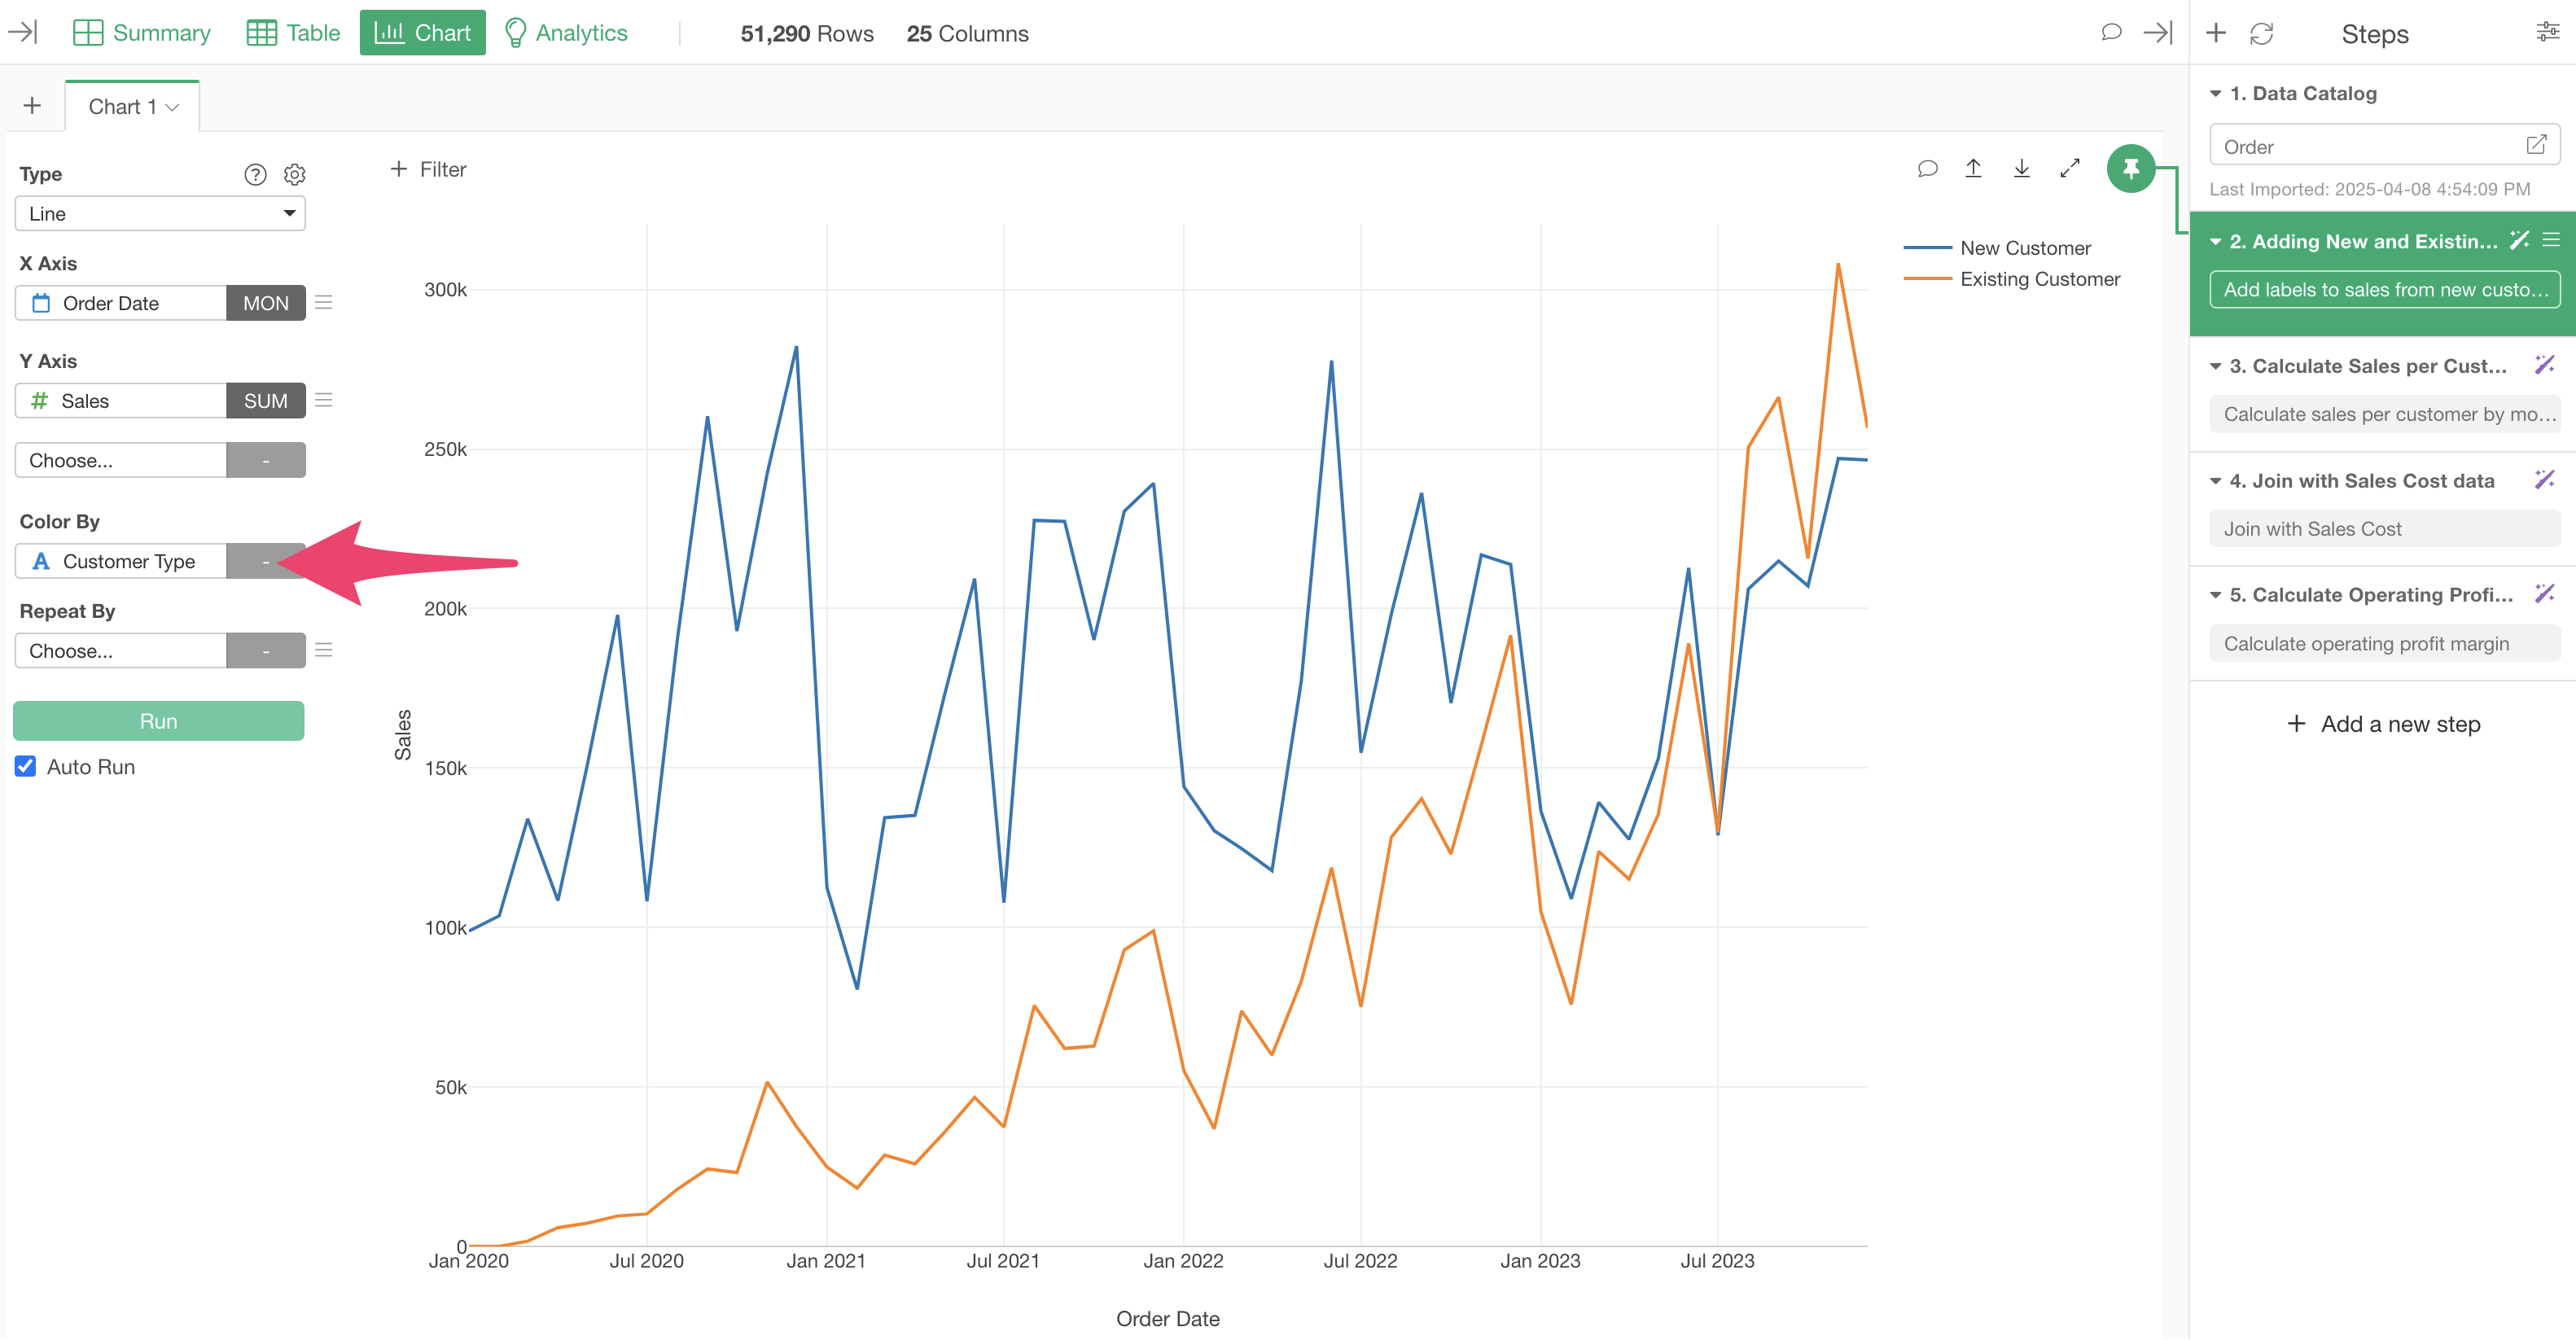
In this way, by using the AI Prompt feature, you can easily visualize sales KPIs using charts.
Want to try with your own data!
This time, we introduced how to calculate key sales KPIs such as “sales per customer,” “profit margin,” and “sales from new and existing customers” using AI prompts.
If you want to calculate sales KPIs using your own data, we also offer a 30-day free trial, so please give it a try!