
This is a bi-weekly update of what we have seen in Data Science and what we are working on.
Hi there!
It’s Kan from Exploratory. Hope this email finds you well.
It’s been a crazy week with the wildfire we had and currently still have in Napa, Sonoma, and other areas at north of San Francisco Bay Area. Some folks in our family had to evacuate and we’re still keep our eyes on the news. But we are all safe. And I hope everyone receiving this email is ok, too.
Anyway, here’s our weekly update for this week.
What We Are Reading
The Impressive Growth of R - URL
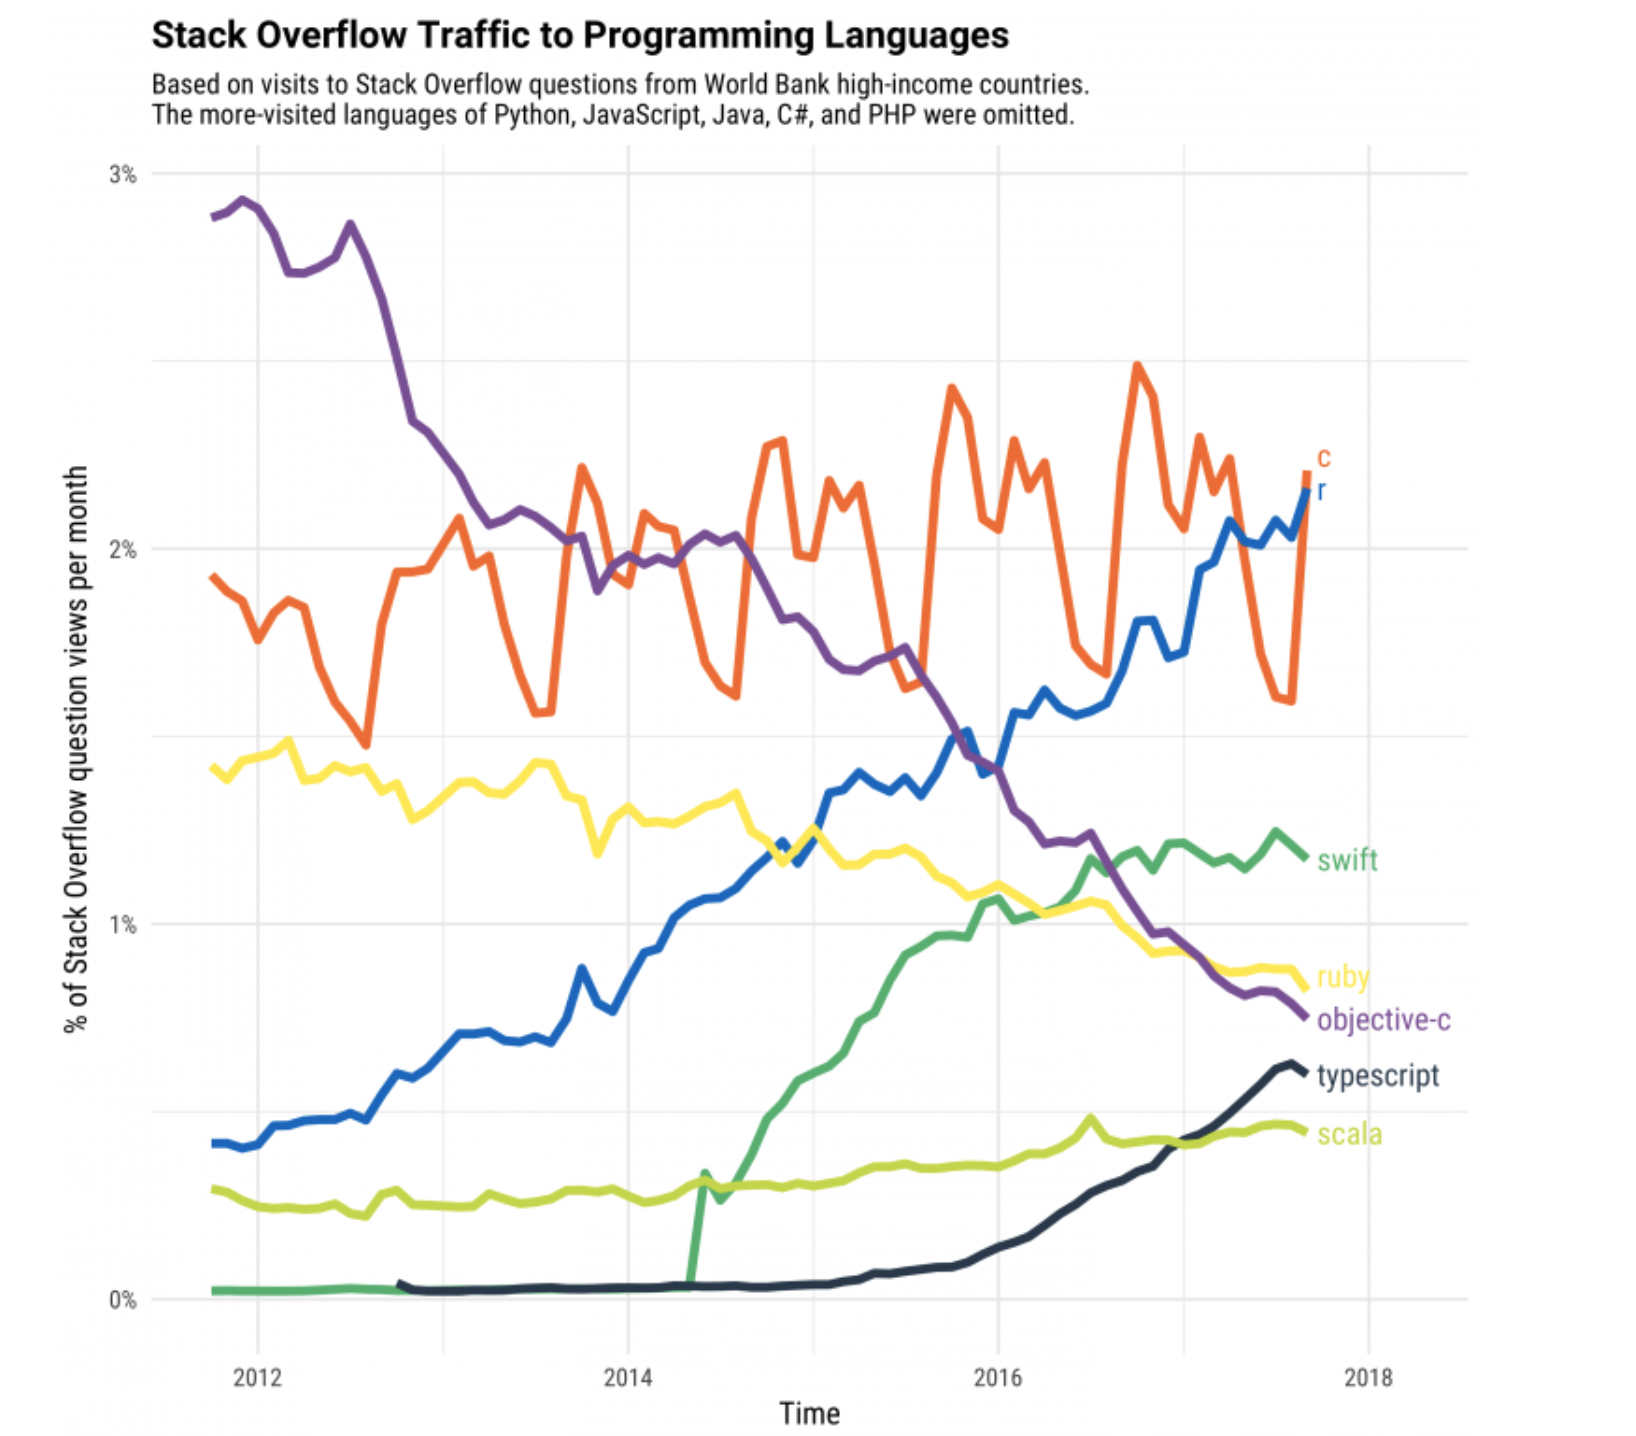
A famous Data Scientist, David Robinson, at Stackoverflow has put together this great analysis on how R has grown rapidly over the years. As always, it is not just an interesting story about R, but also it is a great example of exploratory data analysis.
The top 3 R packages are dplyr, ggplot2, and data.table. As you probably know, most of the data wrangling commands you use in Exploratory are the commands from dplyr package. ggplot2 is a package for data visualization, and you can use it in Markdown Note in Exploratory. Here’s an example.
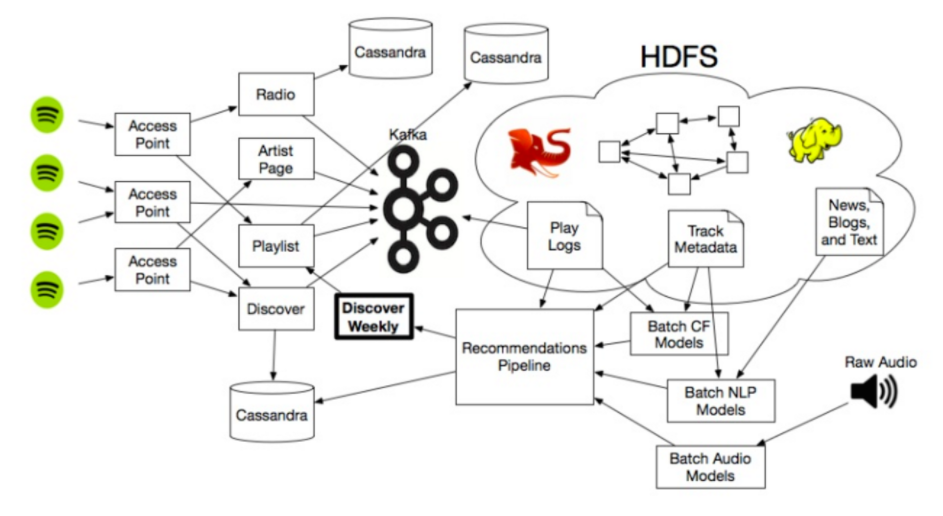
Spotify’s Discover Weekly: How machine learning finds your new music. The science behind personalized music recommendations - URL
Sophia Ciocca studied all the publicly available information about Spotify’s recommendation engine and summarized how they have built it for Discover Weekly feature. You can check their analytics data pipeline as well.
Applying Artificial Intelligence in Medicine: Our Early Results - URL
A team at Cardiogram uses Deep Learning to detect atrial fibrillation - the most common heart arrhythmia for the patients wearing Apple Watch. They have built a model based on Apple Watch’s heart rate readings and can produce a quality of “AUC of 0.97, enabling us to detect atrial fibrillation with 98.04% sensitivity and 90.2% specificity.”
Machine Learning Vocabulary - URL
Google is putting together all the machine learning related terms. Very useful.
Interesting Data
US Wildfire Data - URL
This data is about wildfires in US from 1984 to 2015 from Monitoring Trends in Burn Severity (MTBS) program. It contains more than 20,000 large fires by location, time, and severity. The original data, which is hosted on the site, is available only in Shapefile format so we have converted it to CSV by using R (Check this post for how to import Shapefile into R’s data frame.) and shared it here for you.
San Francisco Bay’s Water Quality Data - URL
This data is about San Francisco Bay’s water quality from 1969 to 2015, collected by The U.S. Geological Survey agency. They are collected at about 40 stations in the Bay for metrics such as temperature, salinity, chlorophyll, oxygen, nitrate, ammonium, etc. I have quickly put my analysis together in this note, though it’s still a work in progress, and you can see the water close to San Francisco are the coldest in Summer. I remember how cold it was from my triathlon training days… 😱
Stock Price Data
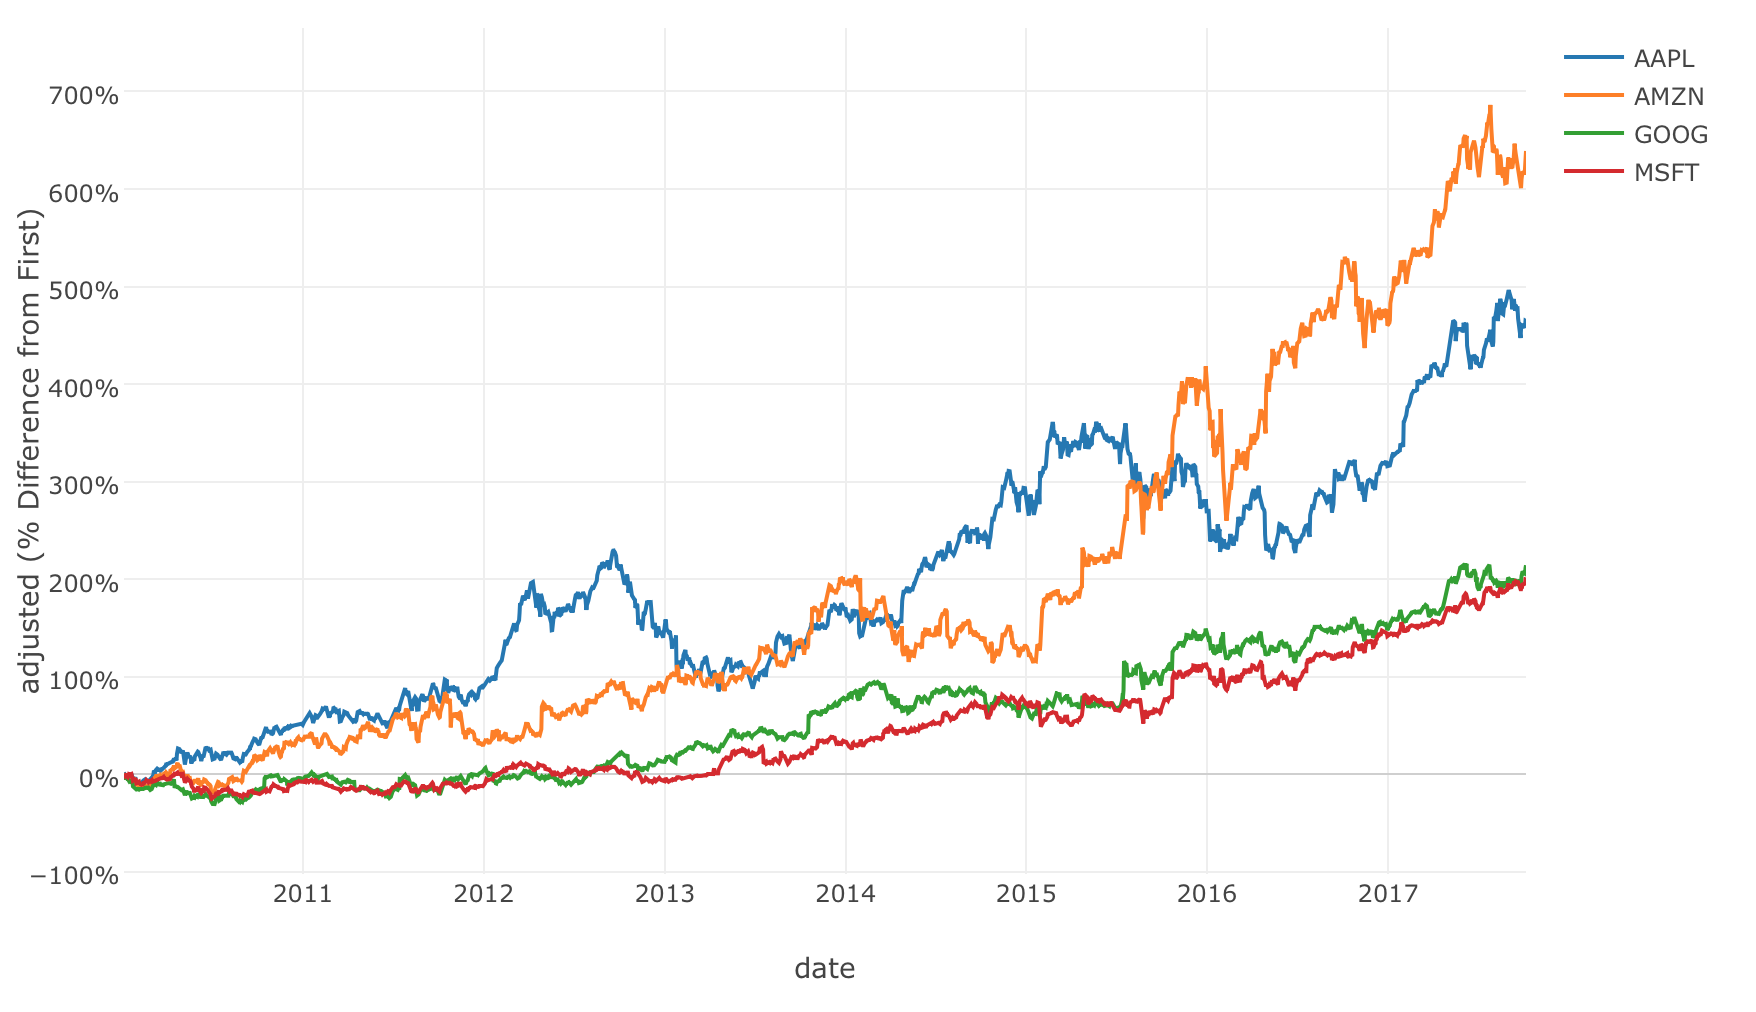
You might have already known, but there is a cool R package called tidyquant that makes it simple to download the financial data including the historical stock prices. I have created a sample and shared it as EDF here.
What is EDF(Exploratory Data Format)? - Document
You need to install ‘tidyquant’ R package first. Here is how you can install R package in Exploratory.
Blog Posts from Team Exploratory
Here are a few blog posts we have published recently.
What Are We Working On?
We’ll be releasing v4.1 this week with many new features and enhancements. One of the cool new features is, Regression Analysis with Analytics View. You could build a linear regression model even before, but now you can do it instantly under Analytics View with just a few clicks.
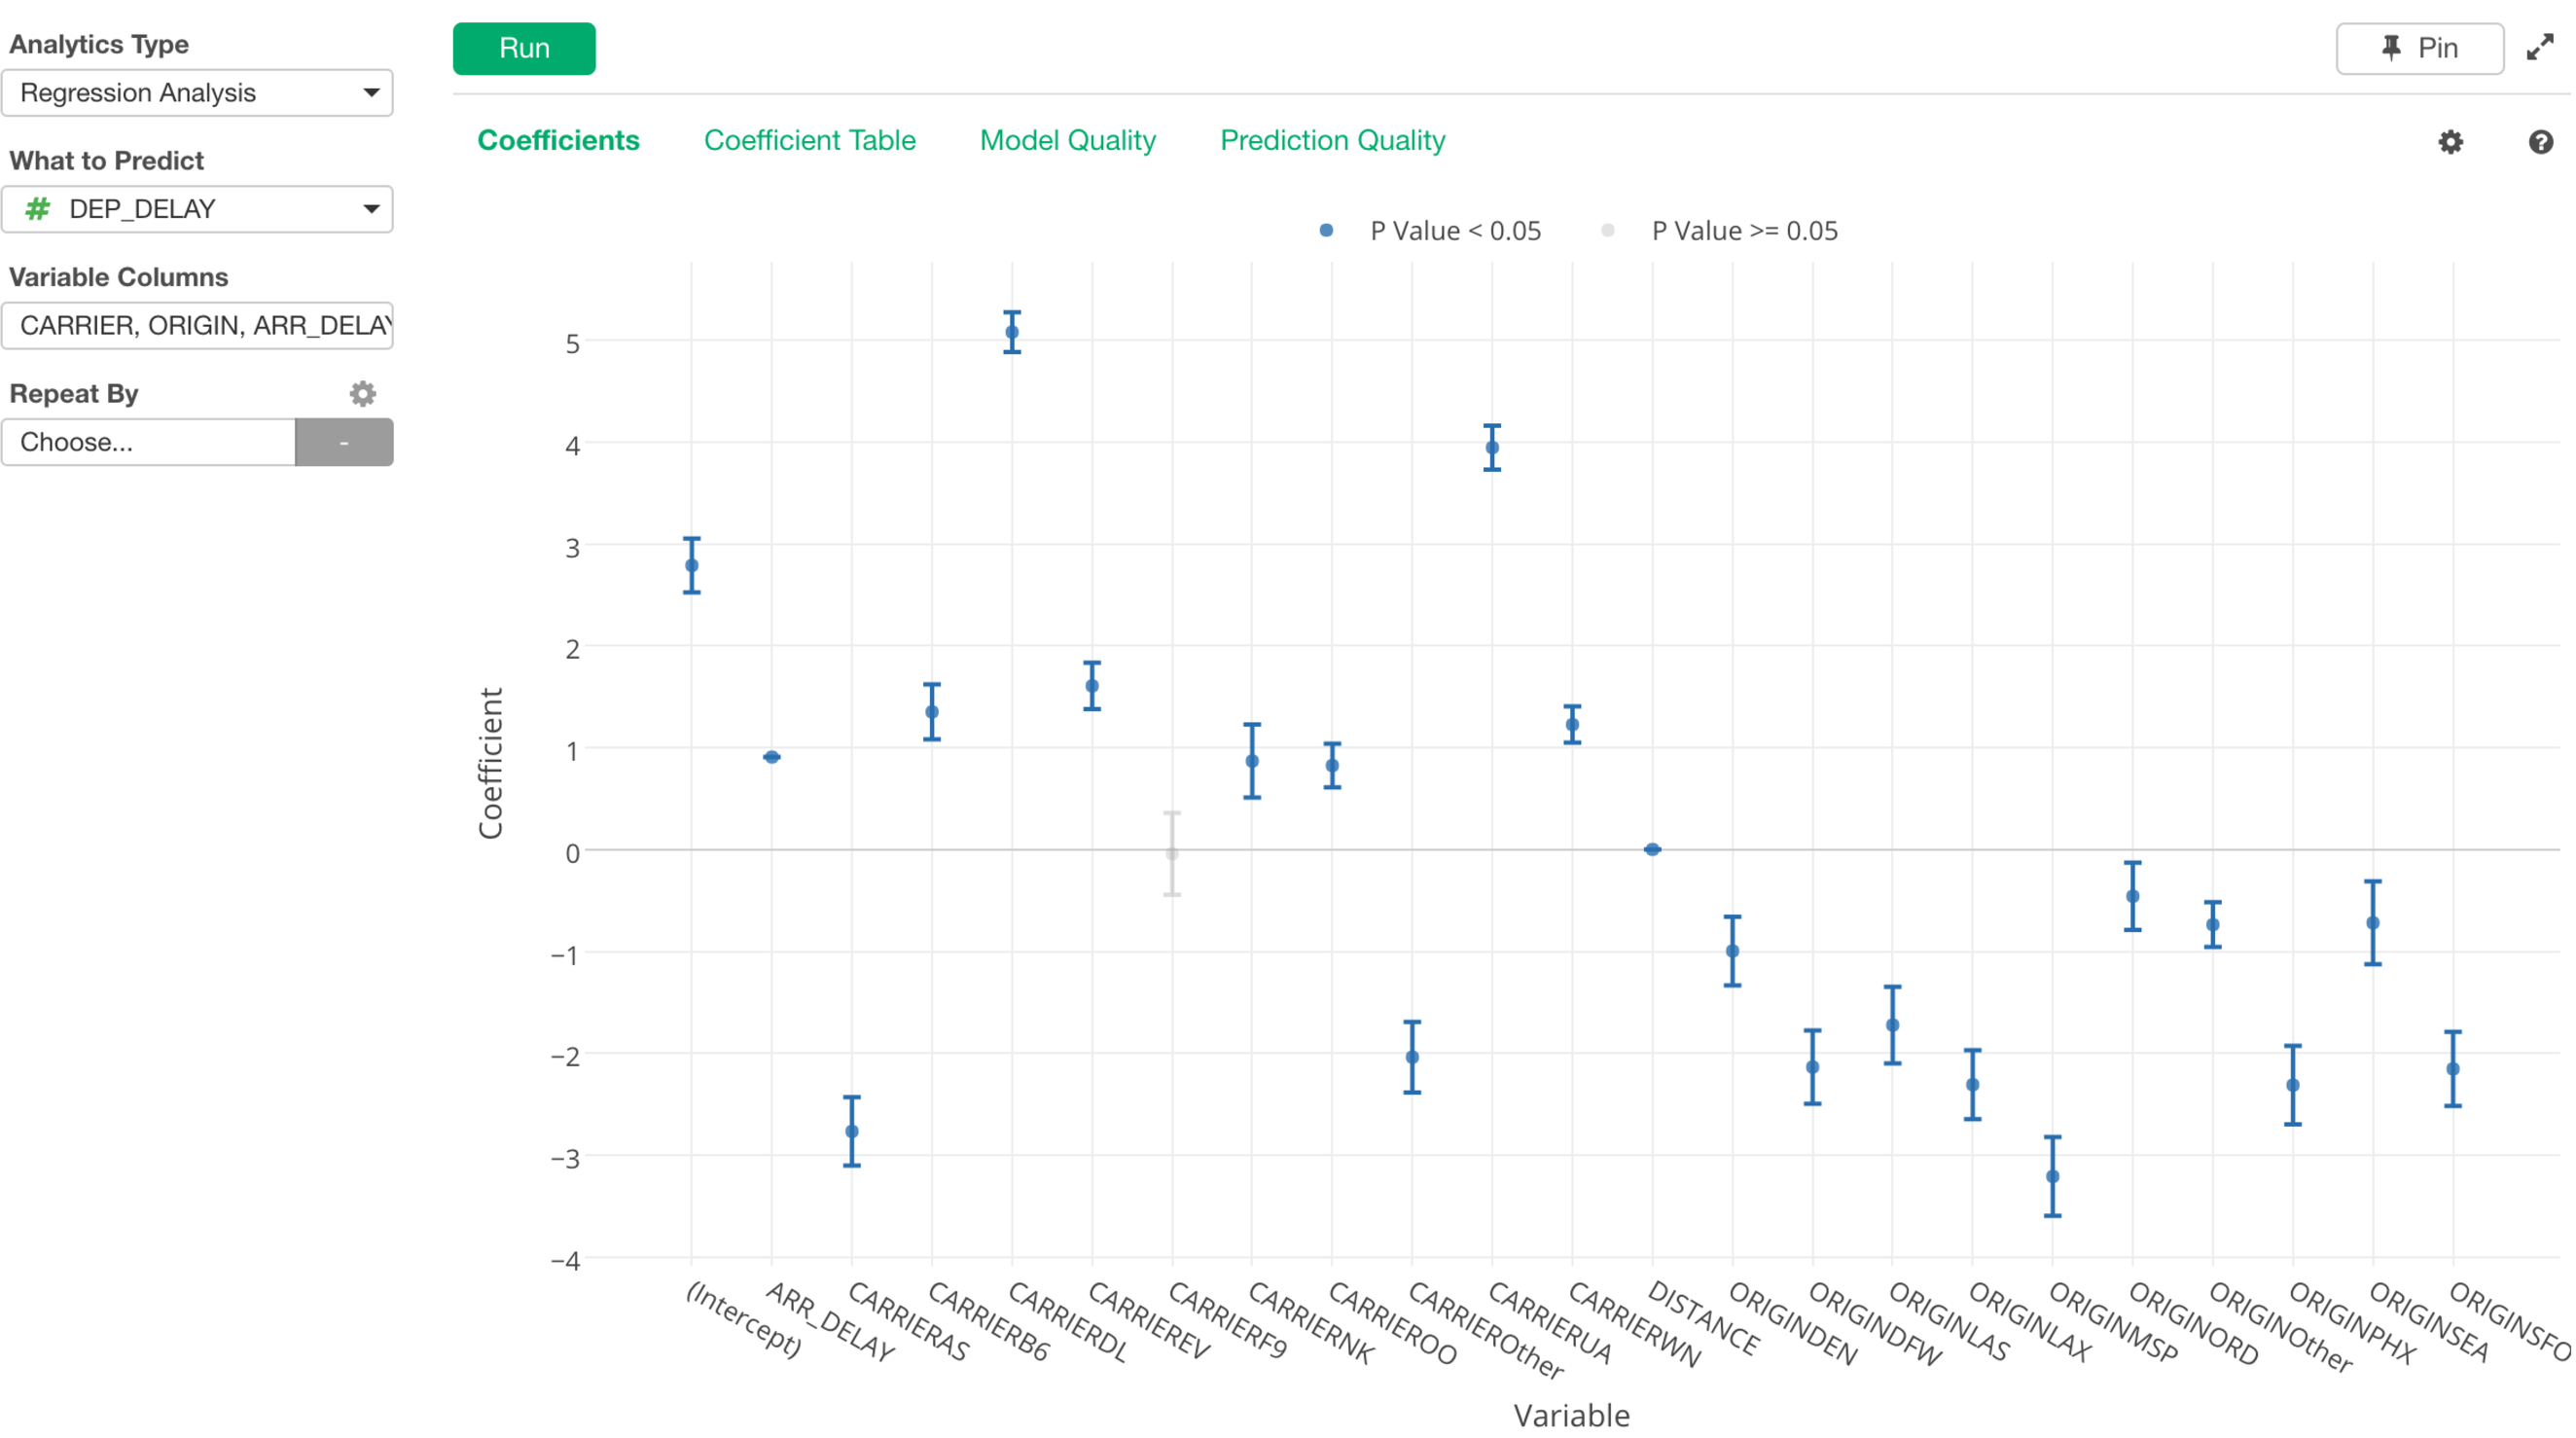
It’s super useful especially when you want to know how each of the variables would impact on the variable you want to predict.
Past Archive
If you are interested in the past weekly updates, check out our archive page. This is actually done by creating these updates in Exploratory’s Markdown Note Editor, adding a Tag ‘Weekly Update’ to these notes, then publishing to exploratory.io. This Tag support is also coming with v4.1. So stay tuned for the release announcement! ;)
That’s it for this week.
Have a wonderful week!
Kan, Exploratory/CEO