How to Import Stock Price Data and Visualize with Window Calculations
Let's say you want to compare Apple and Google's past stock price performance.
Is Google better or Apple better?
Well, it depends.
It depends on how you look at it. You might want to look at their performance over the last 30 days, a year, or 5 years. Or, you might want to understand their trends and project the future.
However the way you want to look at it, you can do all the things easily in Exploratory thanks to all the functionalities that come with R.
But, if you don't have data, nothing starts.
In Exploratory, you can import the historical stock price data with a click of a button, thanks to a data source extension built based on the R package called 'tidyquant'.
1. Install Historical Stock Price extension.
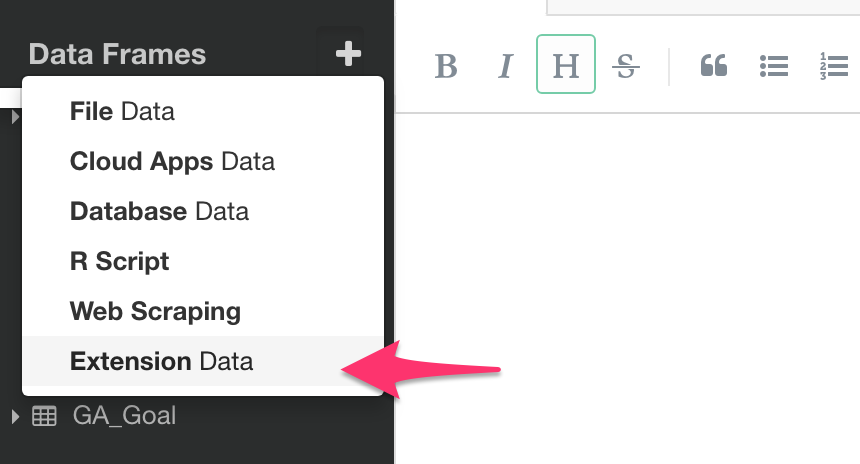
Select 'Extension Data' from Data Frame menu.
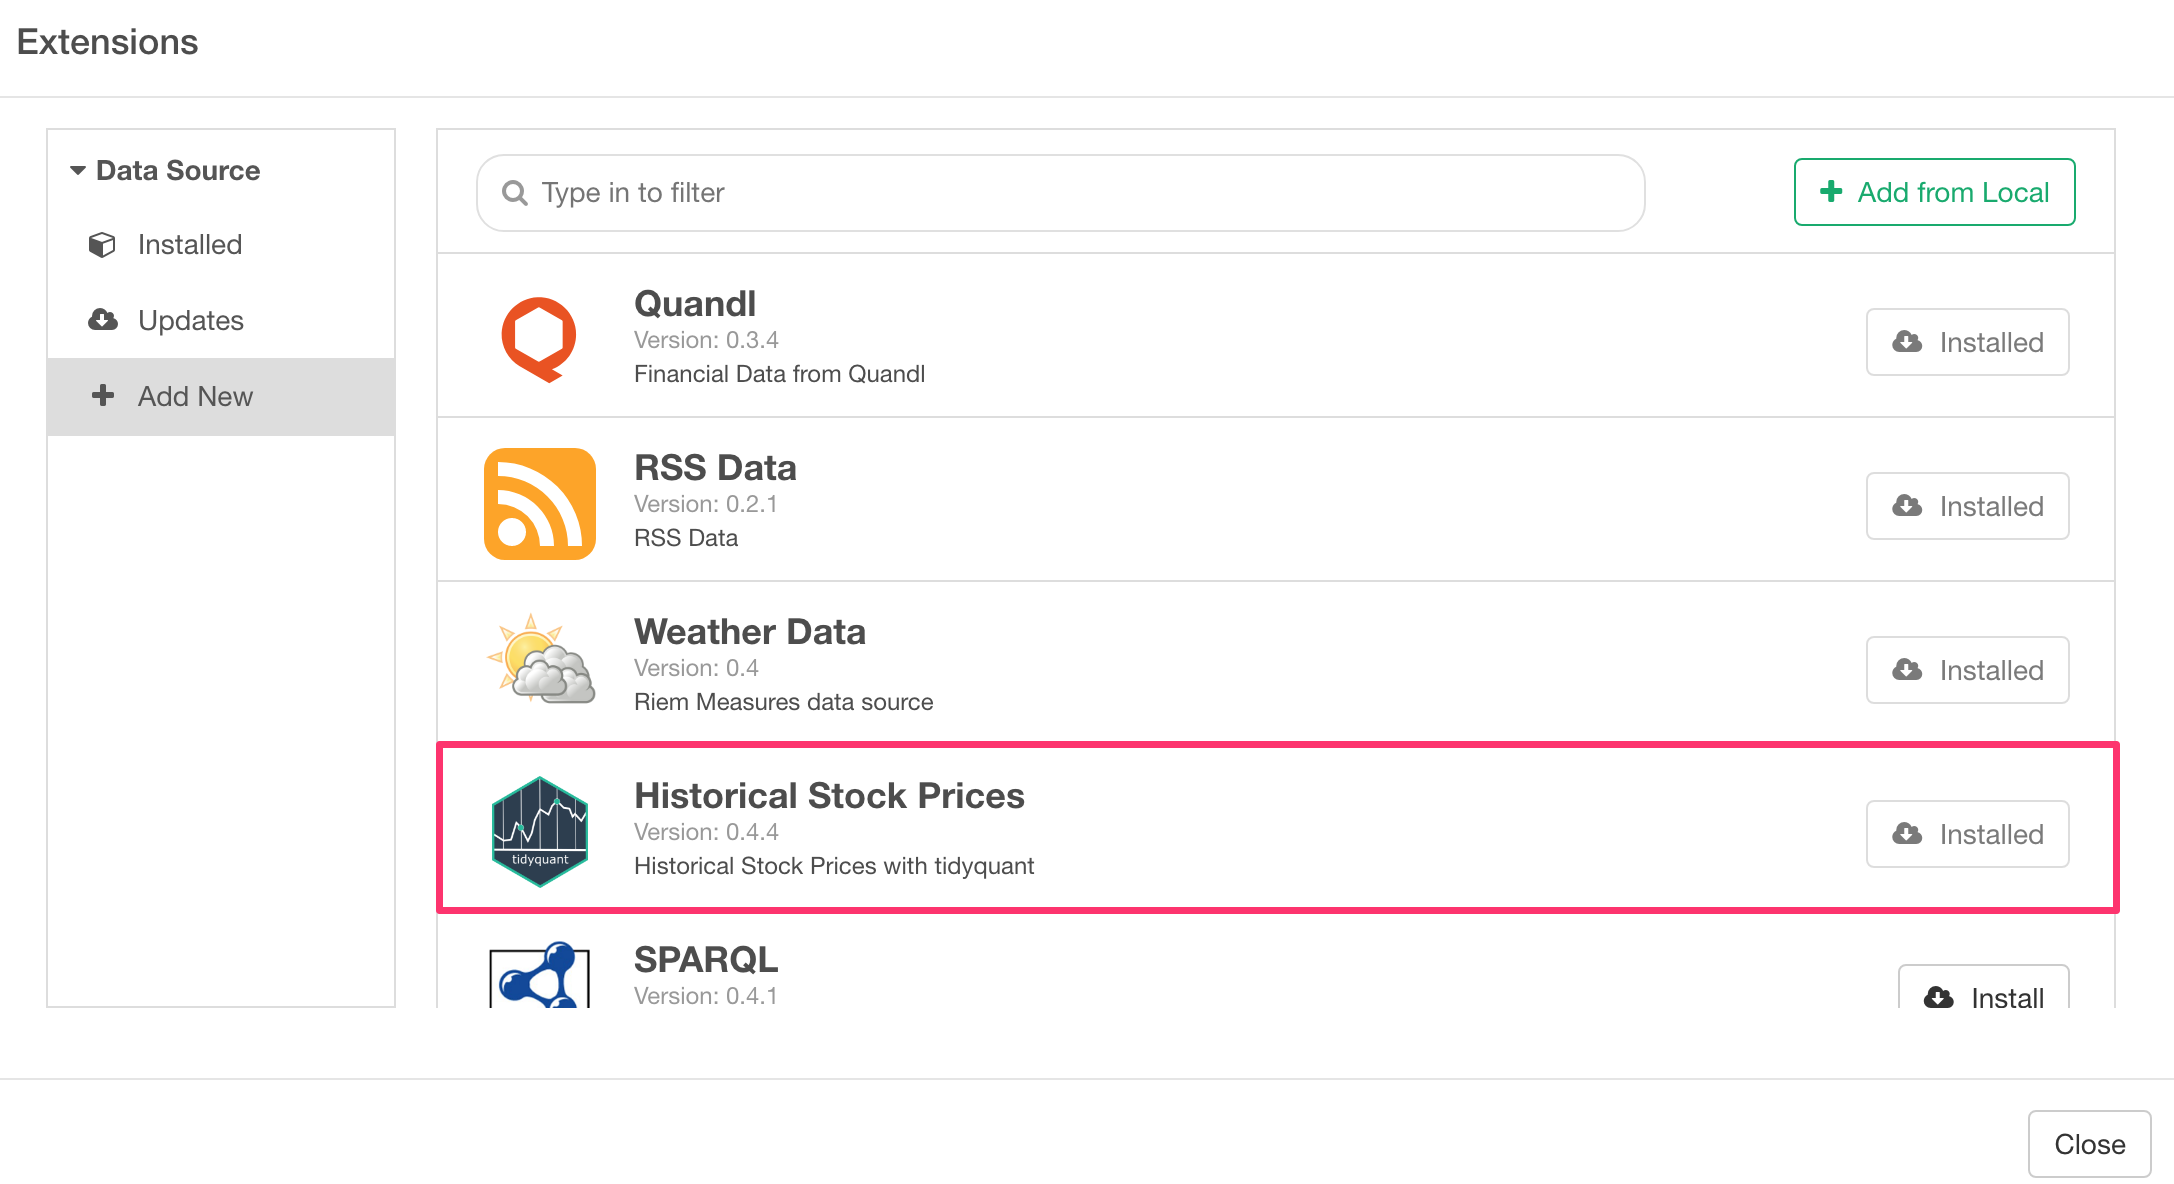
Go to 'Add New' section, find 'Historical Stock Prices', and click on Install button.
This will install the extension along with the required R packages so it might take some time.
2. Import Storck Price Data
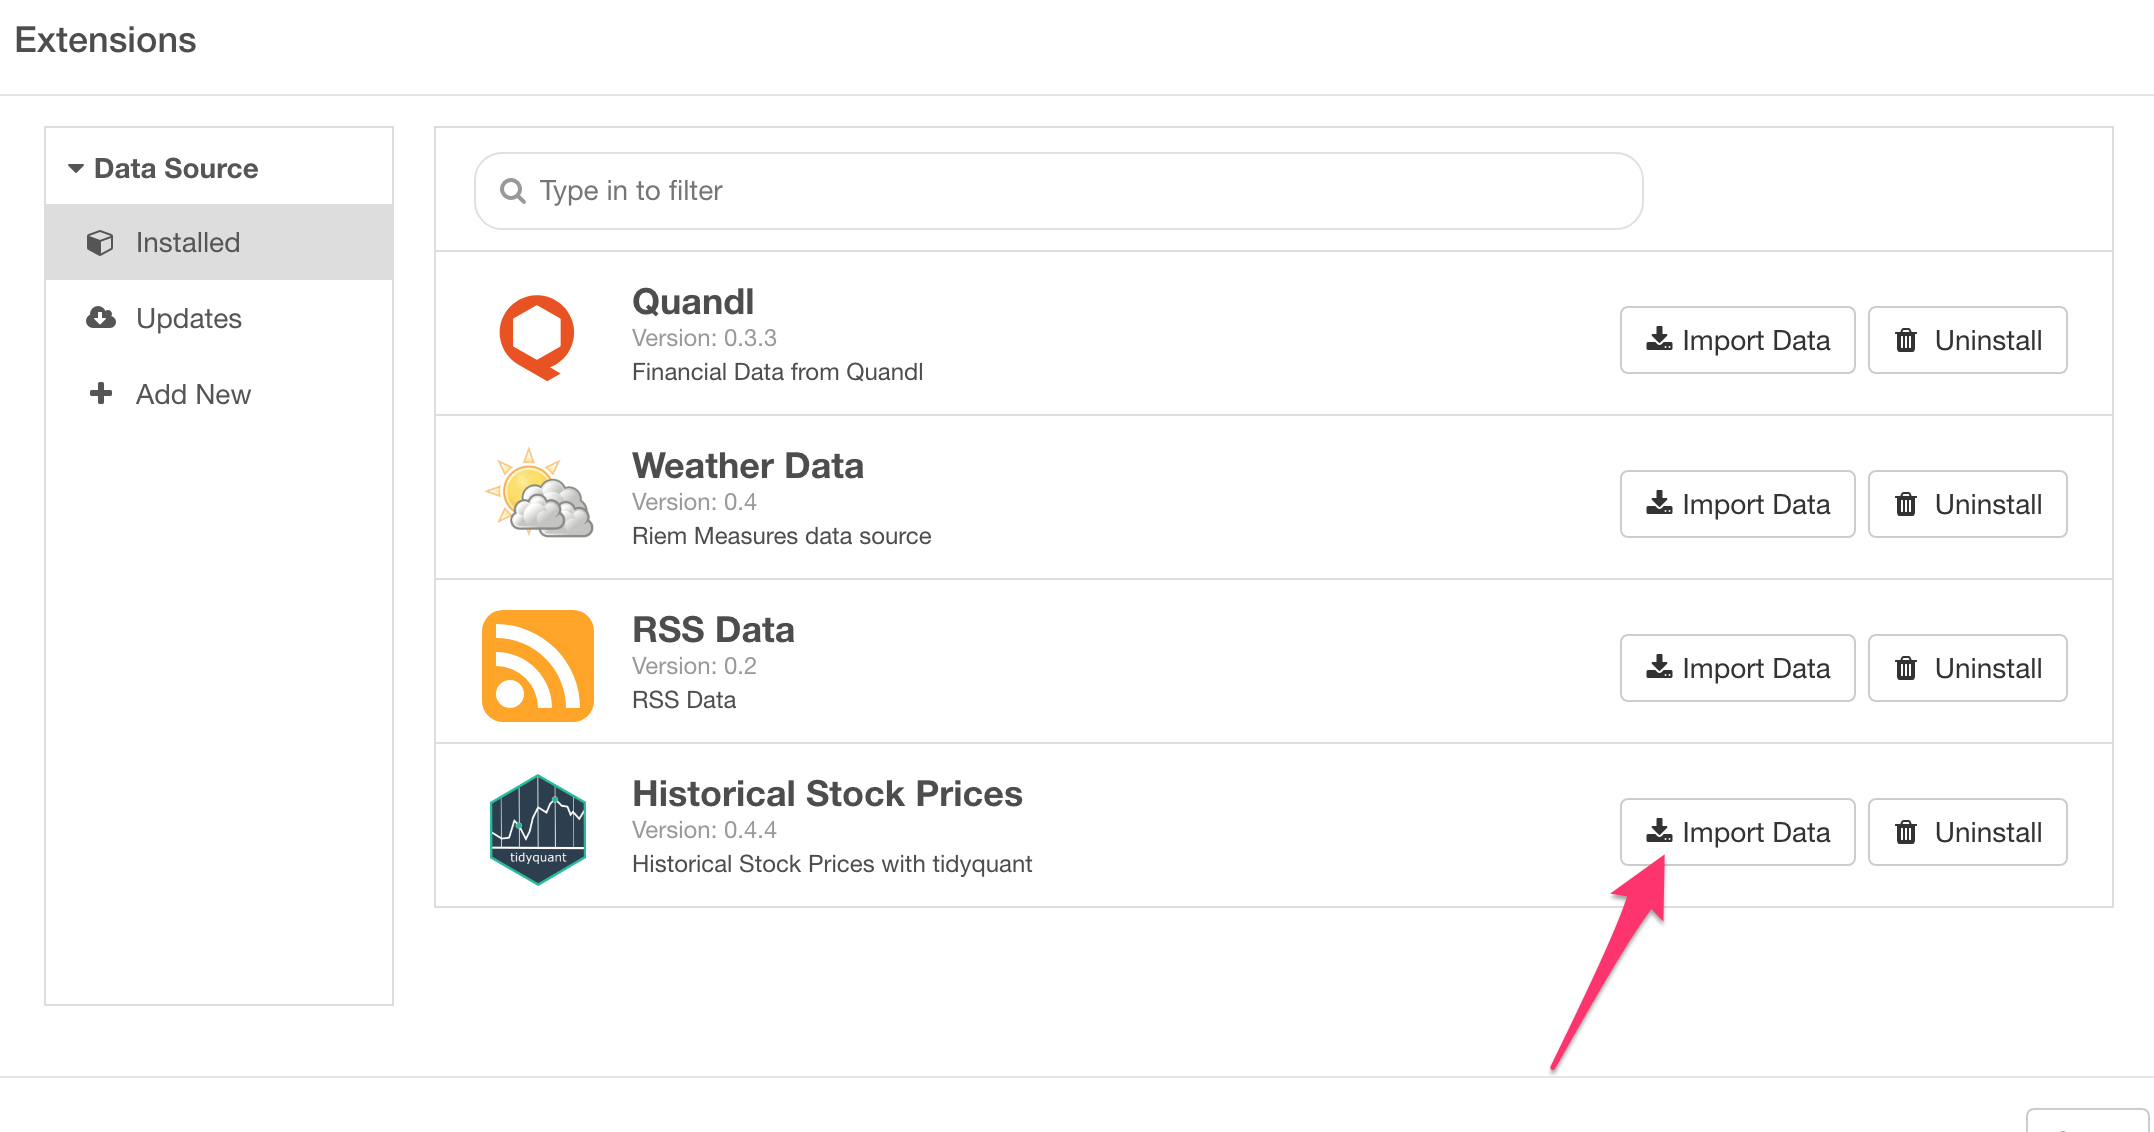
Once it's installed, go to Installed section, if it's not automatically redicreted there after the installation.
Click on 'Import Data' button.
Type the stock symbols and set the date range at the left hand side, then click 'Get Data' button.
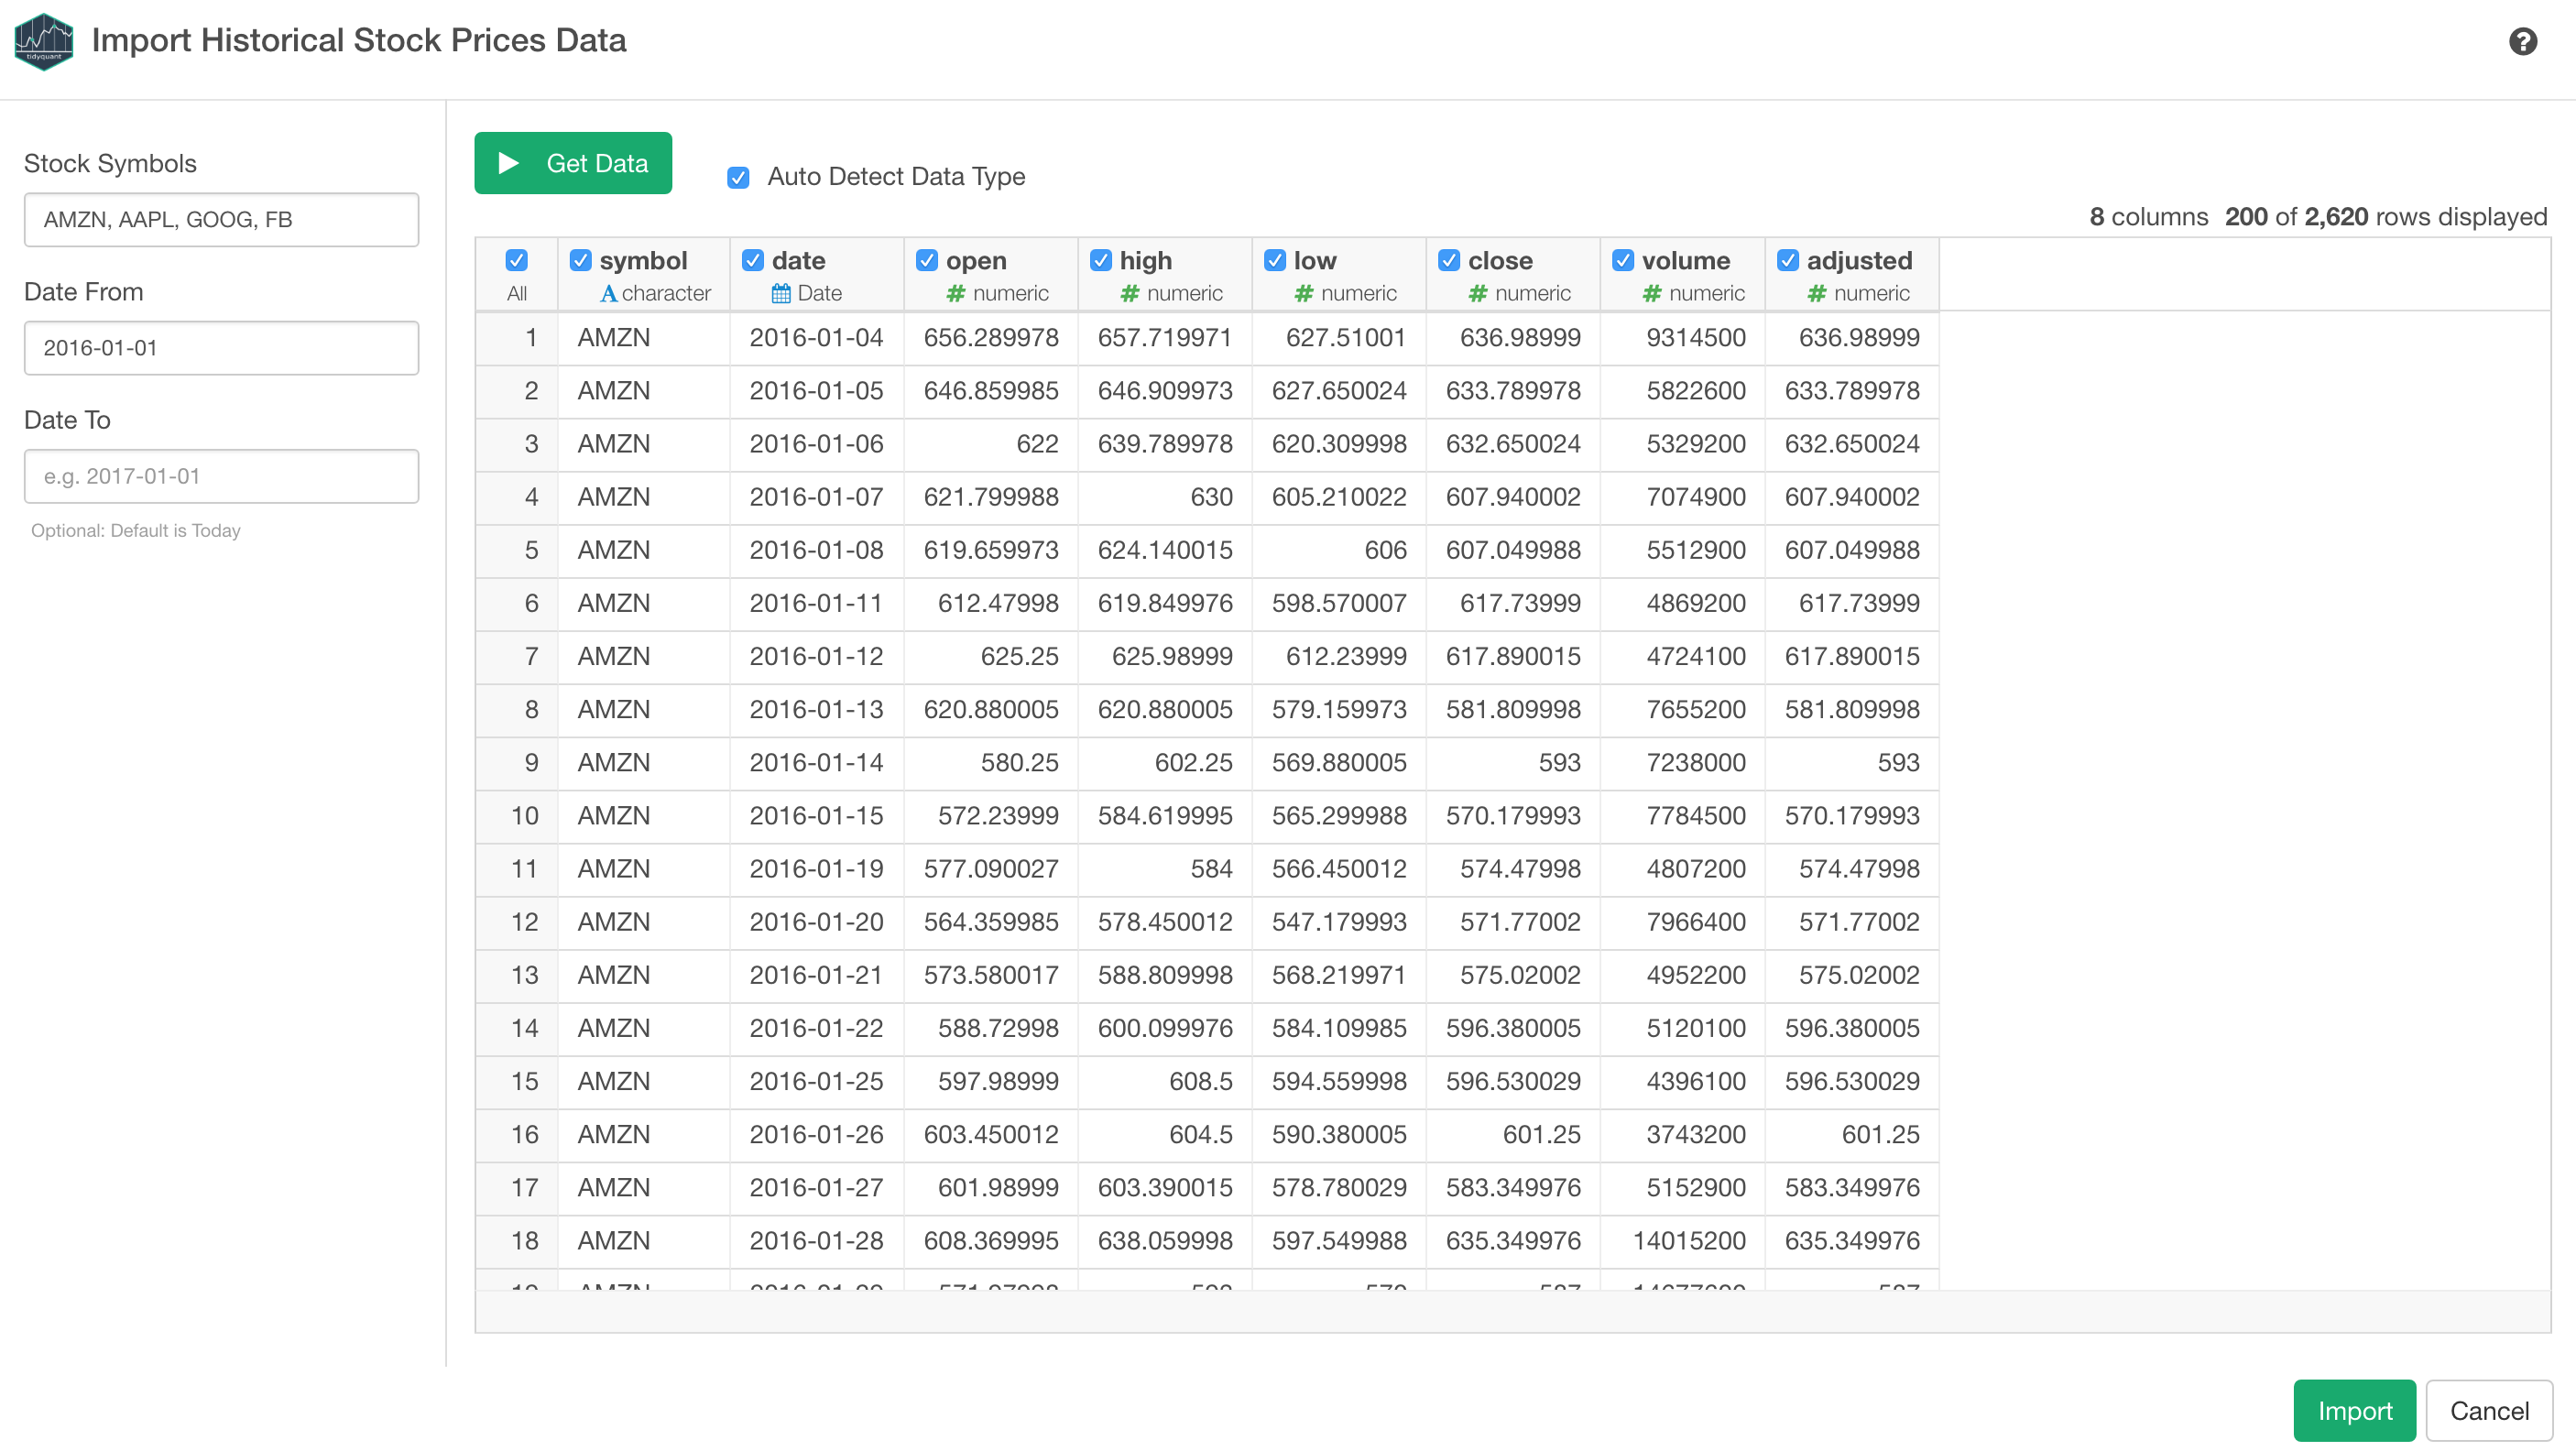
- The stock symbols are something like AAPL for Apple, AMZN for Amazon, etc.
- The date range is to set the start and the end dates. The default is to get the data for the last one year.
If it looks good in the preview table, click the 'Import' button. You will see the Summary view.
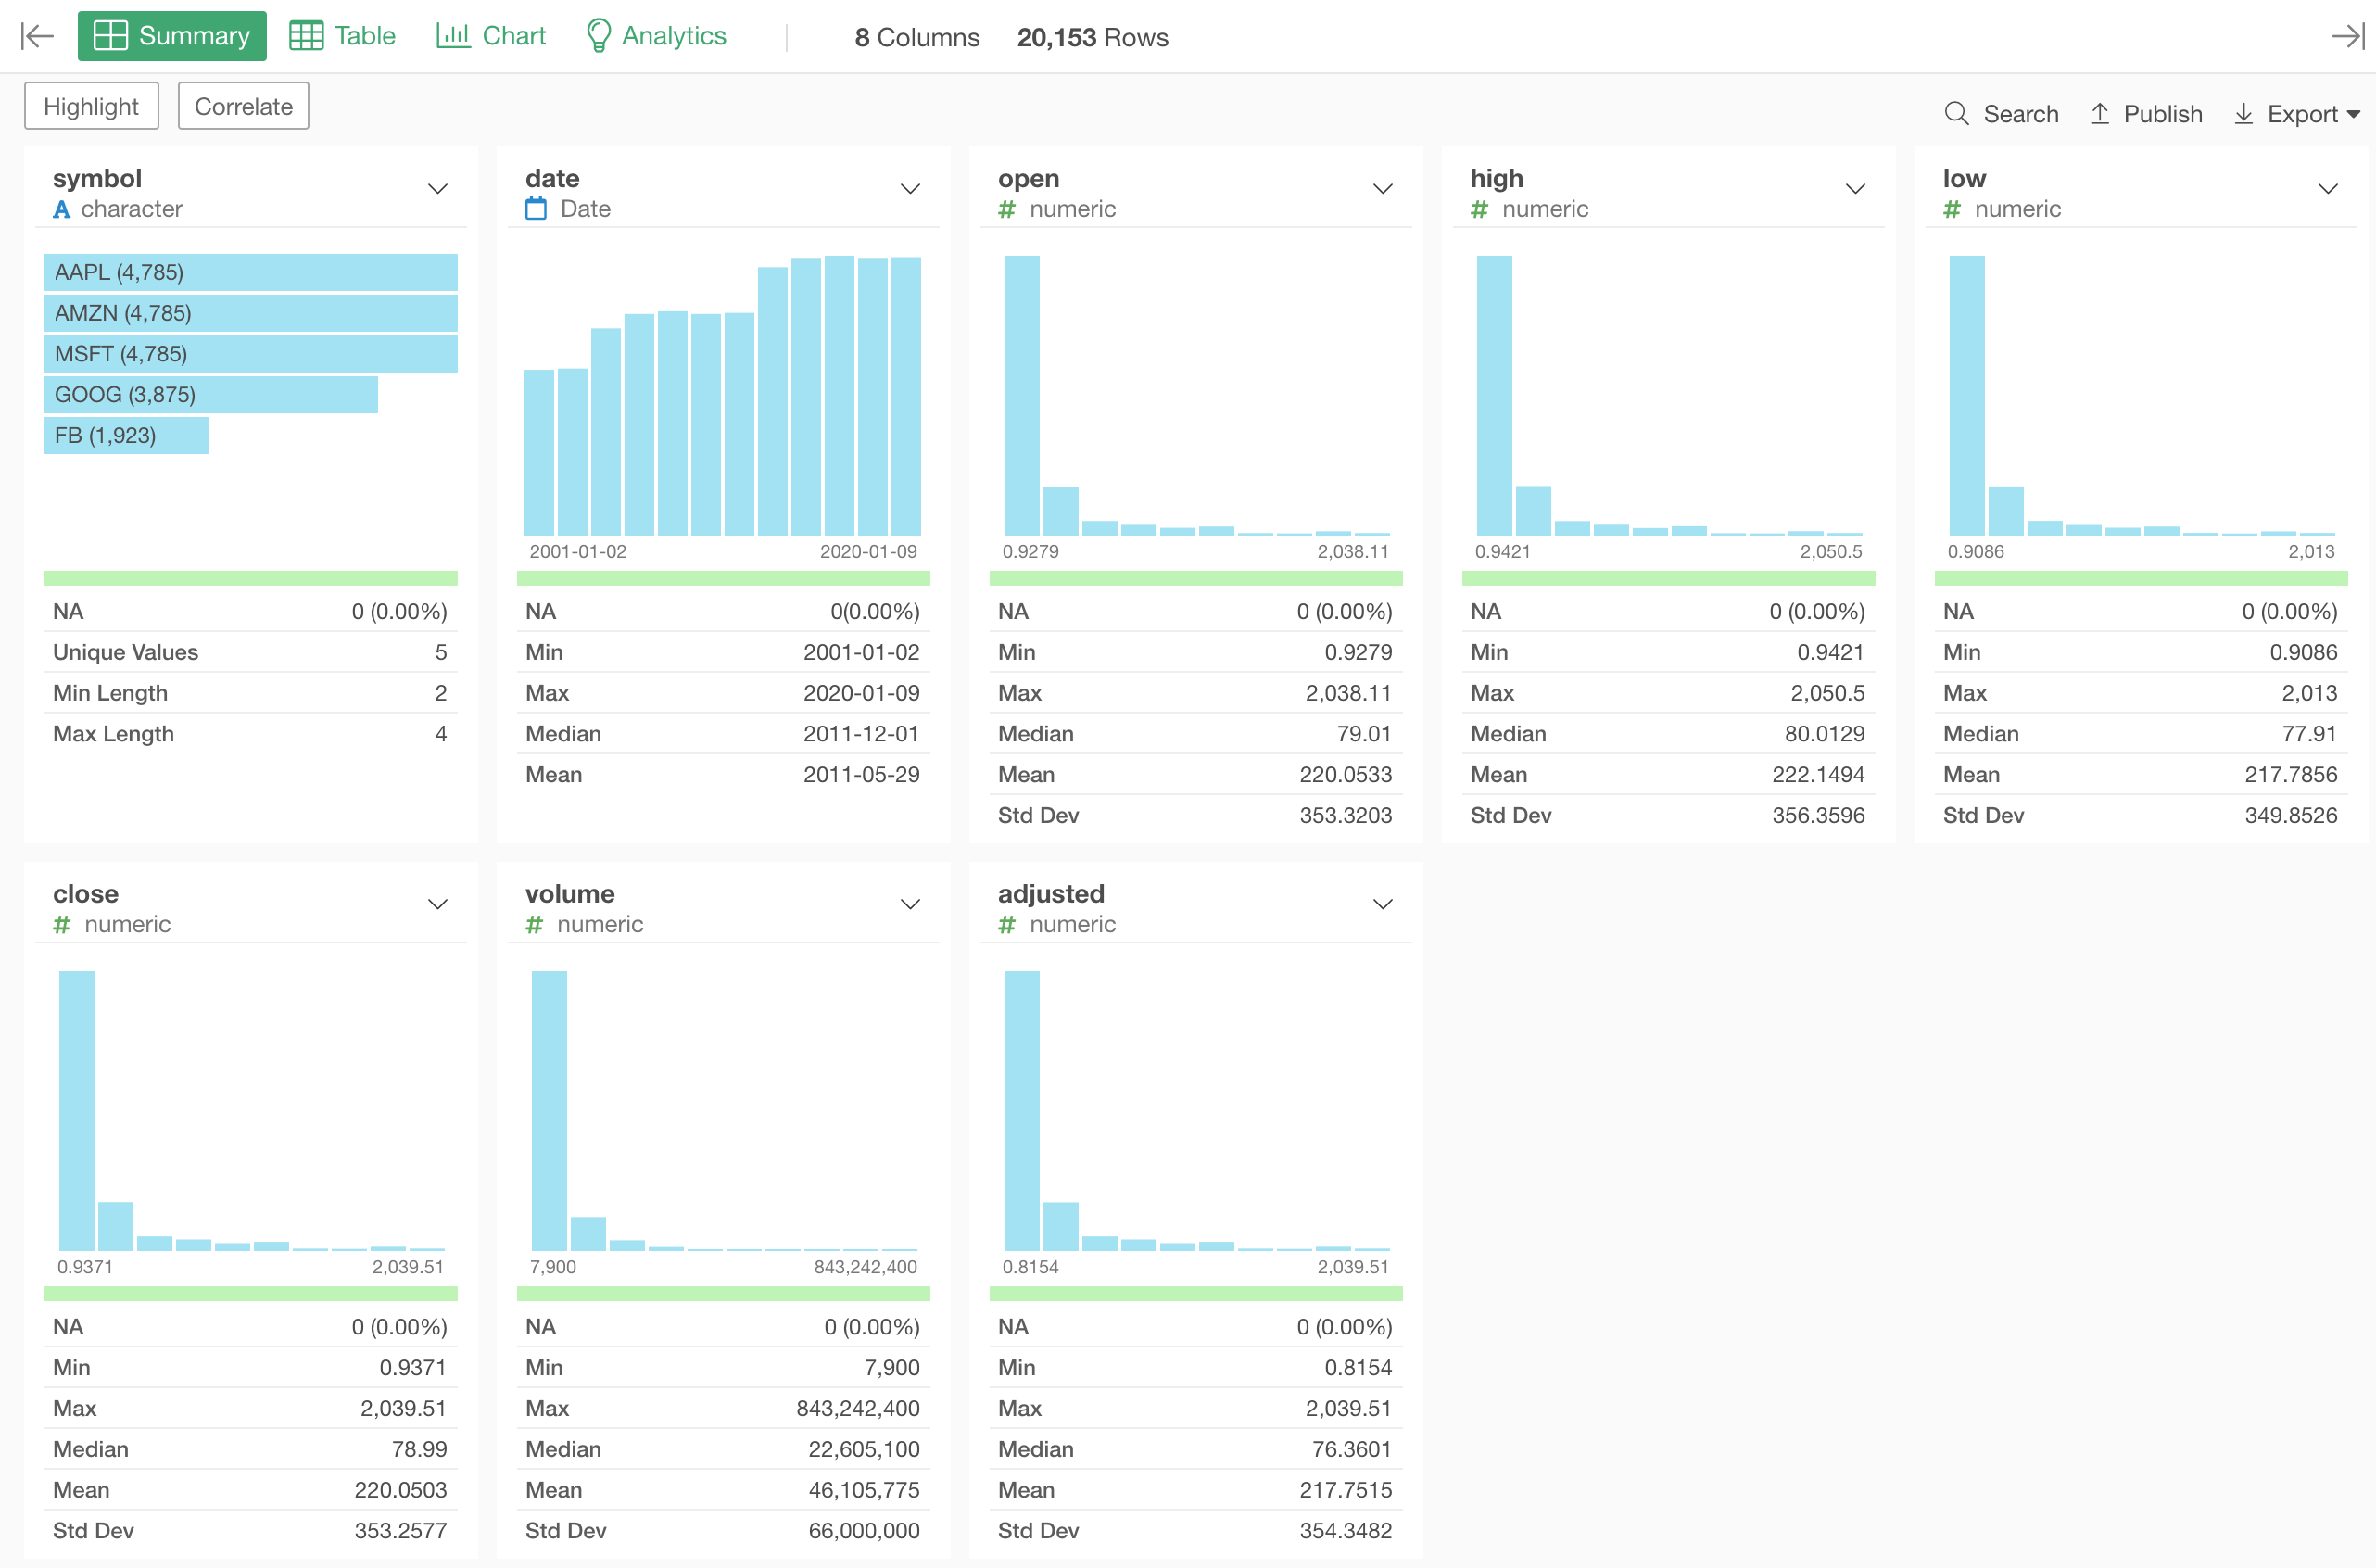
3. Visualize Data
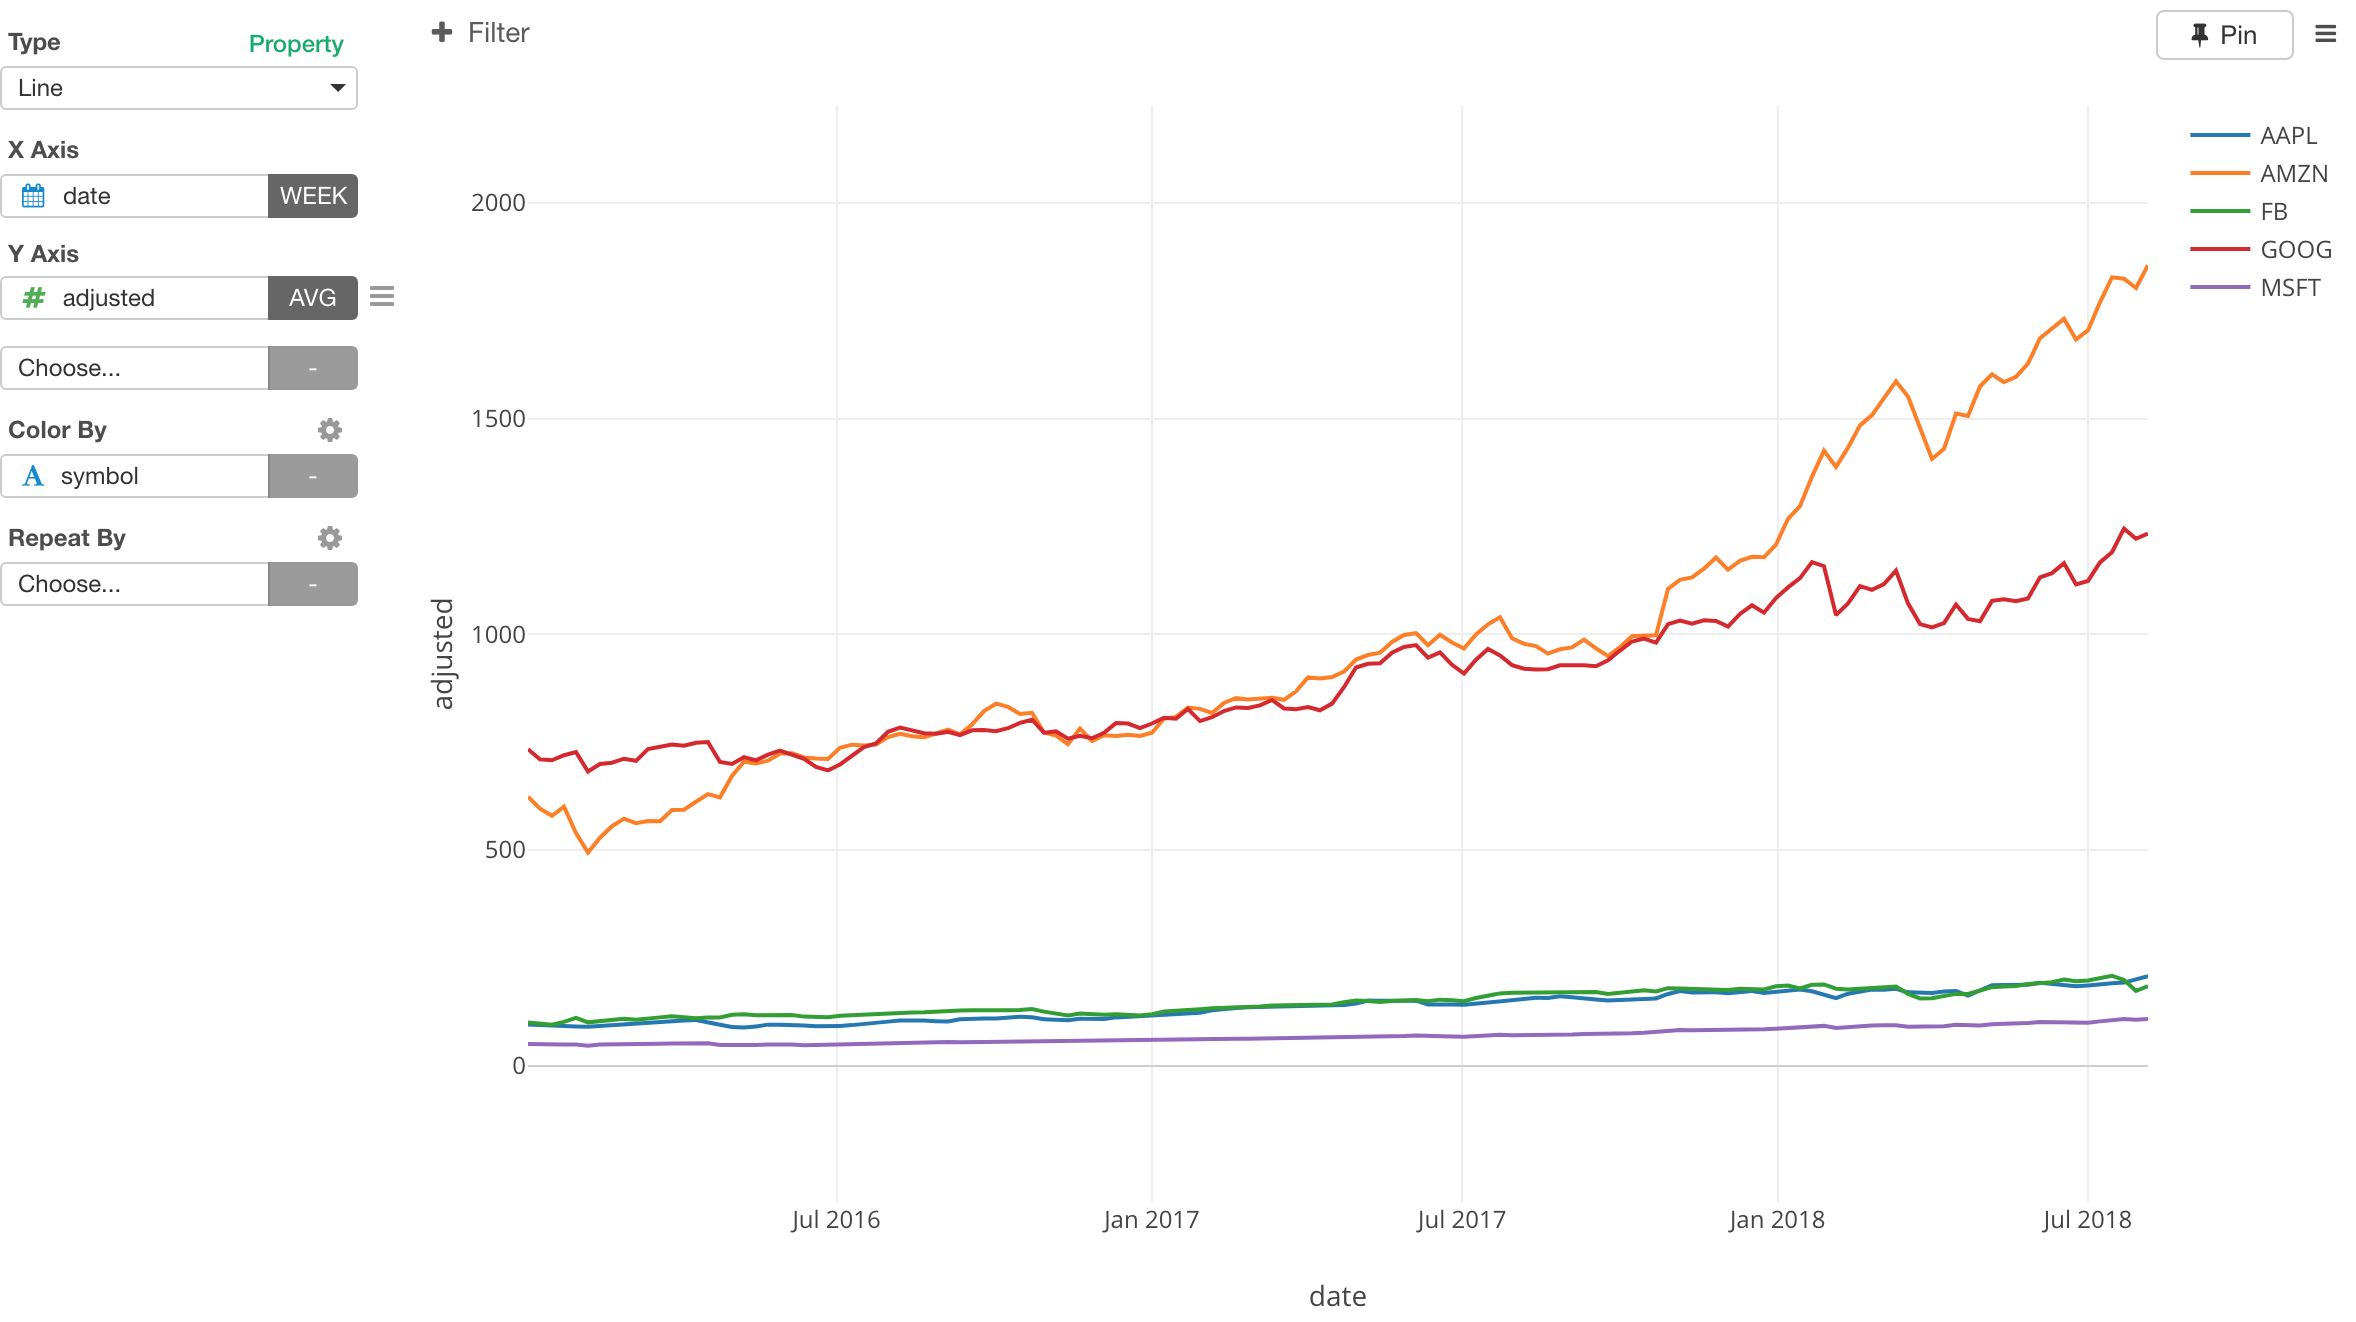
You can assign the date column 'date' to X-Axis, a column like 'adjusted' (adjusted price for the historical stock splits) to Y-Axis, and the symbol column to Color.
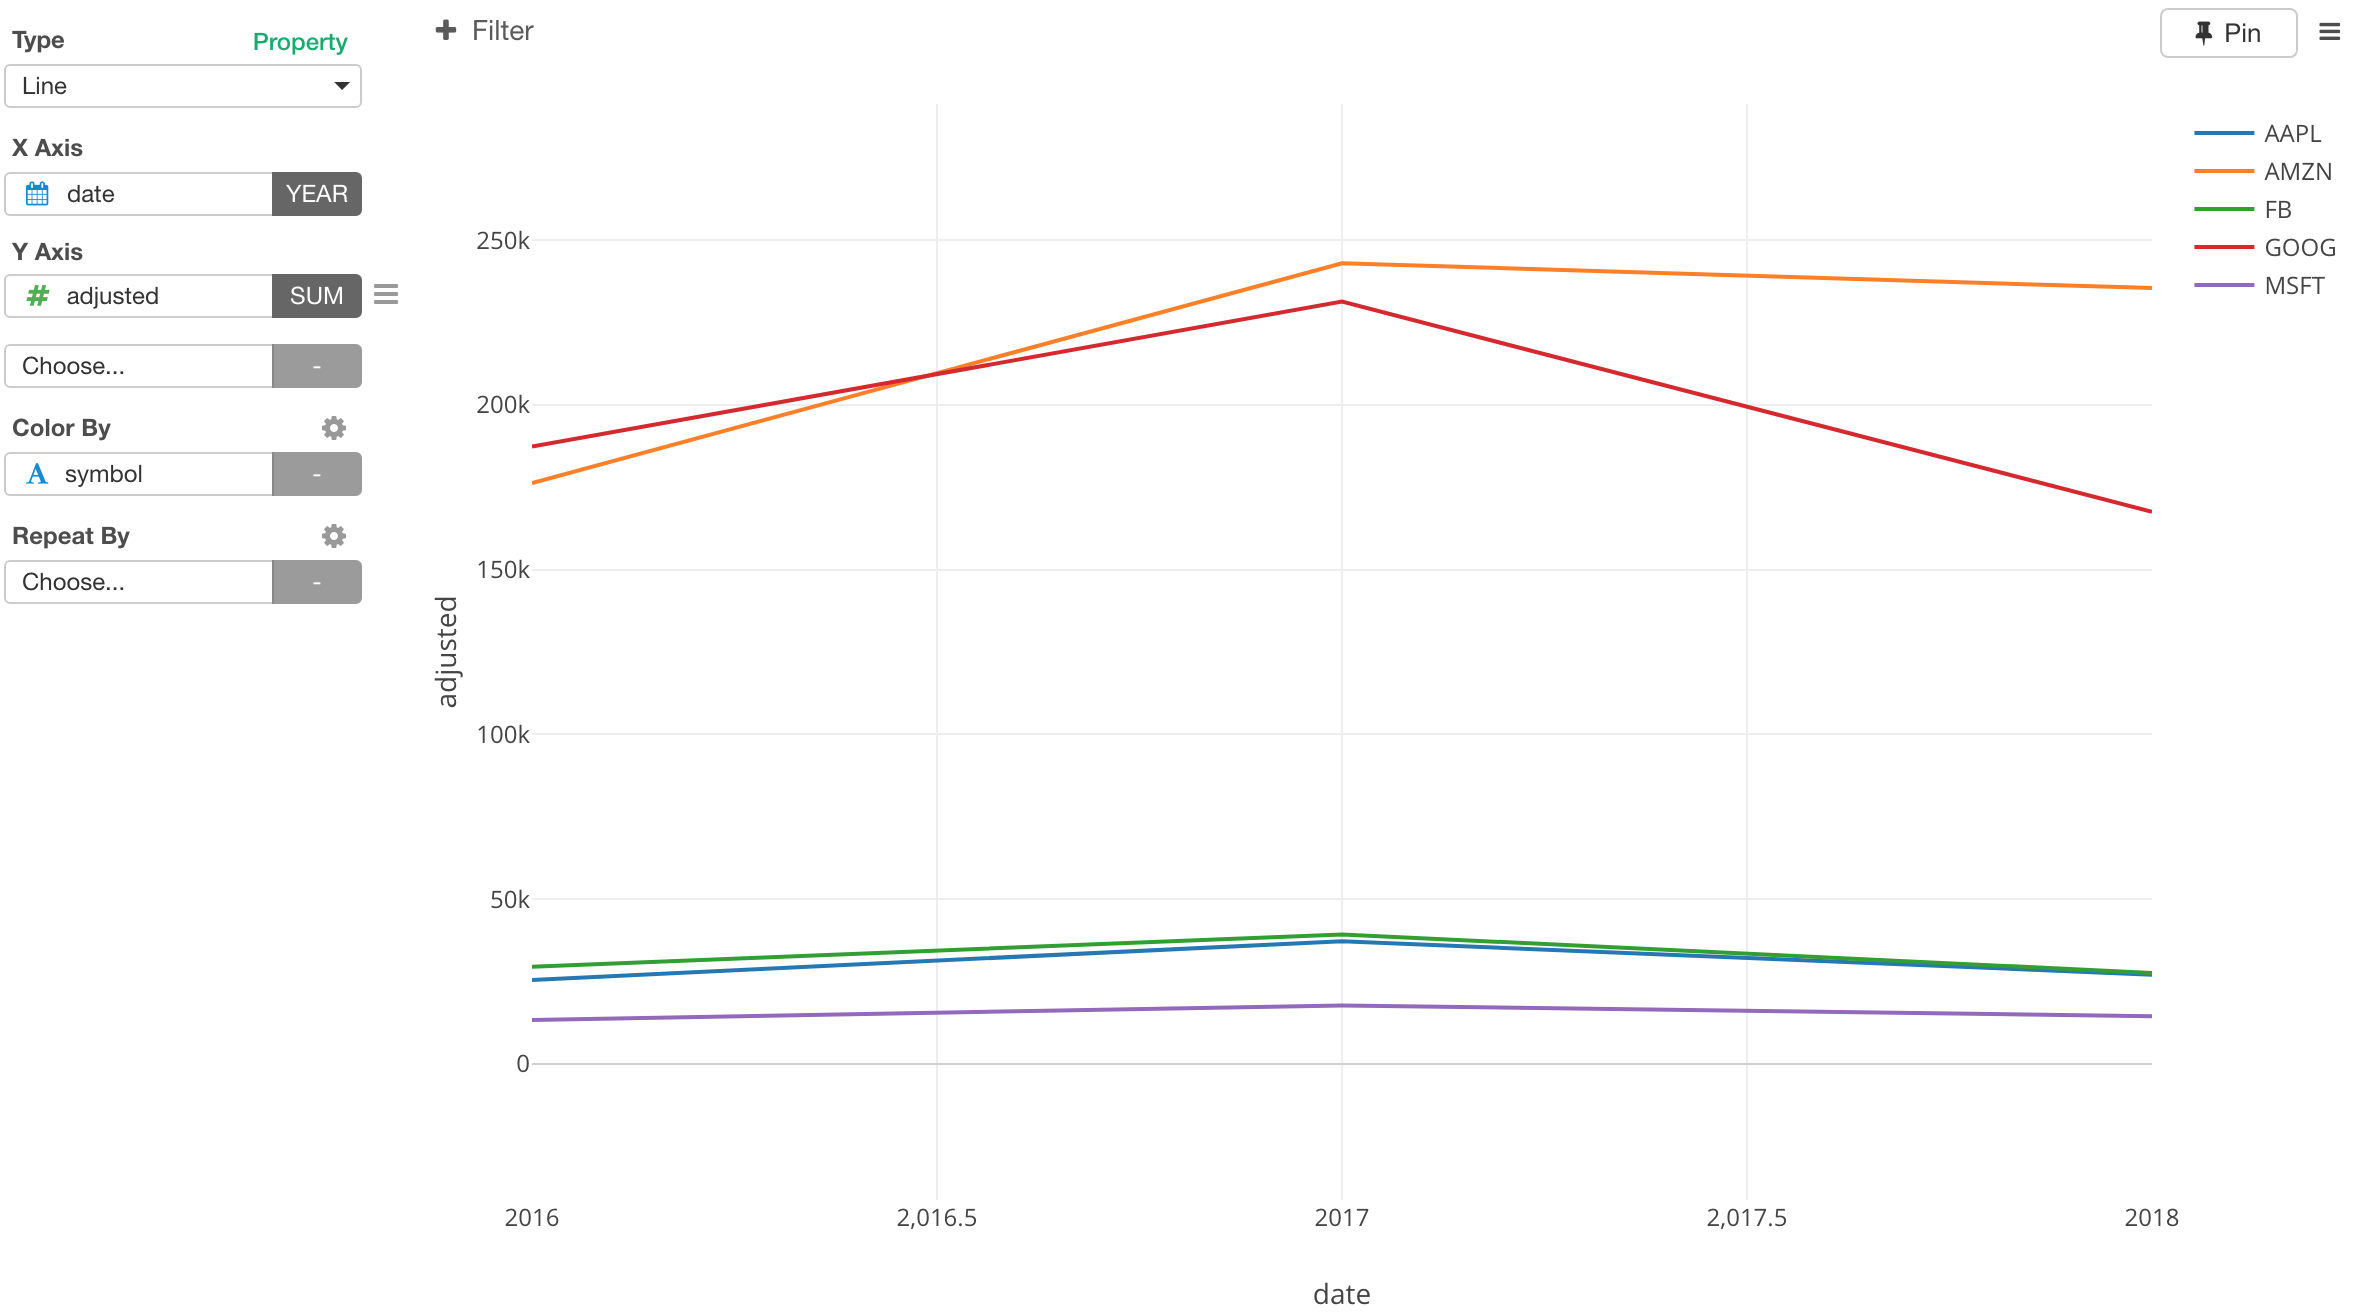
The default is to aggregate by Year. You can change this to other duration like Month, Week, Day, etc. Also, you can change the aggregation calculation, most likely you want to set to Average in this case.
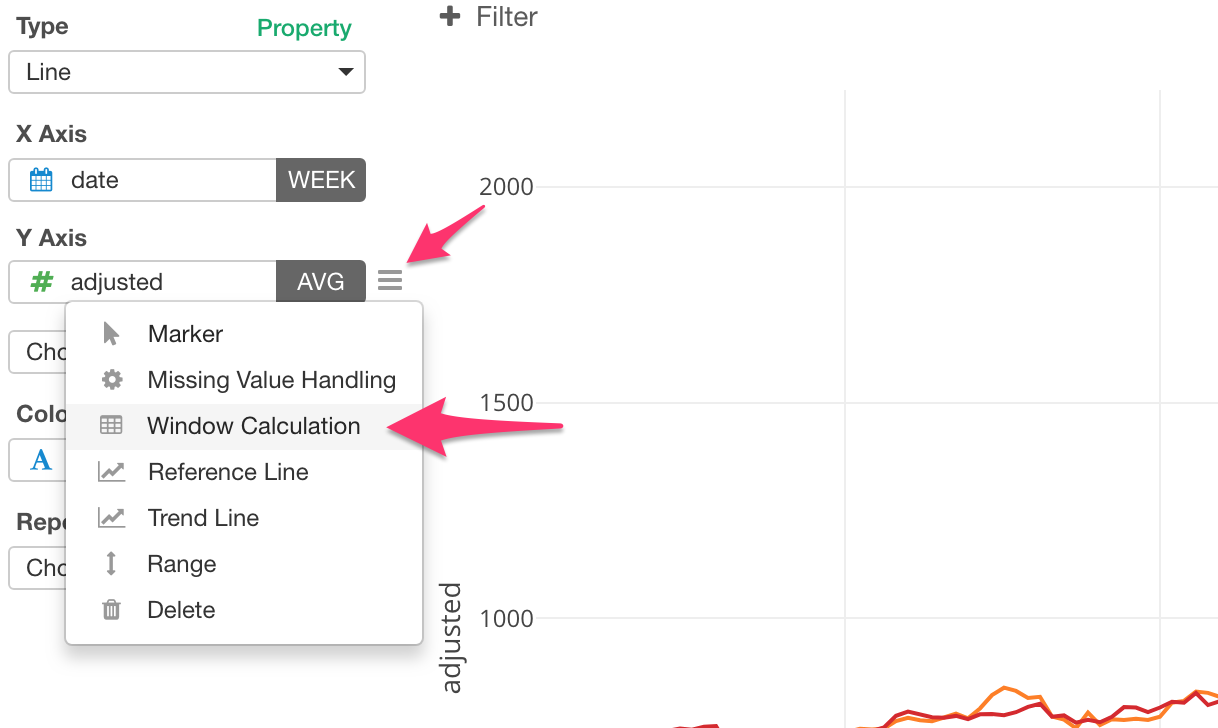
Use Window Calculations
When comparing the trends among the stocks, I'd recommend you try a few Window Calculaitons such as Percent Difference, Moving Average, etc.
Percent Difference
Here, I'm using '% of Difference From' calculation type and setting 'First Value' to '% of Difference From'. All the values presented here are the calculation of how much are the differences between any given dates and the first date of this data presented in precent.
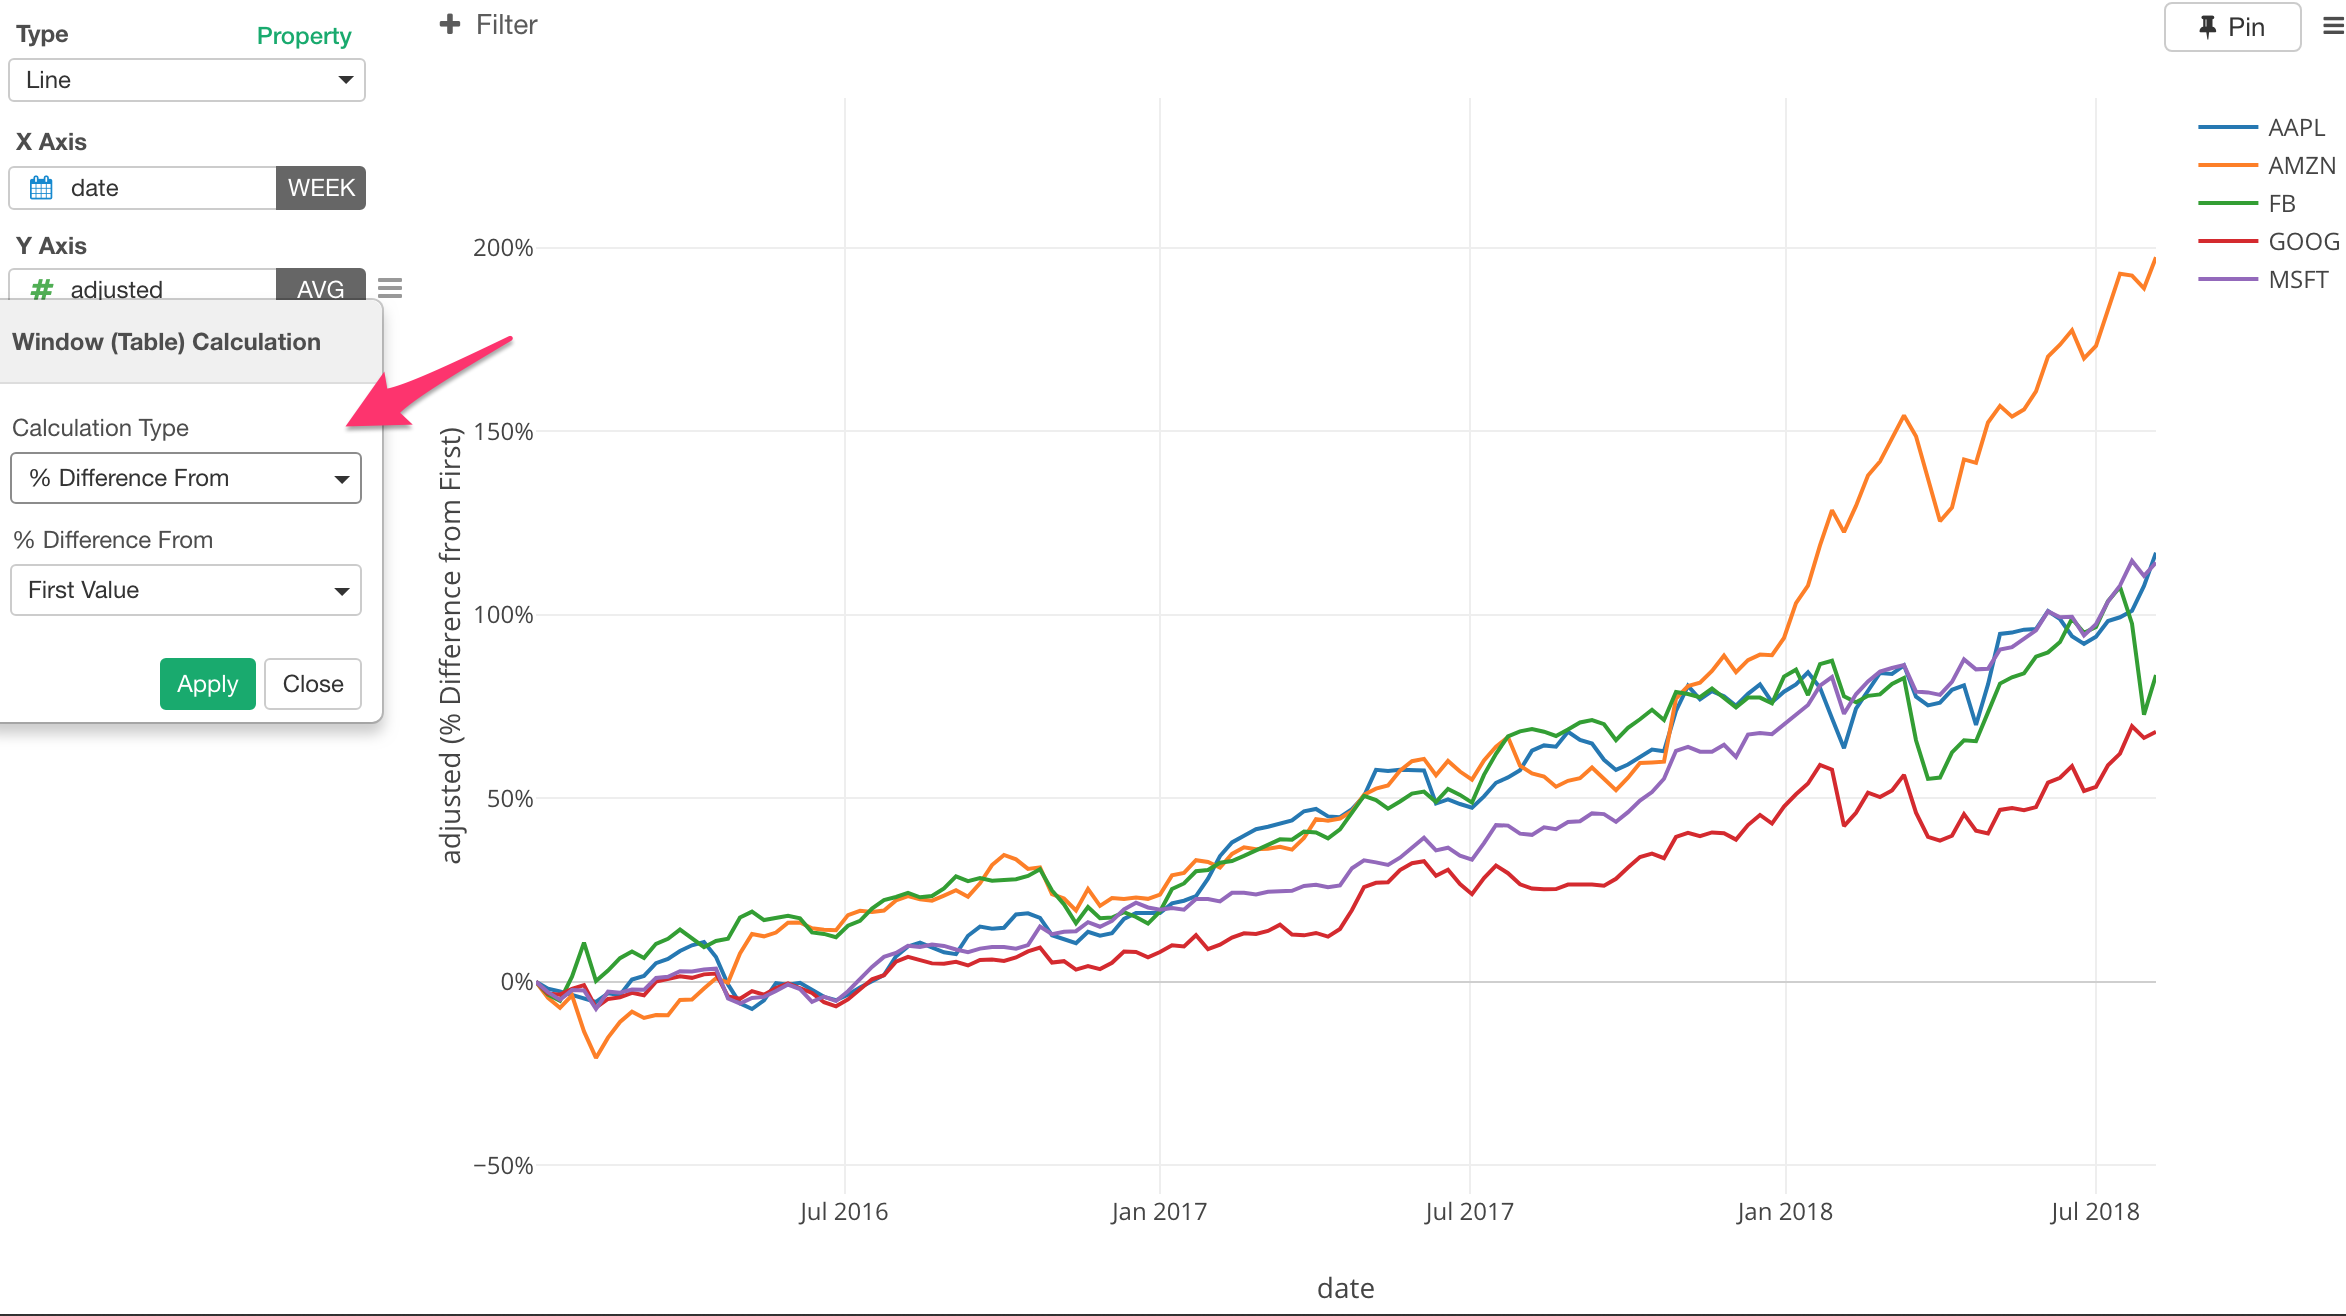
This will allow us to compare the different stocks with different price ranges in a context of the growth.
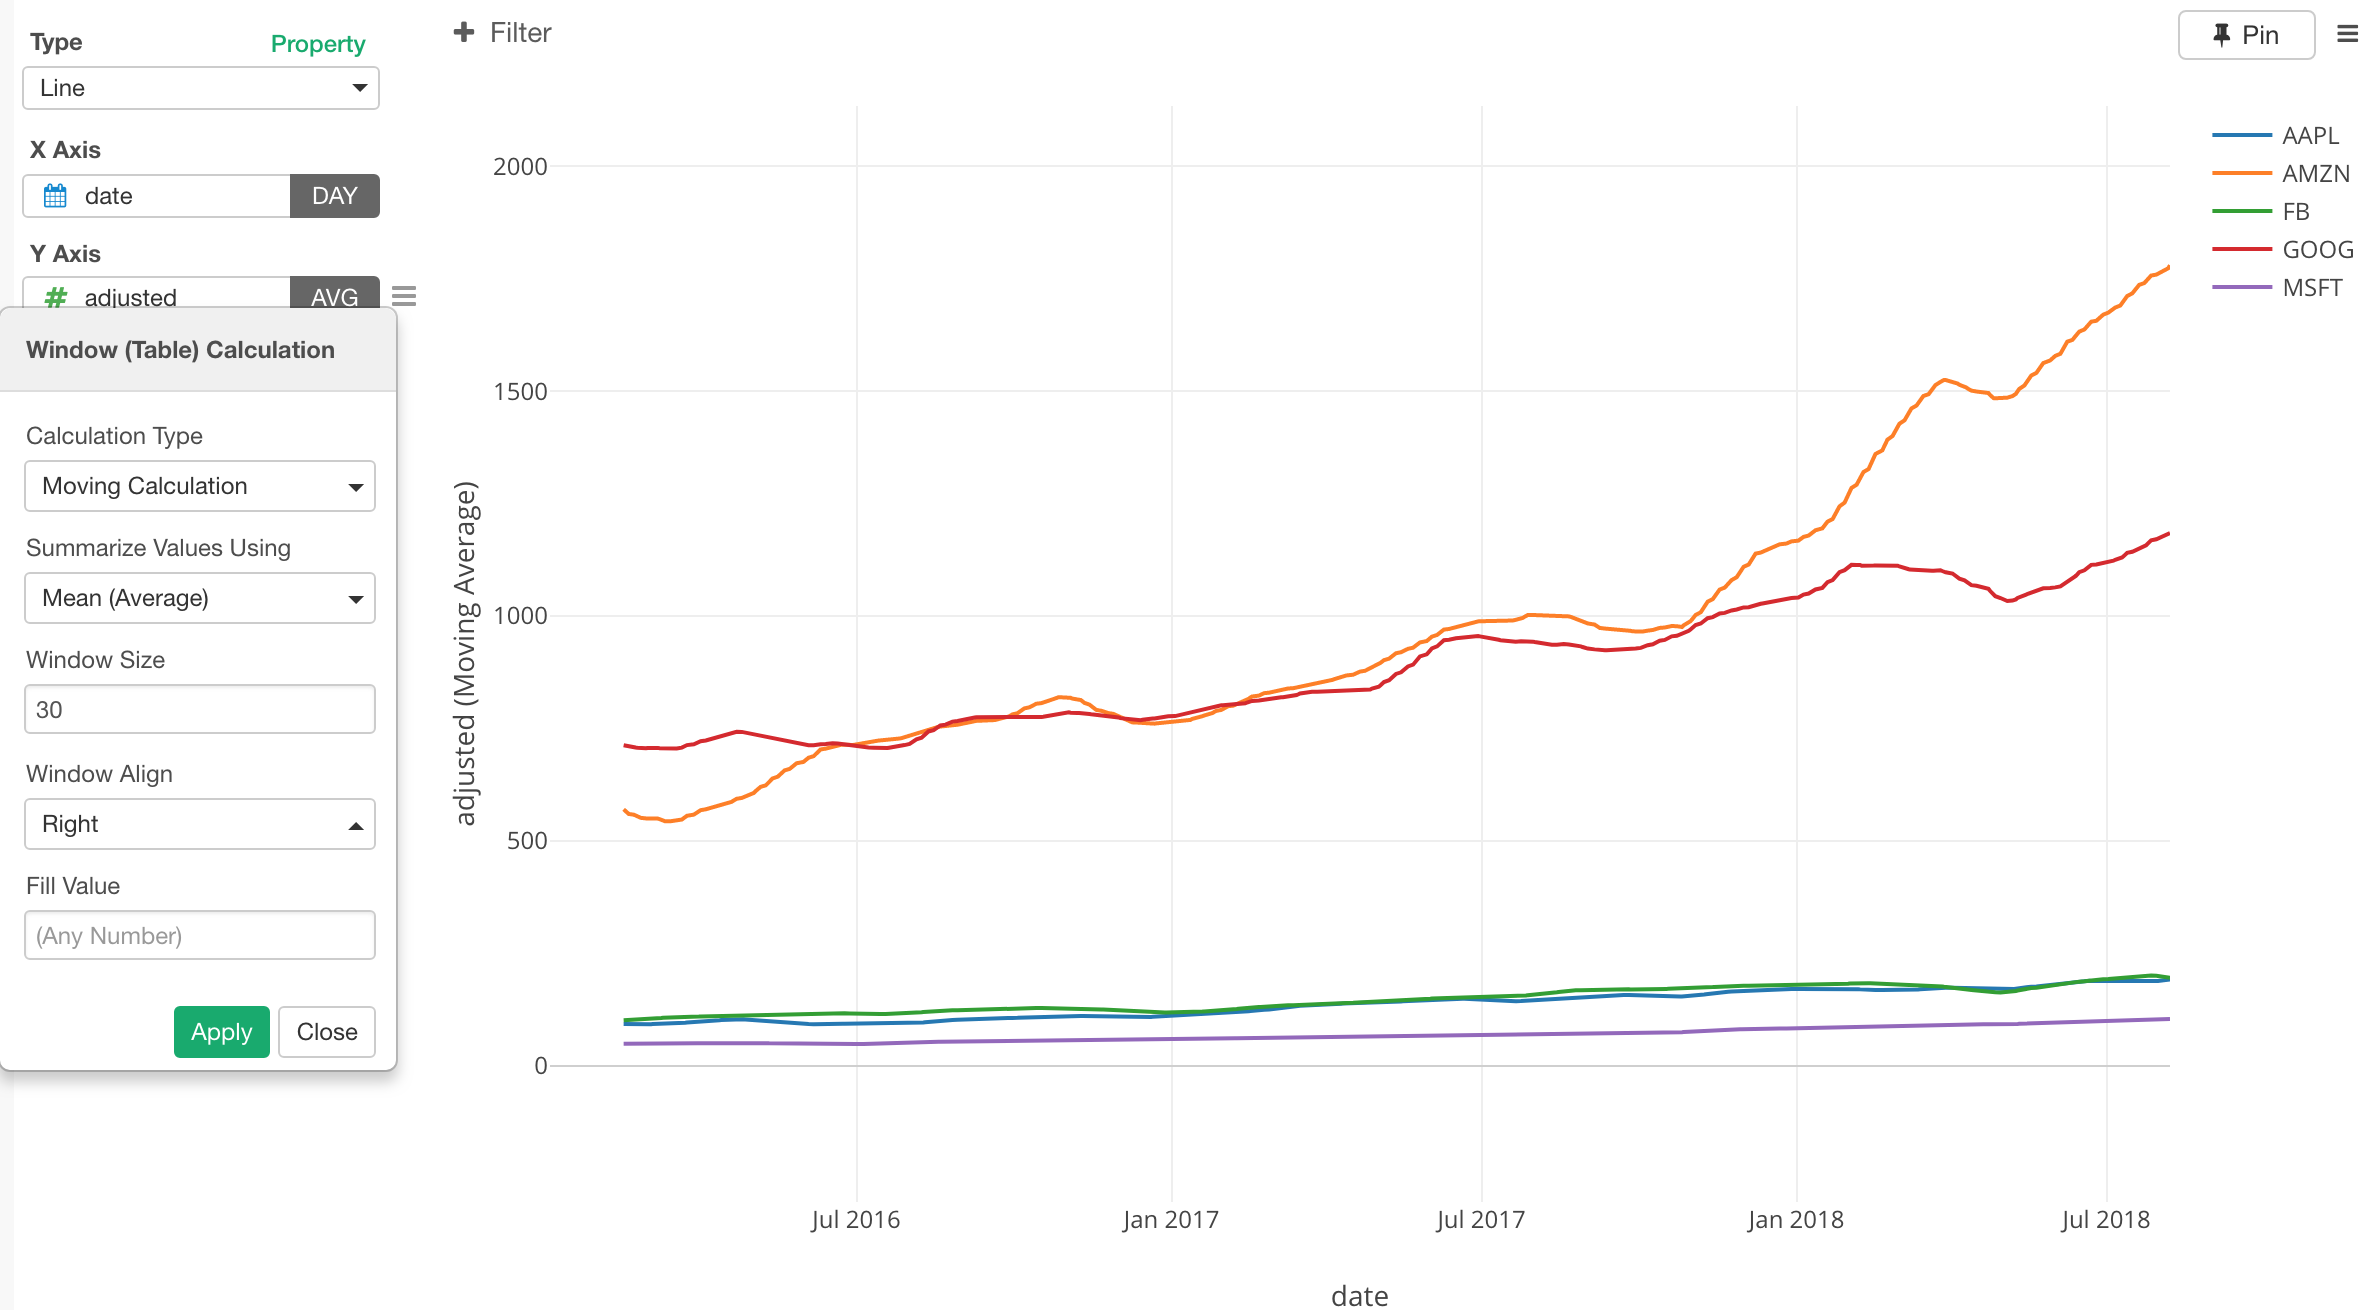
Moving Average
The stock prices move ups and downs frequently and sometimes dramatically. You might want to use Moving Average to smooth the lines to see the overall trends better.
Here, I'm setting it to caclulate the average of the past 30 days of any given date.
There are many different ways to visualize the data. Take a look at this How To page for more.