Introduction to CatBoost: How It Differs from LightGBM and XGBoost, and Why It Works Well with Categorical Data
In recent years, gradient boosting algorithms such as XGBoost, LightGBM, and CatBoost have become popular choices for building accurate predictive models on tabular business data.
At Exploratory, we added support for CatBoost in version 15.5, based on requests from our users.
So, what is CatBoost?
To understand why CatBoost is useful, it helps to look at the kind of data we often work with in the real world.
Business data does not always come neatly packaged as numbers.
Customer data often includes fields such as customer segment, region, industry, and subscription plan. Marketing data may include campaigns, ad channels, and traffic sources. Survey data often contains response categories and demographic attributes.
In other words, business data is full of categorical variables.
CatBoost is a machine learning algorithm designed to build high-performing predictive models, especially when your data contains many categorical variables.
In this post, I’ll explain what CatBoost is, how it differs from XGBoost and LightGBM, and why it is especially useful for business data with many categories.
CatBoost can be particularly effective when your data includes variables such as:
- Customer segment
- Region
- Product category
- Industry
- Subscription plan
- Campaign
- Ad channel
- Survey responses
We’ll cover:
- What problem CatBoost was designed to solve
- How it differs from Random Forest, XGBoost, and LightGBM
- Why CatBoost handles categorical variables well
- What kinds of data CatBoost is good for
- When you should consider using CatBoost
If you’d like to learn more about LightGBM, you may also find this article helpful:
The Problem CatBoost Tries to Solve
Suppose you want to predict customer churn based on data like this:
| Customer Segment | Region | Plan | Industry | Monthly Revenue | Churn |
|---|---|---|---|---|---|
| SMB | West | Starter | Retail | 120 | TRUE |
| Enterprise | East | Business | Finance | 2500 | FALSE |
| Mid-Market | Central | Pro | SaaS | 850 | FALSE |
In this data, Monthly Revenue is numeric, but everything else is categorical.
In many real-world business datasets, categorical variables are not a minor. They are often a major part of the data.
But most machine learning algorithms cannot directly understand text values such as:
Starter
Business
Pro
These values need to be converted into numbers before they can be used by a model.
This is where CatBoost starts to become interesting.
Random Forest: Many Independent Trees
Random Forest builds many decision trees independently and combines their results.
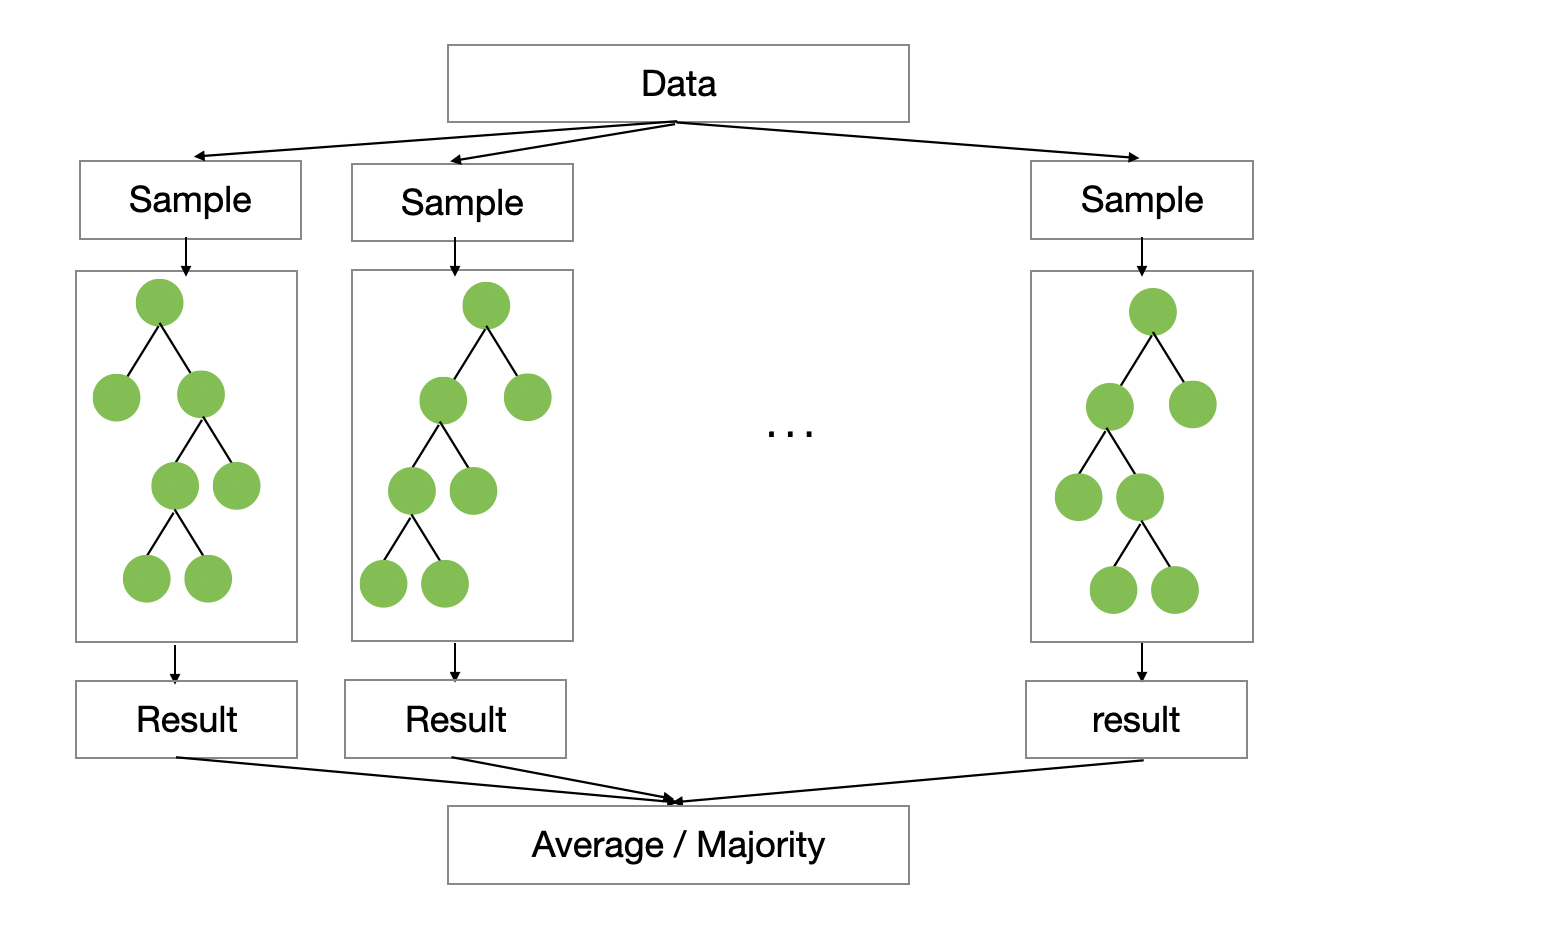
Each tree follows a process like this:
- Randomly sample rows from the data.
- Randomly select a subset of variables when splitting.
- Let each tree make its own prediction.
The final prediction is based on the average prediction for regression, or the majority vote for classification.
The core idea is simple: by combining many independent trees, Random Forest reduces the instability of a single decision tree and produces more stable predictions.
However, the trees do not learn from each other.
Each tree is built independently. One tree does not try to fix the mistakes made by another tree.
As a result, Random Forest is often easy to use and fairly robust, but it may not achieve the same level of predictive accuracy as modern boosting algorithms.
XGBoost: Trees That Correct Previous Mistakes
XGBoost uses a method called gradient boosting.
Instead of building many trees independently, it builds trees sequentially. Each new tree tries to correct the mistakes made by the trees that came before it.
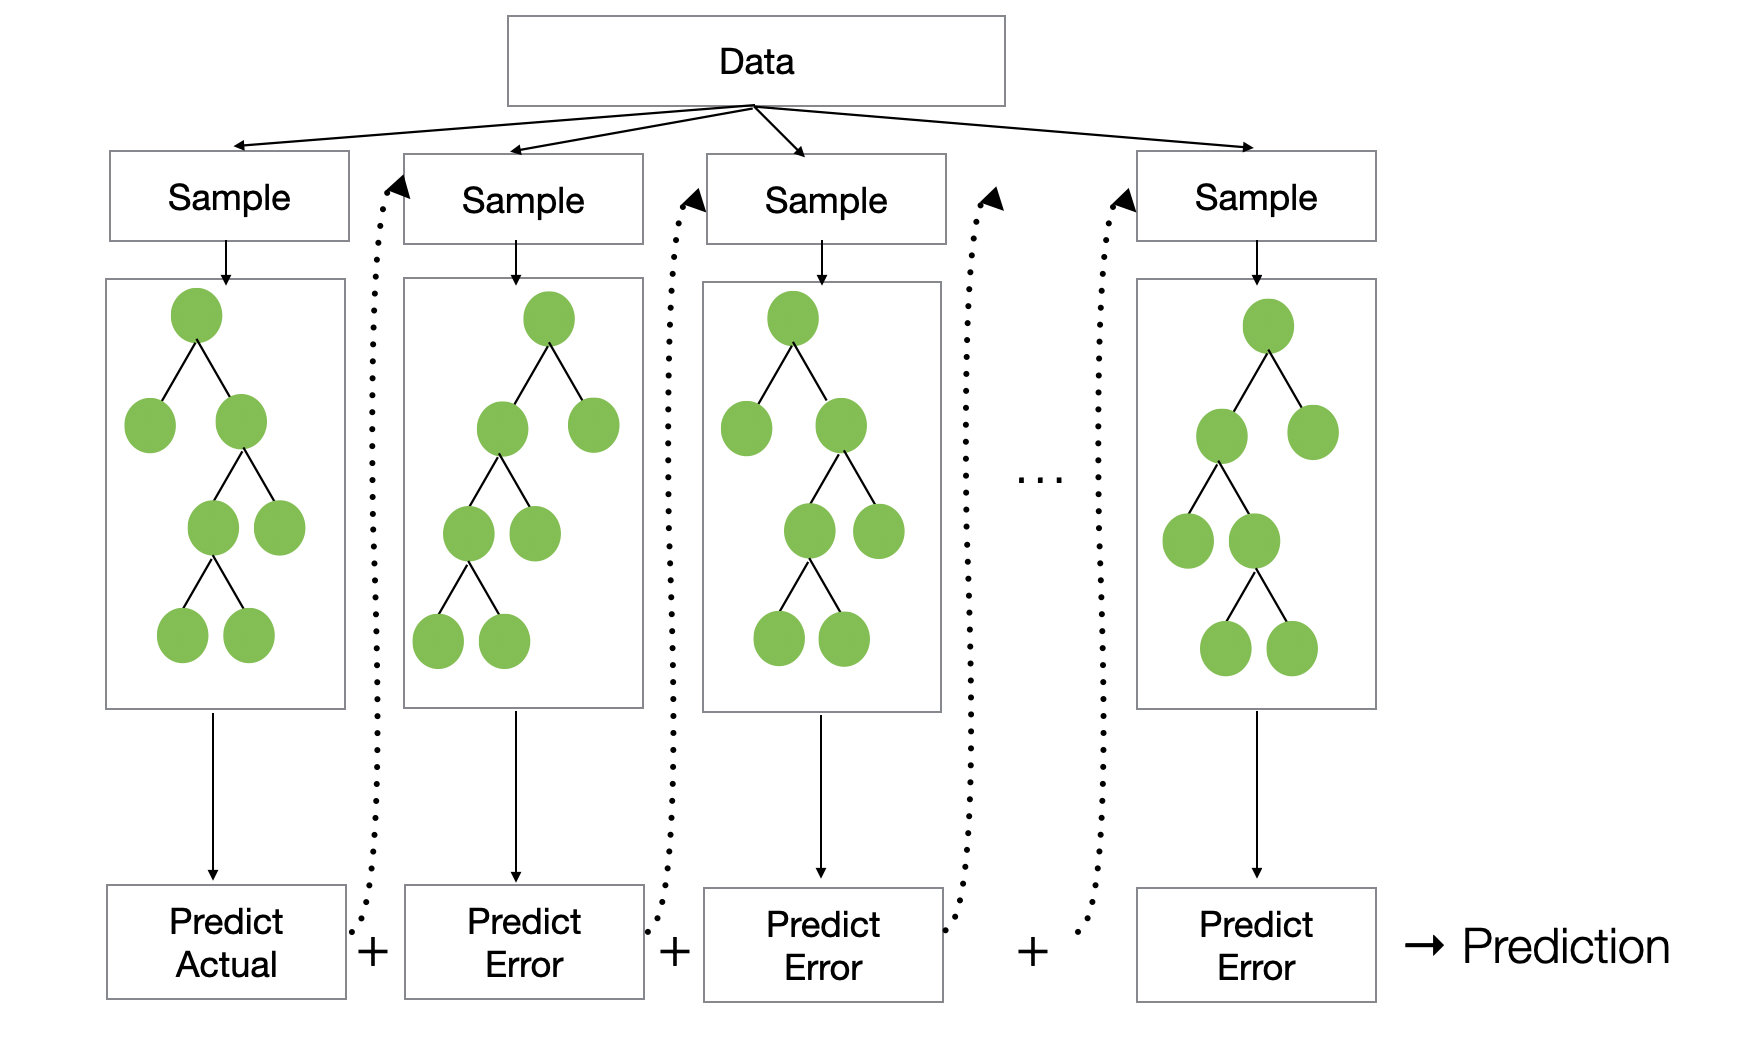
For example, in a regression problem, the first tree makes an initial prediction. Then the model calculates the errors, or residuals, between the actual values and the predicted values.
| Row | Actual Value | Predicted Value | Residual |
|---|---|---|---|
| 1 | 10 | 7 | 3 |
| 2 | 15 | 14 | 1 |
| 3 | 8 | 9 | -1 |
The next tree is trained not to predict the original target directly, but to predict these residuals.
Why?
Because the residuals tell the model how it should adjust its predictions to reduce the loss.
Conceptually, the model evolves like this:
Tree 1 → Initial prediction
Tree 2 → Corrects the errors from Tree 1
Tree 3 → Corrects the remaining errors
Tree 4 → Continues improving the prediction
The updated prediction can be thought of as:
New prediction = Prediction from previous trees + Learning rate × Prediction from the new treeThis process often produces higher accuracy than Random Forest.
However, as data becomes larger and more complex, building many trees sequentially can become computationally expensive.
LightGBM: Built for Speed and Scale
LightGBM is also a gradient boosting algorithm, but it was designed to make boosting faster and more scalable.
It uses several techniques to improve performance, including:
- Histogram-based splitting
- Leaf-wise tree growth
- Gradient-based One-Side Sampling, or GOSS
- Exclusive Feature Bundling, or EFB
LightGBM is especially useful when:
- The dataset has many rows.
- There are many explanatory variables.
- Training speed matters.
- You need to scale to larger data.
Because of this, LightGBM has become one of the most widely used machine learning algorithms for practical business applications.
For more details, see:
So What Makes CatBoost Different?
CatBoost is also a gradient boosting algorithm, just like XGBoost and LightGBM.
The overall learning process is similar: it builds many trees sequentially, and each new tree helps improve the predictions made so far.
But CatBoost has one major design focus:
CatBoost was designed to handle categorical variables effectively.
This makes it especially useful when your data includes categorical variables with many possible values, such as:
- Product categories
- Campaign IDs
- Regions
- Stores
- User segments
- Features used by customers
- Survey responses
These are sometimes called high-cardinality categorical variables.
To understand why CatBoost matters, let’s first look at the common ways categorical variables are handled.
The Problem with One-Hot Encoding
A common way to handle categorical variables is one-hot encoding.
For example, suppose you have a subscription plan column like this:
| Plan |
|---|
| Starter |
| Pro |
| Business |
One-hot encoding turns each category into a separate column:
| Starter | Pro | Business |
|---|---|---|
| 1 | 0 | 0 |
| 0 | 1 | 0 |
| 0 | 0 | 1 |
This works fine when the number of categories is small.
But what if you have:
- 500 product categories
- 1,000 regions
- 10,000 campaign IDs
Then one-hot encoding creates a very large number of columns.
This can cause several problems:
- Higher memory usage
- Slower training
- Sparse data
- Higher risk of overfitting
So one-hot encoding is not always ideal, especially for business data with many categorical variables.
Target Encoding: A More Informative Alternative
Another approach is called target encoding.
Instead of turning each category into many binary columns, target encoding replaces each category with a statistic calculated from the target variable.
For example, if you are predicting churn, you might calculate the churn rate for each subscription plan:
| Plan | Churn Rate |
|---|---|
| Starter | 67% |
| Business | 0% |
Then the model can use this information directly.
For example:
Starter → 0.67
Business → 0.00
This gives the model useful information:
“Customers on the Starter plan tend to churn more often.”
Target encoding can be very powerful, especially for categorical variables with many levels.
But it also has a serious risk.
The Risk of Data Leakage
Suppose you have this small dataset:
| Customer | Plan | Churn |
|---|---|---|
| A | Starter | 1 |
| B | Starter | 0 |
| C | Starter | 1 |
If you calculate the churn rate for the Starter plan, you get:
2 / 3 = 0.67So you might encode the Starter plan as:
Starter → 0.67But there is a problem.
When you calculate the value 0.67, you are using the target value, Churn, from all rows, including the row you are trying to predict.
For Customer A, the encoded value includes Customer A’s own churn result.
That means you are using the answer to create an input variable.
This is a form of data leakage.
When this happens, the model may look very accurate on the training data, but it may perform poorly on new data because it has learned from information that would not be available in a real prediction setting.
This is one of the problems CatBoost was designed to address.
Ordered Target Statistics
CatBoost uses a technique called Ordered Target Statistics to reduce leakage when encoding categorical variables.
The idea is simple:
When calculating the encoded value for a row, use only the rows that come before it.
Let’s use the same example.
Suppose the data is arranged in a random order:
| Order | Customer | Plan | Churn |
|---|---|---|---|
| 1 | A | Starter | 1 |
| 2 | B | Starter | 0 |
| 3 | C | Starter | 1 |
| 4 | D | Starter | 1 |
Assume the overall churn rate, used as the prior, is 50%.
CatBoost converts the Plan variable like this:
| Order | Customer | Plan | Churn | Encoded Value |
|---|---|---|---|---|
| 1 | A | Starter | 1 | 0.50 |
| 2 | B | Starter | 0 | 1.00 |
| 3 | C | Starter | 1 | 0.50 |
| 4 | D | Starter | 1 | 0.67 |
What is happening here?
For Customer A, there are no previous Starter customers, so CatBoost uses the prior:
A → No previous Starter customers → Use 0.50For Customer B, the only previous Starter customer is A:
B → Previous Starter customers: A → Churn rate = 1 / 1 = 1.00For Customer C, the previous Starter customers are A and B:
C → Previous Starter customers: A and B → Churn rate = (1 + 0) / 2 = 0.50For Customer D, the previous Starter customers are A, B, and C:
D → Previous Starter customers: A, B, and C → Churn rate = (1 + 0 + 1) / 3 = 0.67The key point is this:
The encoded value for each row is calculated without using that row’s own target value.
So CatBoost can still use the useful information that Starter customers tend to churn more often, while reducing the leakage that can happen with naive target encoding.
This is one of the main reasons CatBoost works well with categorical variables.
Ordered Boosting
CatBoost also uses another important idea called Ordered Boosting.
In standard gradient boosting, the model is trained on the full training data. Then it makes predictions on that same training data and calculates the errors. The next tree is trained to correct those errors.
At first glance, this seems reasonable.
But there is a subtle issue.
When the model predicts a row in the training data, that row has already been used to train the model. In other words, the model is predicting a row it has already seen.
In production, the situation is different. The model is asked to predict new data that it has not seen before.
This difference between the training-time prediction situation and the production-time prediction situation is sometimes called prediction shift.
CatBoost tries to reduce this shift by using a random order of the data.
When calculating the prediction for a row, CatBoost uses only the data that comes before that row in the random order.
For example, if the data is ordered as A, B, C, D, then when calculating the error for C, the model uses only A and B. It does not use C’s own target value to help predict C.
This makes the training process more similar to the real-world prediction process, where the model must predict data it has not seen before.
Ordered Target Statistics helps reduce leakage when encoding categorical variables.
Ordered Boosting helps reduce prediction shift during boosting.
Together, these ideas are a big part of what makes CatBoost different from XGBoost and LightGBM.
Symmetric Trees
Another important feature of CatBoost is that it uses symmetric trees, also called oblivious trees.
In a regular decision tree, different branches can use different split conditions.
Conceptually, it may look like this:
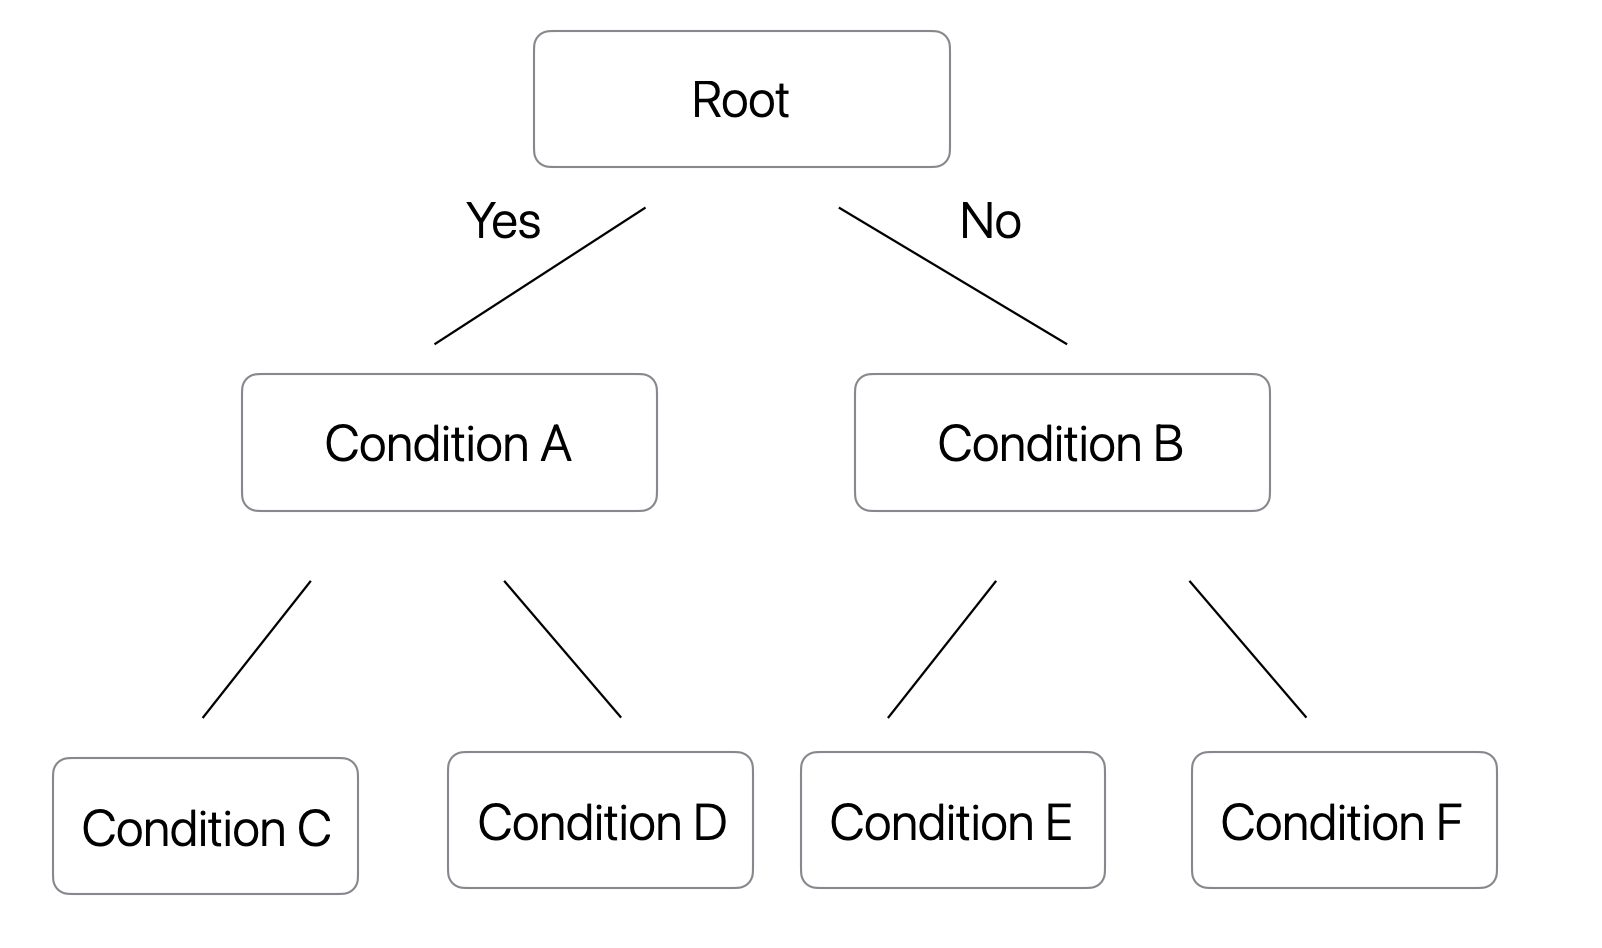
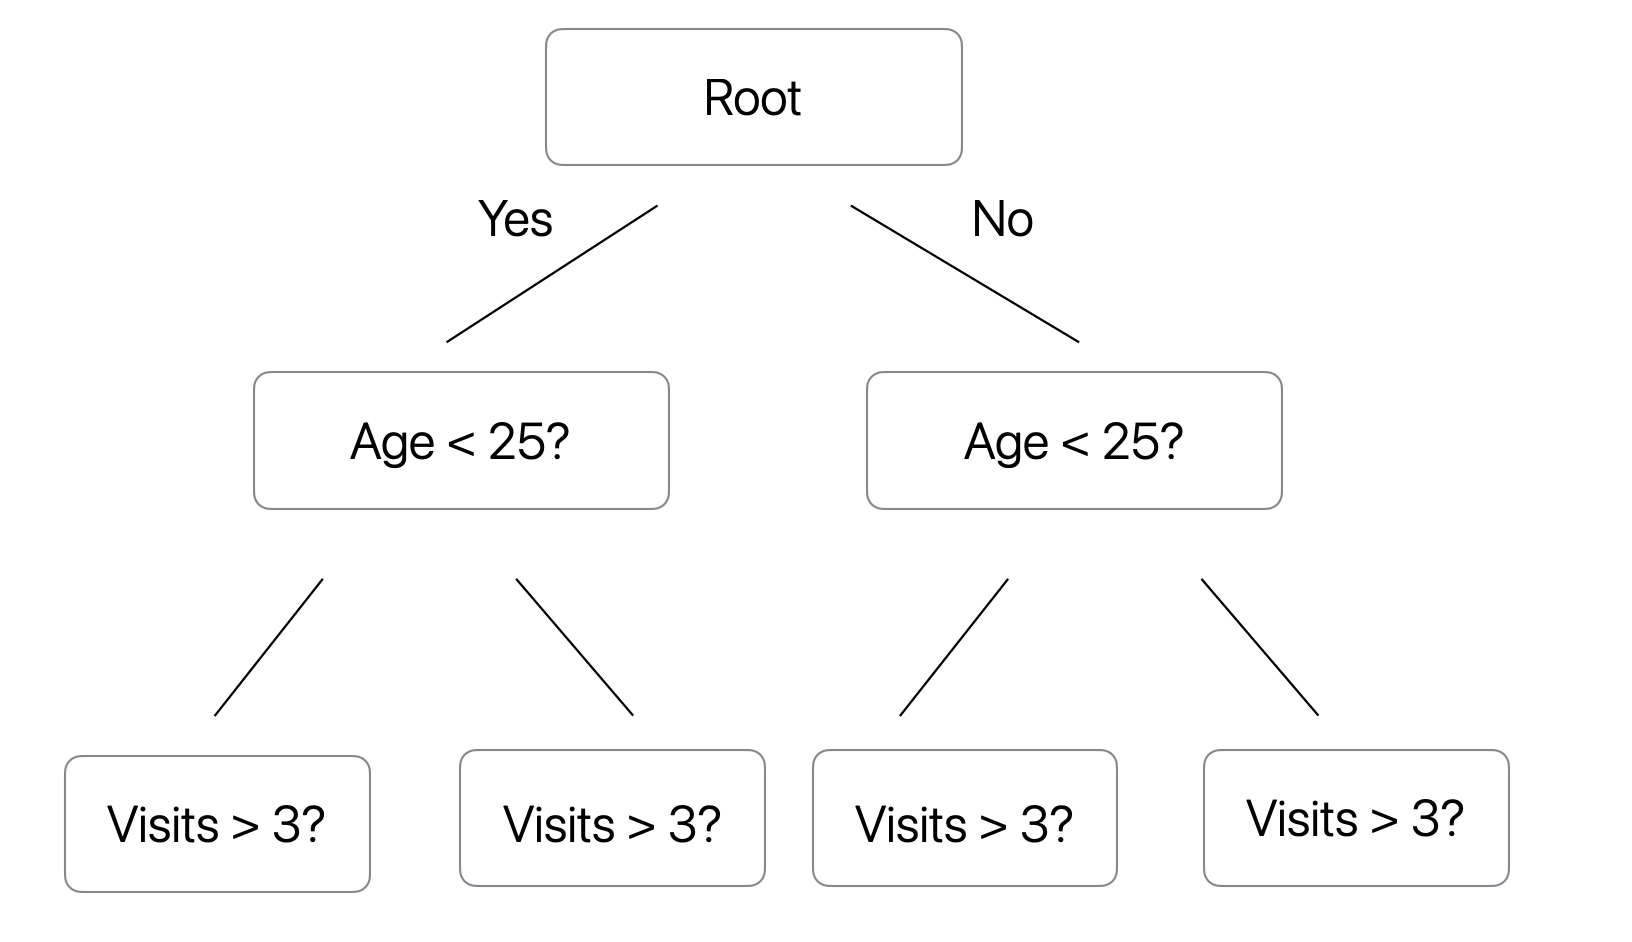
In a symmetric tree, all nodes at the same depth use the same split condition.
Conceptually, it looks like this:
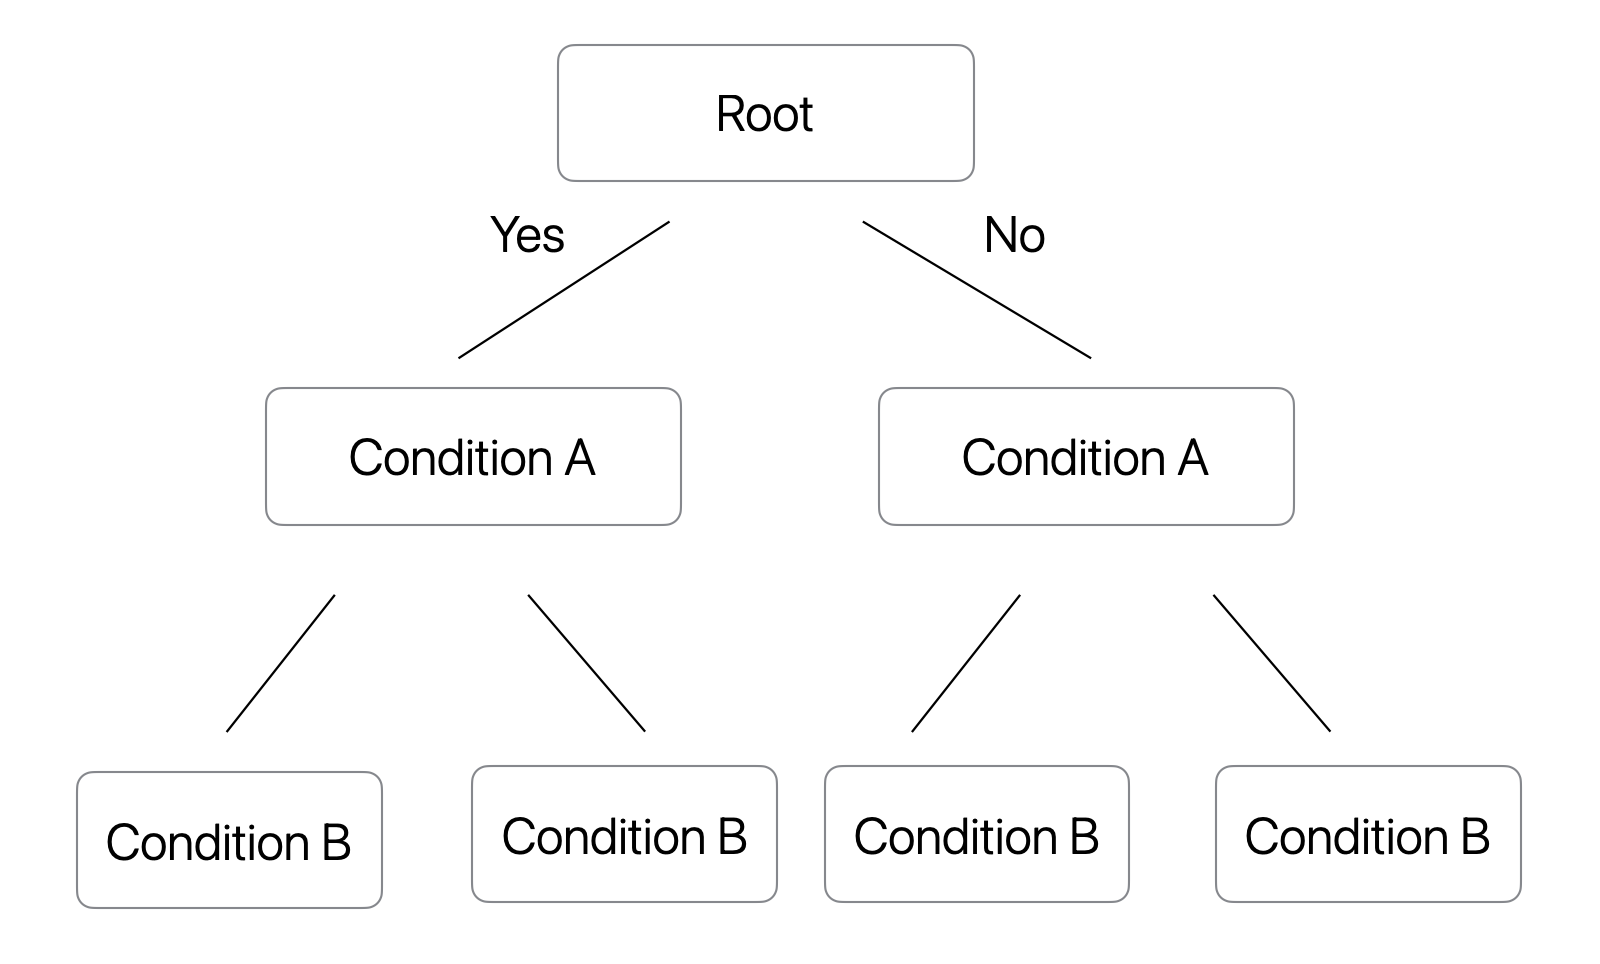
This means, one of the trees would look something like this.
At first, this may sound restrictive.
A regular decision tree can be more flexible because each branch can choose its own split condition.
But CatBoost is not trying to build one perfect tree.
It is a boosting model. It builds many relatively small trees and combines them.
One tree may capture a broad pattern. The next tree may correct part of the remaining error. Later trees continue refining the prediction.
So even if each individual symmetric tree is less flexible, the full boosted model can still be very expressive.
The symmetric tree structure also has several advantages:
- Faster prediction
- Better memory efficiency
- Simpler and more stable tree structure
- Lower risk of overfitting
- Good performance when many trees are combined
This is another example of CatBoost’s design philosophy: use a more controlled tree structure, then gain flexibility by combining many trees through boosting.
What CatBoost Cannot Protect You From
At this point, it may sound like CatBoost solves data leakage.
But that is not quite true.
CatBoost helps reduce leakage caused by target encoding of categorical variables.
It does not protect you from leakage already present in the data itself.
For example, suppose you are predicting customer churn and you include variables such as:
- Churn date
- Refund amount after cancellation
- Number of support tickets after cancellation
- Final billing status
- Cancellation reason
These variables would not be available at the time you actually need to make the prediction.
If you include them, any model can produce artificially high accuracy.
CatBoost cannot fix that.
The basic rule remains the same:
Use only the information that would be available at the time of prediction.
This is true for CatBoost, LightGBM, XGBoost, Random Forest, and any other predictive model.
How XGBoost and LightGBM Handle Categorical Variables
By the way, it is important to clarify one point here.
Using categorical variables with XGBoost or LightGBM does not automatically mean you have a leakage problem.
XGBoost, LightGBM, and CatBoost use different strategies for categorical variables.
| Model | How It Handles Categorical Variables |
|---|---|
| XGBoost | Can use one-hot encoding or native categorical splits, depending on the implementation and settings |
| LightGBM | Learns splits by grouping categories |
| CatBoost | Uses ordered target statistics and ordered boosting |
For example, LightGBM can learn category-based splits such as:
Plan in {Starter, Pro}versus:
Plan in {Business, Enterprise}The resulting rule may look like:
if Plan is Starter or Pro:
    go left
else:
    go right
CatBoost takes a different approach.
Instead of only grouping categories, it can convert a category into a target-based statistic in a leakage-aware way.
For example:
Starter
↓
Average churn rate among previous Starter customers
The important point is that these models have different design goals.
LightGBM emphasizes speed and scalability.
CatBoost emphasizes effective use of categorical variables while reducing leakage and prediction shift.
XGBoost is a strong general-purpose boosting algorithm with broad adoption and flexibility.
What Kind of Data Is CatBoost Good For?
CatBoost is especially useful for business datasets that contain many categorical variables.
Examples include:
Customer Data
- Customer segment
- Region
- Industry
- Subscription plan
- Account type
Marketing Data
- Ad channel
- Campaign ID
- Traffic source
- Landing page
- Creative type
Product Data
- Product category
- Brand
- SKU
- Store
- Supplier
Survey Data
- Demographic attributes
- Response categories
- Segments
- Preference groups
SaaS Data
- Plan type
- Customer segment
- Feature usage category
- Acquisition channel
- Support category
If your dataset has many categorical variables, especially variables with many unique values, CatBoost is often worth trying.
Which Model Should You Use?
So which model should you choose: Random Forest, XGBoost, LightGBM, or CatBoost?
In practice, the best answer is usually:
Try multiple models, evaluate them properly, tune the parameters, and choose the one that performs best on validation or test data.
That said, the following guideline can be helpful as a starting point:
| Situation | Good Starting Point |
|---|---|
| You want something simple and robust | Random Forest |
| You want strong predictive accuracy | XGBoost |
| You have large data and need speed | LightGBM |
| You have many categorical variables | CatBoost |
This does not mean one model is always better than the others. It means each model has a different strength.
Random Forest is stable and easy to use.
XGBoost is powerful and flexible.
LightGBM is fast and scalable.
CatBoost is strong when categorical variables play an important role.
For many business datasets, especially customer, marketing, survey, and SaaS data, CatBoost is a very practical option to consider.
Summary
Random Forest, XGBoost, LightGBM, and CatBoost are all tree-based ensemble models, but they have different design philosophies.
- Random Forest focuses on stability.
- XGBoost focuses on predictive accuracy.
- LightGBM focuses on speed and scalability.
- CatBoost focuses on categorical variables.
CatBoost’s biggest advantage is that it can use information from categorical variables while reducing the leakage risk that often comes with naive target encoding.
This makes it especially useful for business data, where categorical variables are often central to the problem.
If you have mainly used XGBoost or LightGBM so far, CatBoost is worth trying, especially when your data contains many categorical variables.
You may find that it performs surprisingly well with less preprocessing than you expected.
Try CatBoost in Exploratory
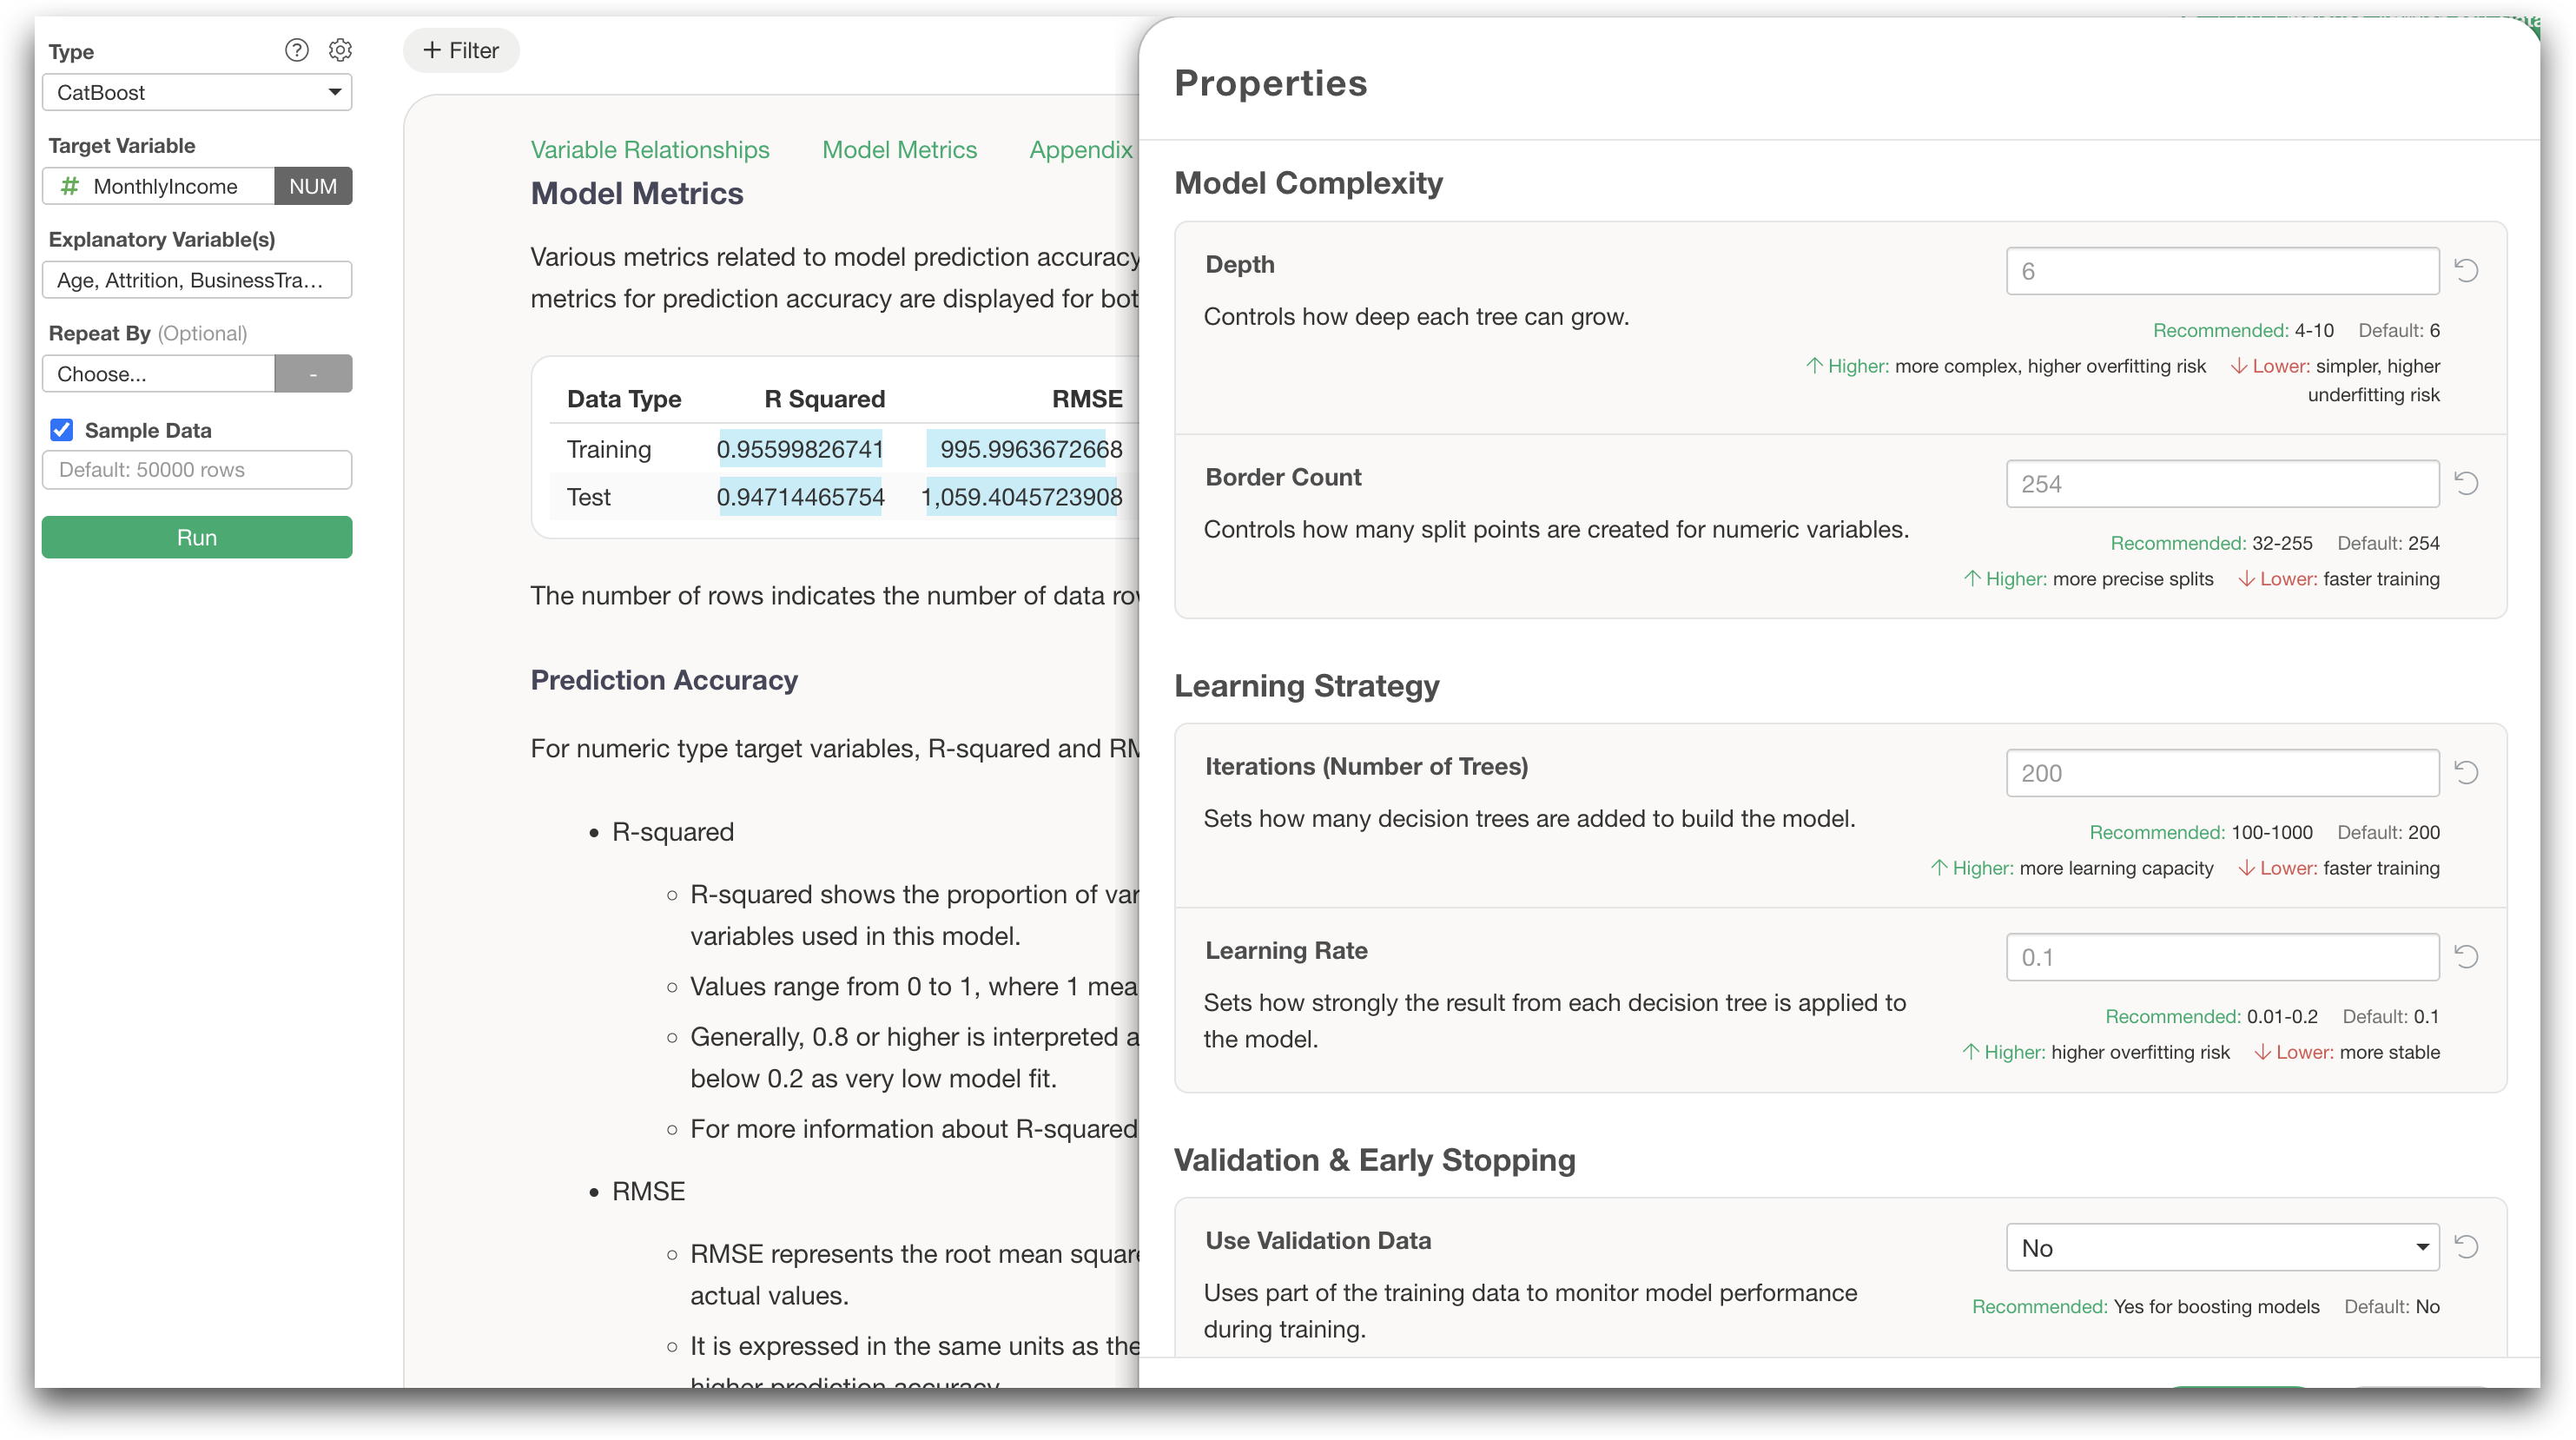
Exploratory supports CatBoost starting with version 15.5.

You can build CatBoost models directly from the Analytics view using the UI.
The basic steps are:
- Open the Analytics view.
- Select CatBoost.
- Choose the target variable.
- Choose the explanatory variables.
- Click Run.
You can also tune model parameters from the Settings dialog to improve predictive accuracy while controlling overfitting.

If you work with data that contains many categorical variables, CatBoost is definitely worth trying.
You can download the latest version of Exploratory here:
👉 Download Exploratory
https://exploratory.io/download
If you do not have an account yet, you can sign up and start a 30-day free trial here:
If your trial has already expired, you can launch the latest version and click “Extend Trial” to try it again.