Analyze Survey Data More Efficiently and More Deeply
I’m super excited to announce Exploratory v16! 🎉
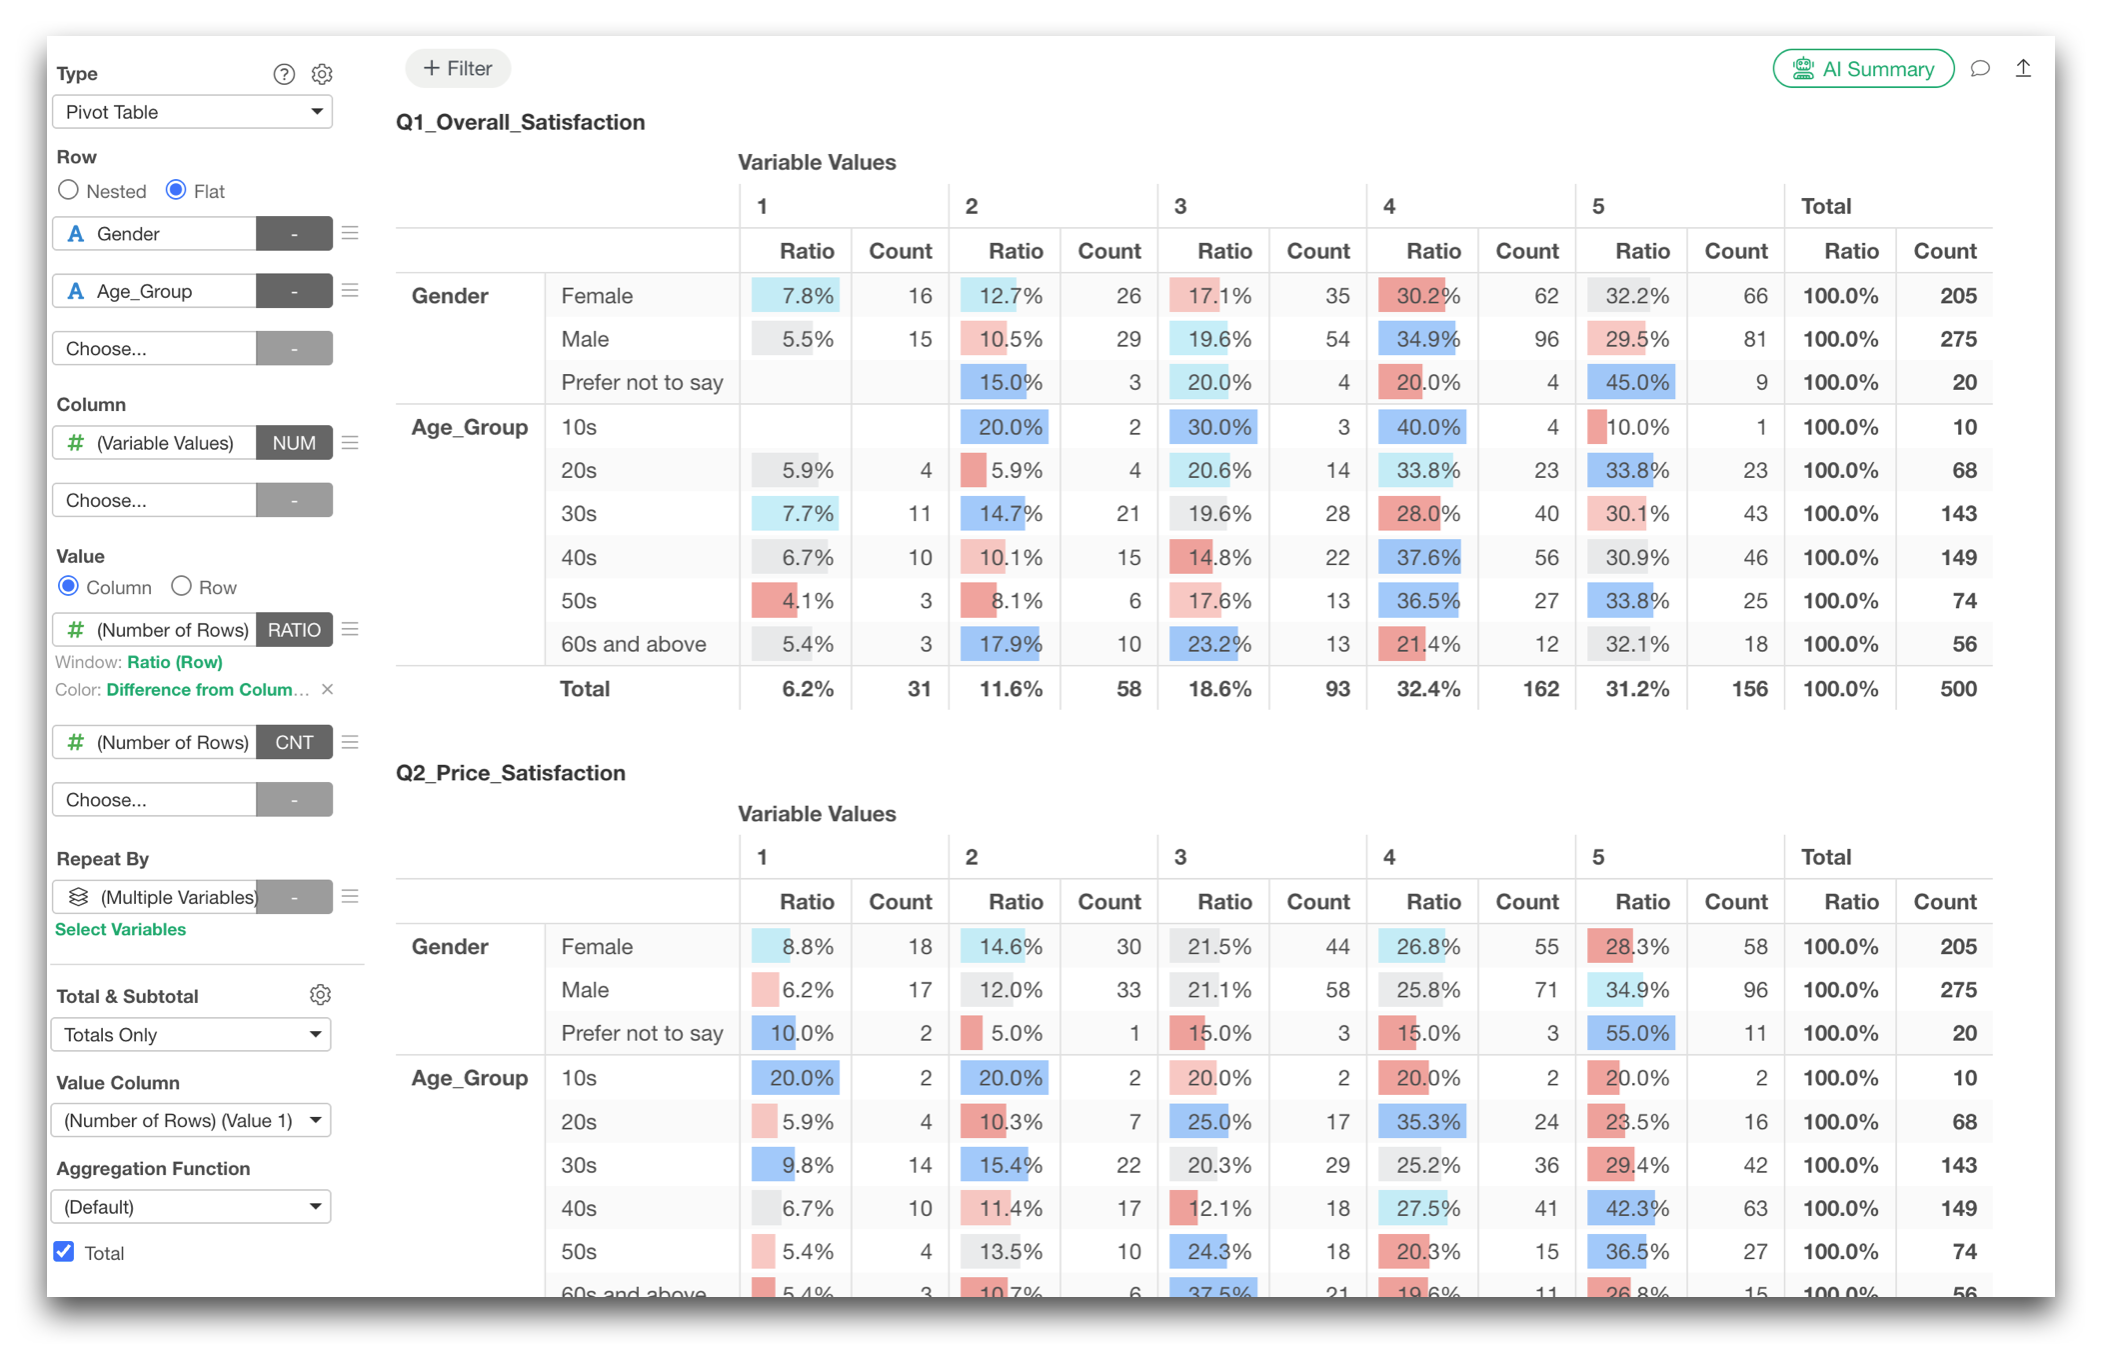
The reason I’m so excited is because it is a major step forward in one of the areas where we have received the most requests from our users, that is Survey Data Analysis!
Survey data is everywhere, from customer satisfaction and employee engagement surveys to market research and institutional research in higher education. It helps us understand what customers, employees, students, and other groups think, value, and struggle with.
But actually analyzing survey data is often much harder than it looks.
Before you can even start exploring the data, you may need to combine multiple files, clean up question names and response labels, process multiple-response questions, define the correct order of categories, create cross-tabulations, build charts, perform statistical analyses, and eventually turn everything into a report.
With Exploratory v16, we took a fresh look at this entire workflow around one goal:
Analyze survey data more efficiently & more deeply.
There are many improvements in this release, but I’d like to focus on three major areas.
- Use AI to get and prepare the data
- Prepare and summarize survey data with much less work
- Go beyond cross-tabs with deeper survey analytics
Let’s take a look.
1. Use AI to Get and Prepare the Data
One of the most time-consuming parts of survey analysis often happens before the analysis even begins.
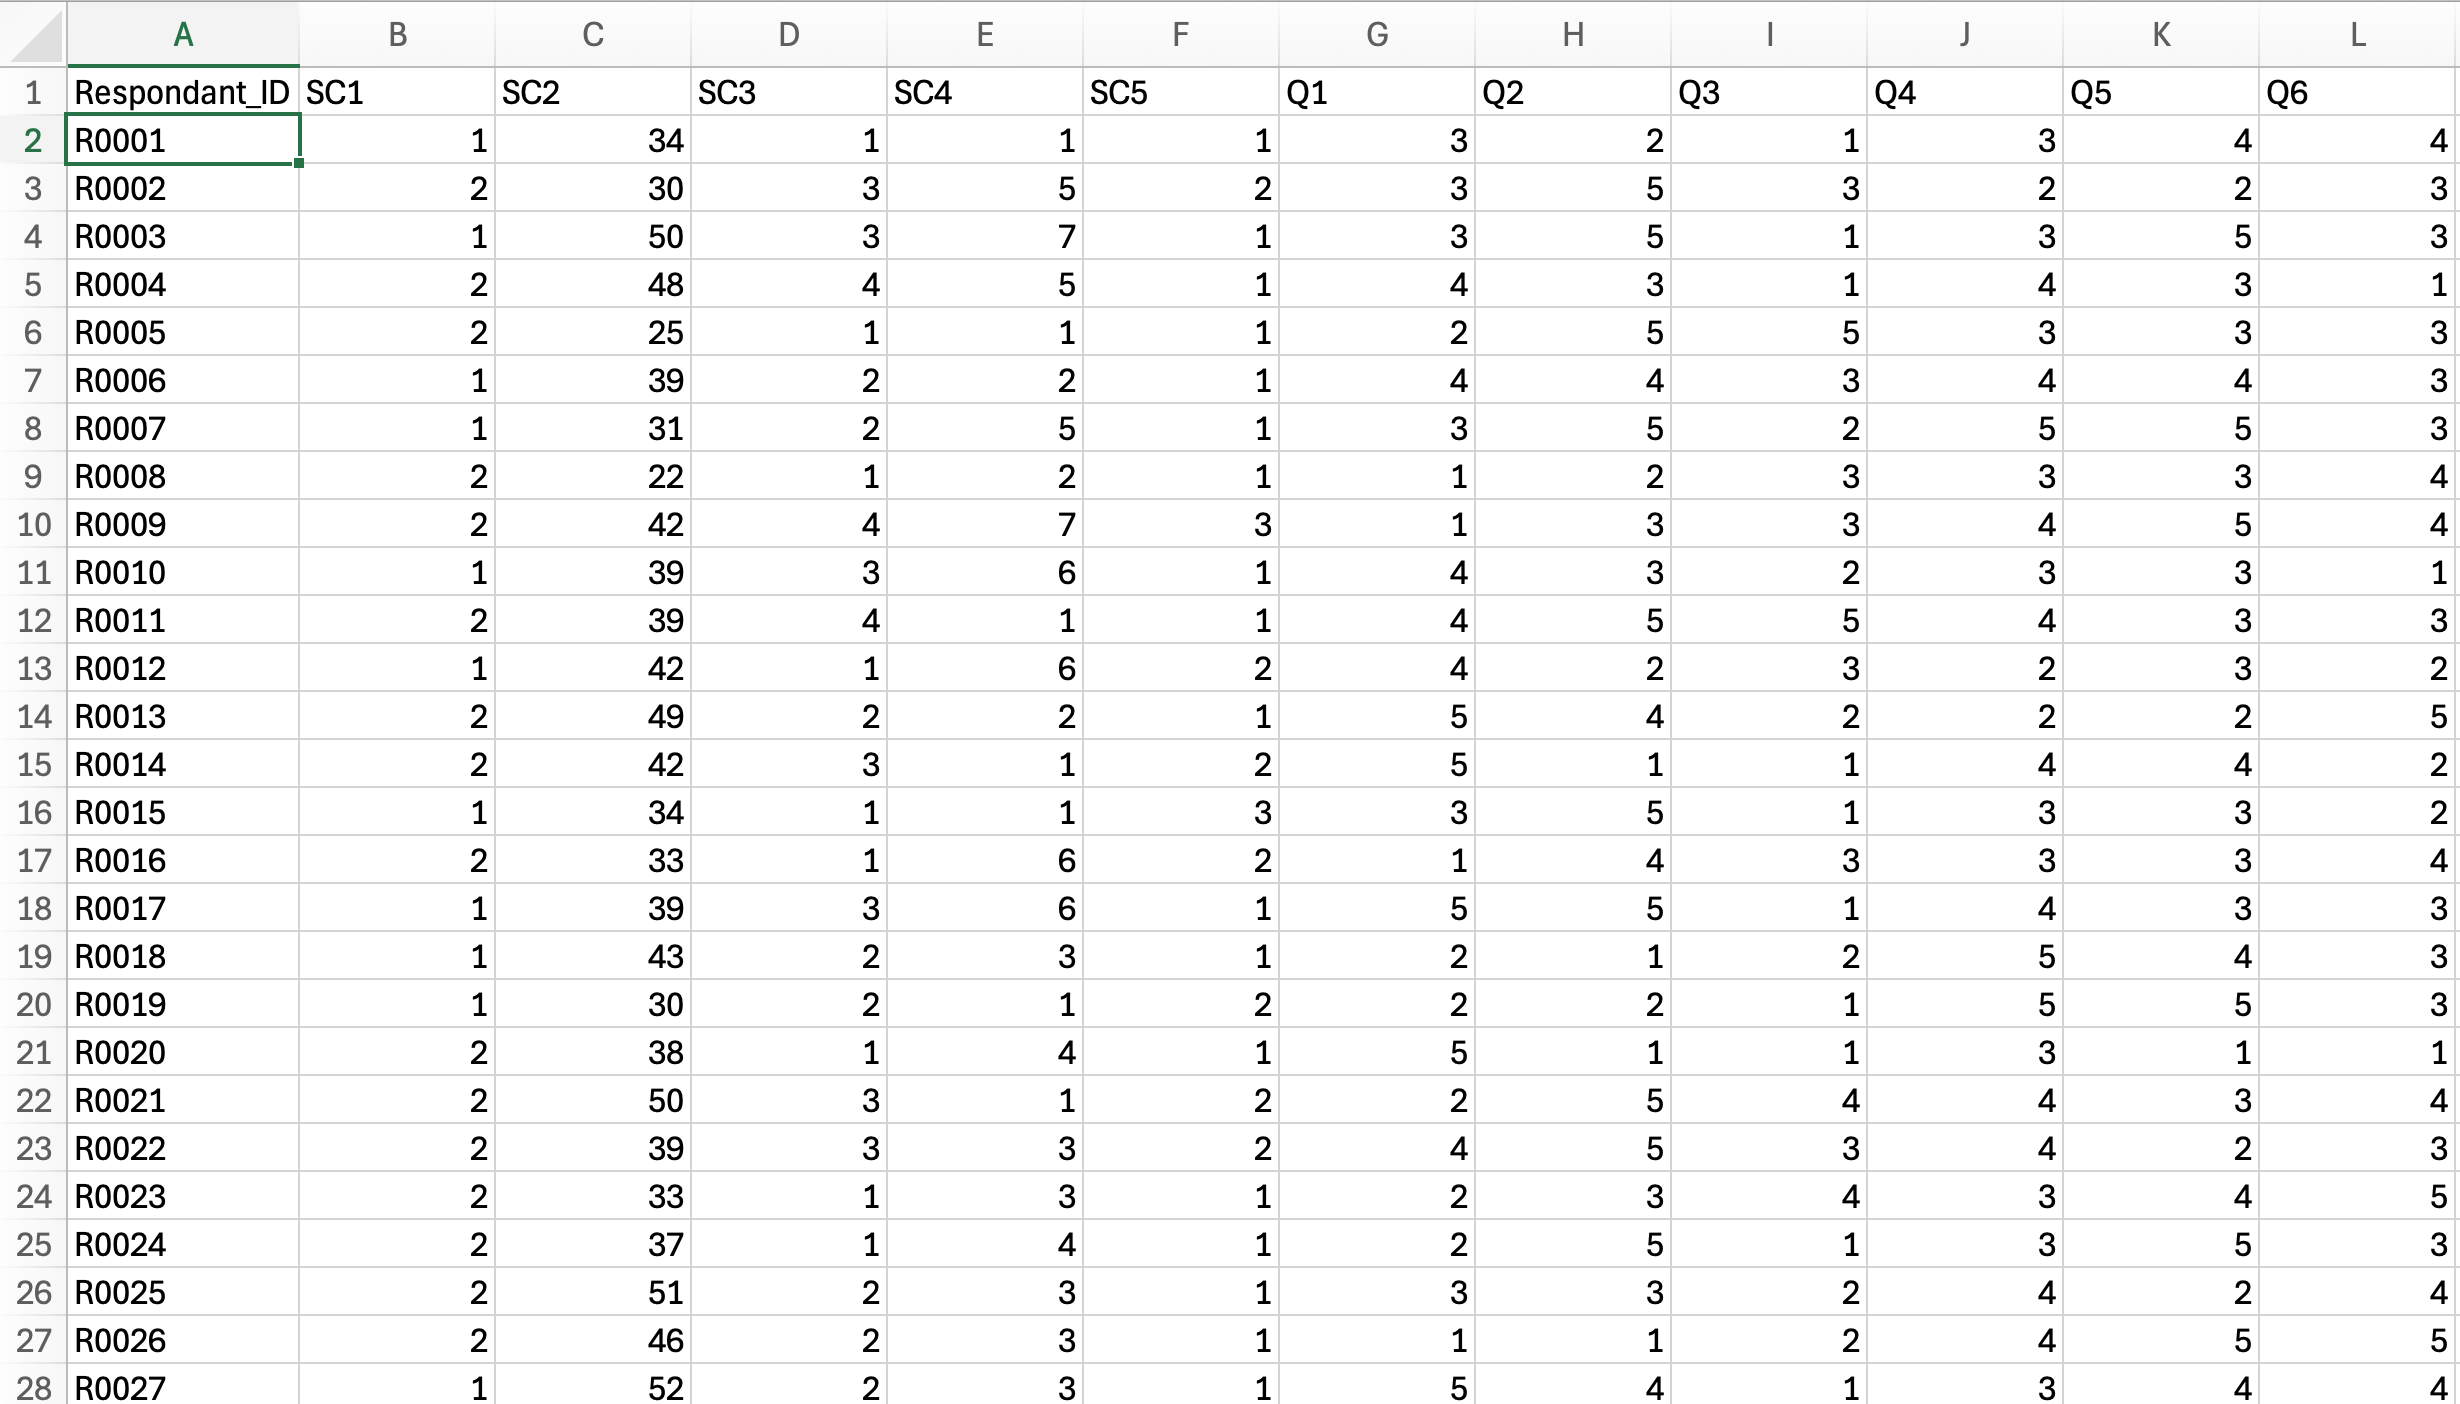
A typical survey project may give you one file containing responses with columns named Q1, Q2, Q3, and so on.
And you have another file containing the actual question text and the labels corresponding to response codes such as 1, 2, and 3, in order to decrypt the cryptic codes in the main data.
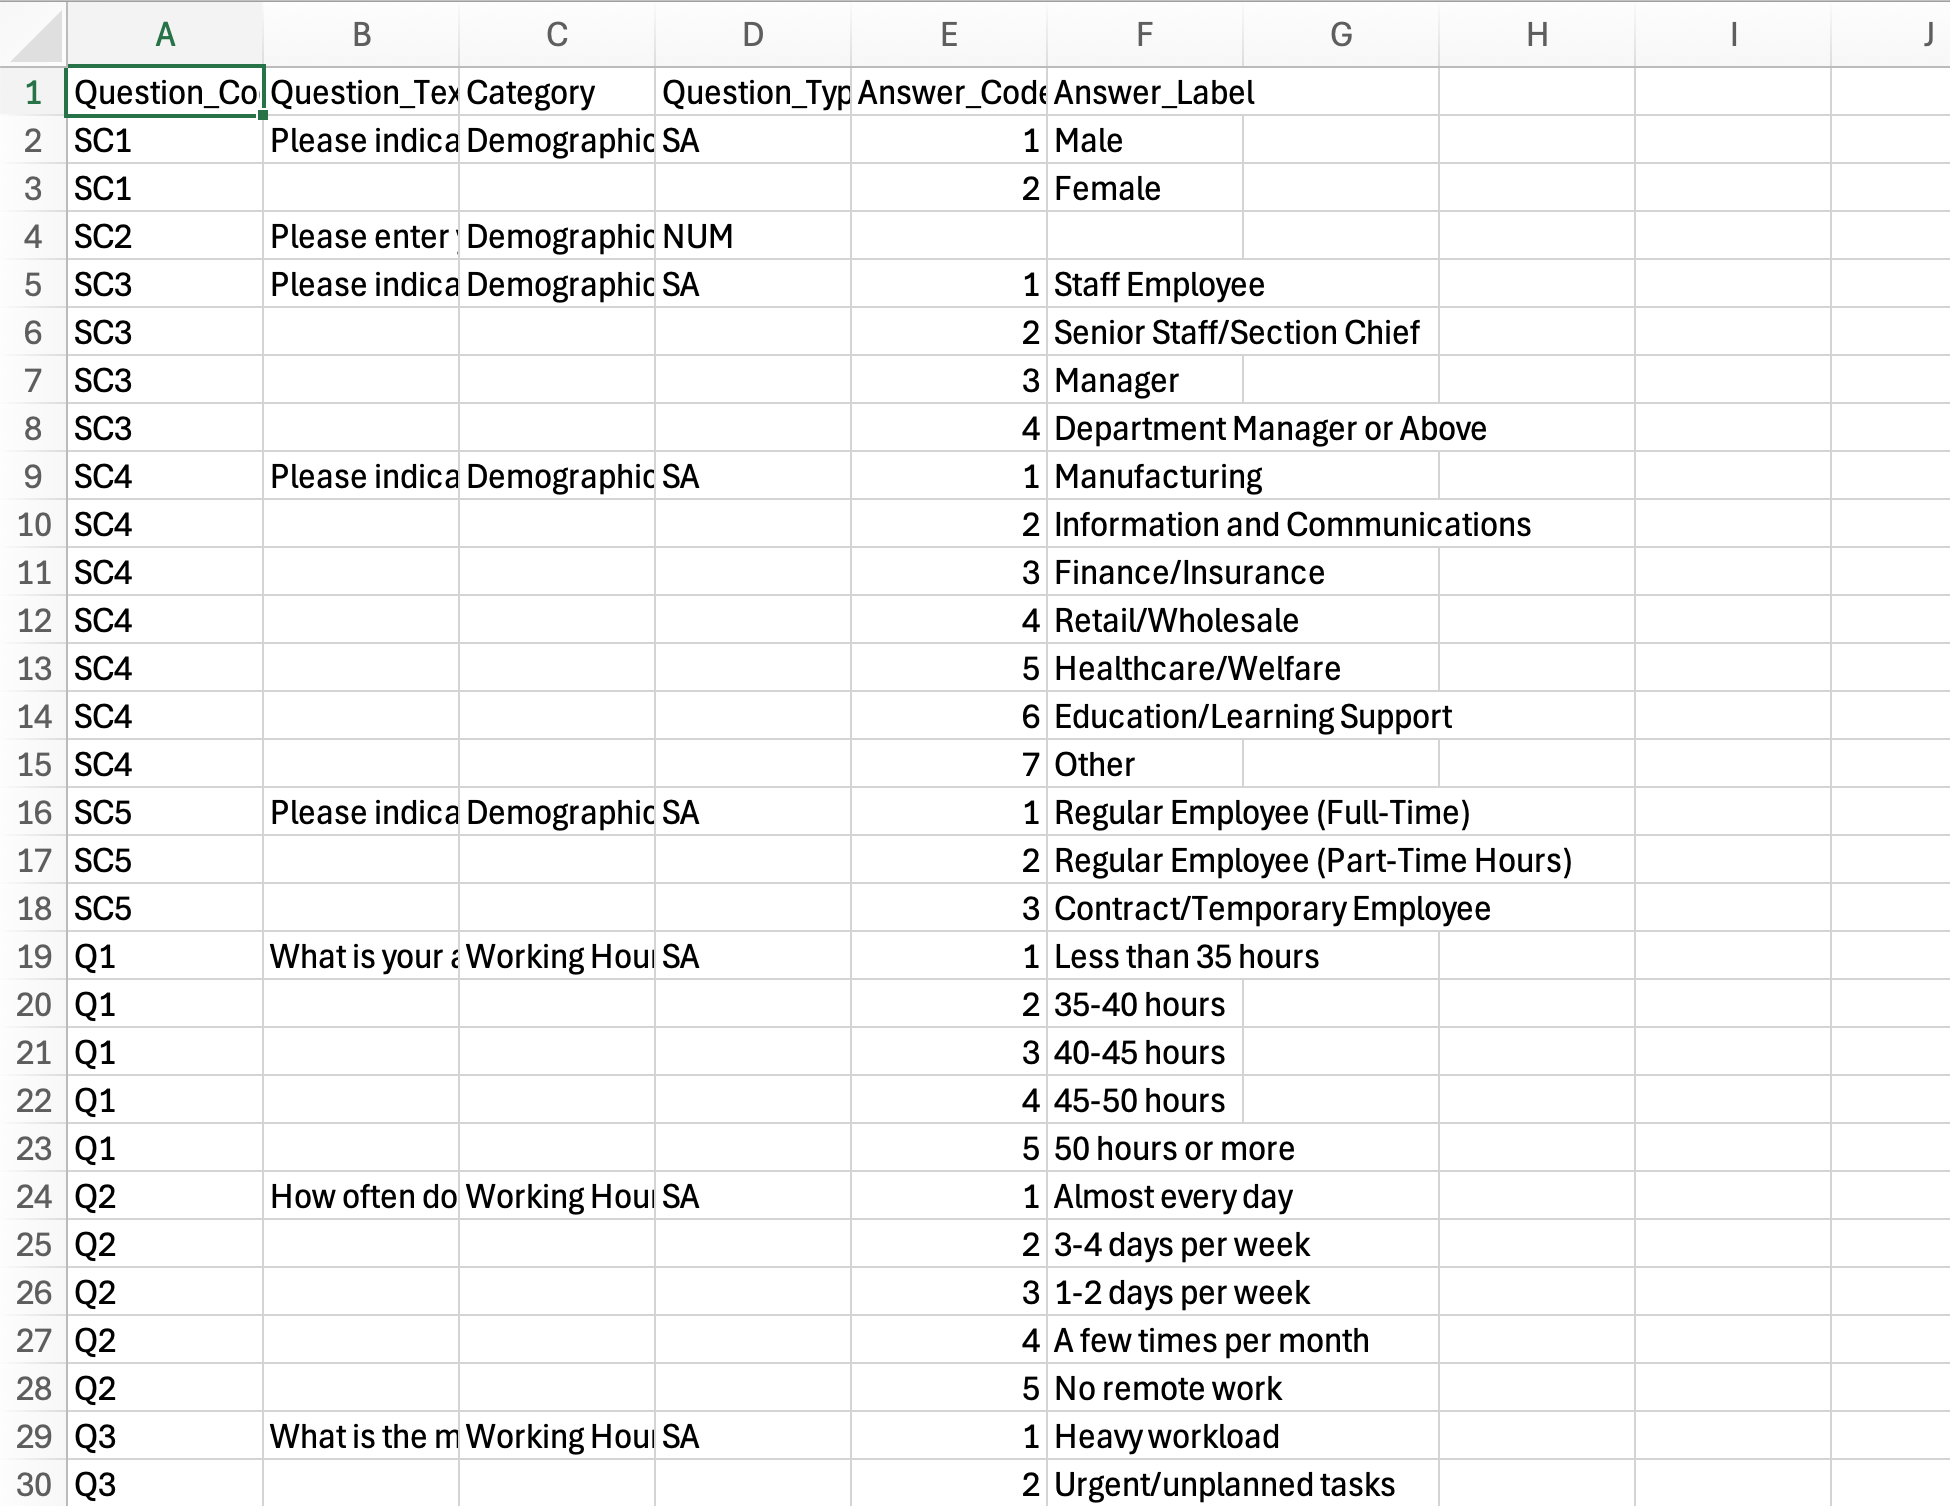
You need to figure out how those files relate to each other, join them correctly, replace IDs and codes with meaningful labels, clean up the column names and data types, and prepare the final dataset, phew!!
And survey data is only one example.
Sometimes the data you need is in multiple Excel files. Sometimes it is inside a PDF. Sometimes it needs to come from a database, an API, a website, or an open-data portal.
This is exactly the kind of work we wanted to make dramatically easier in v16.
Introducing AI Data
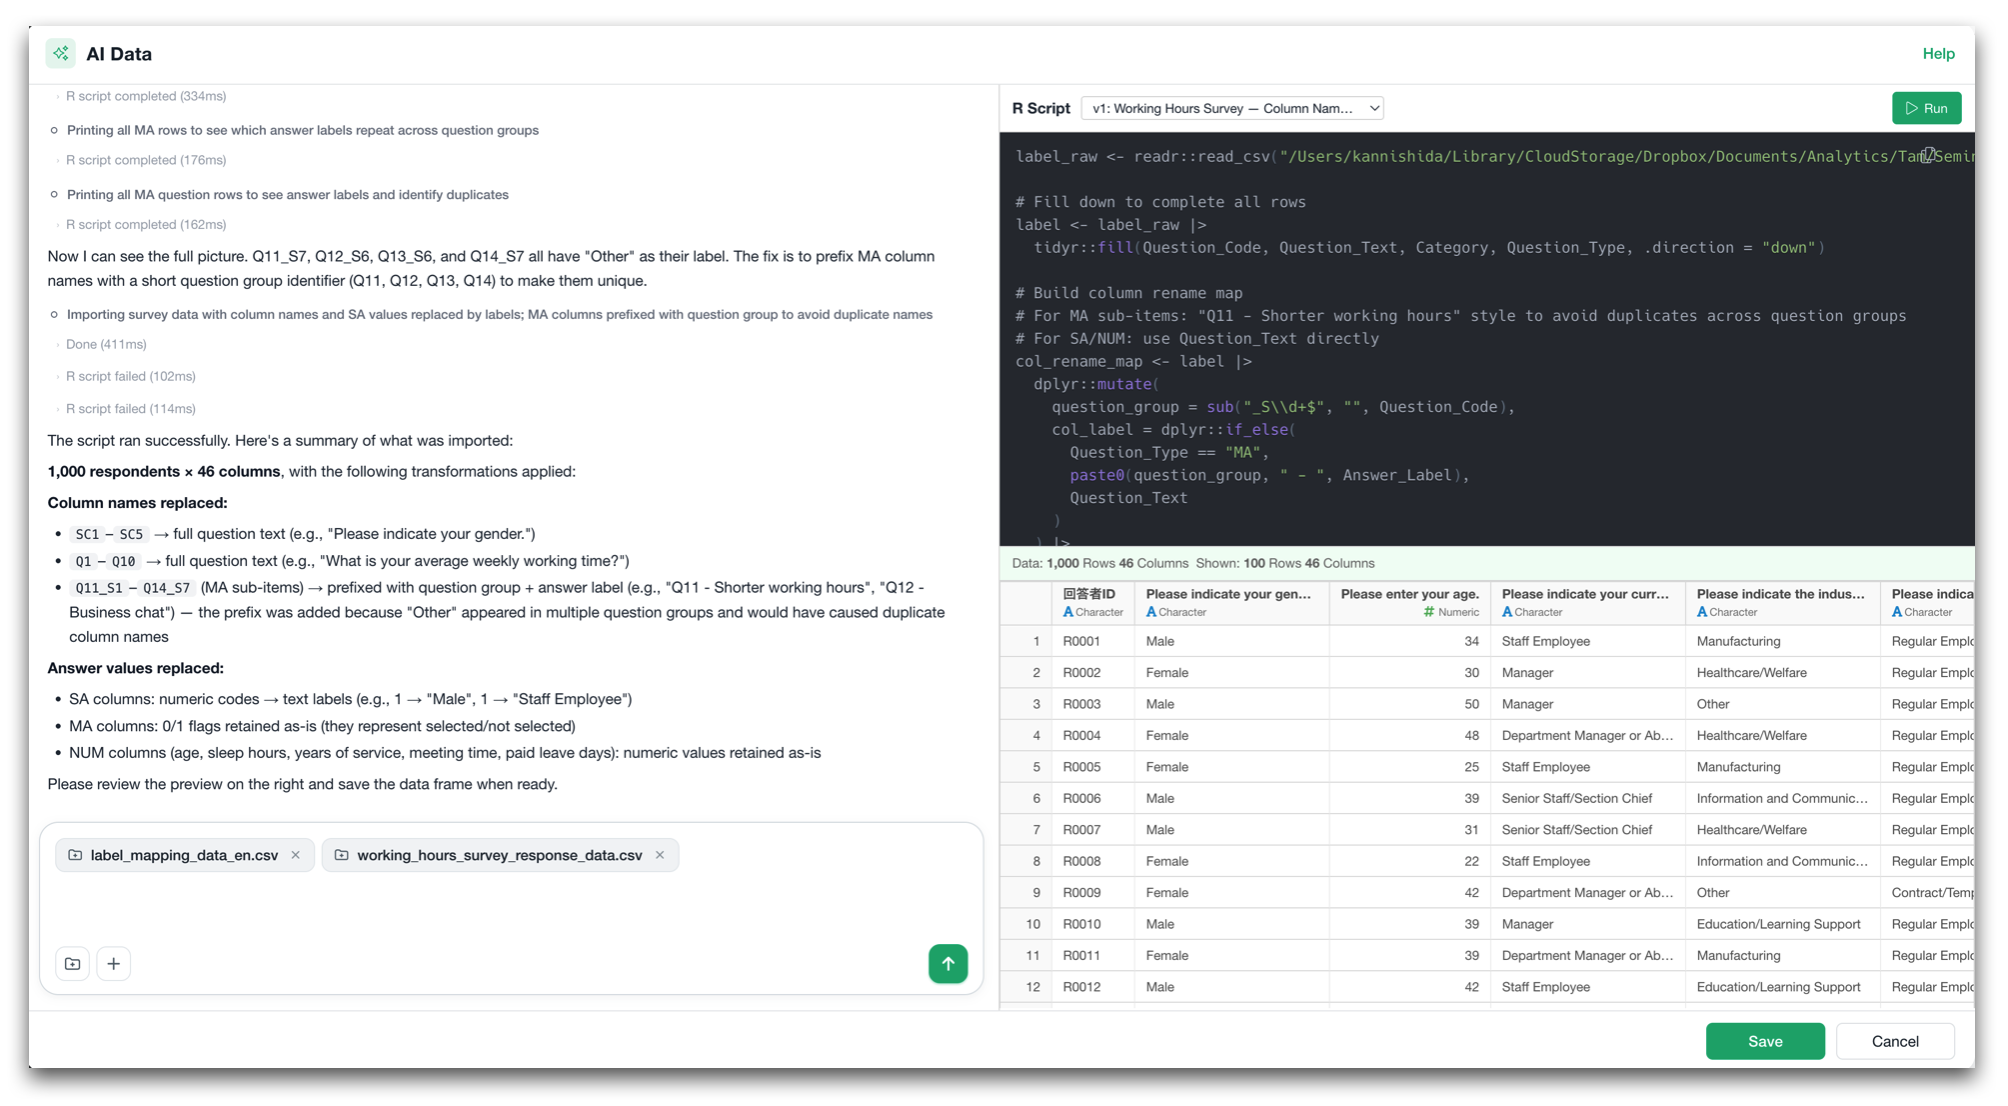
With the new AI Data feature, you can simply describe the data you want in natural language.
For example, you can drag and drop your survey response file together with the files containing question names and response labels, and select “Check the file content and suggest how to import’.
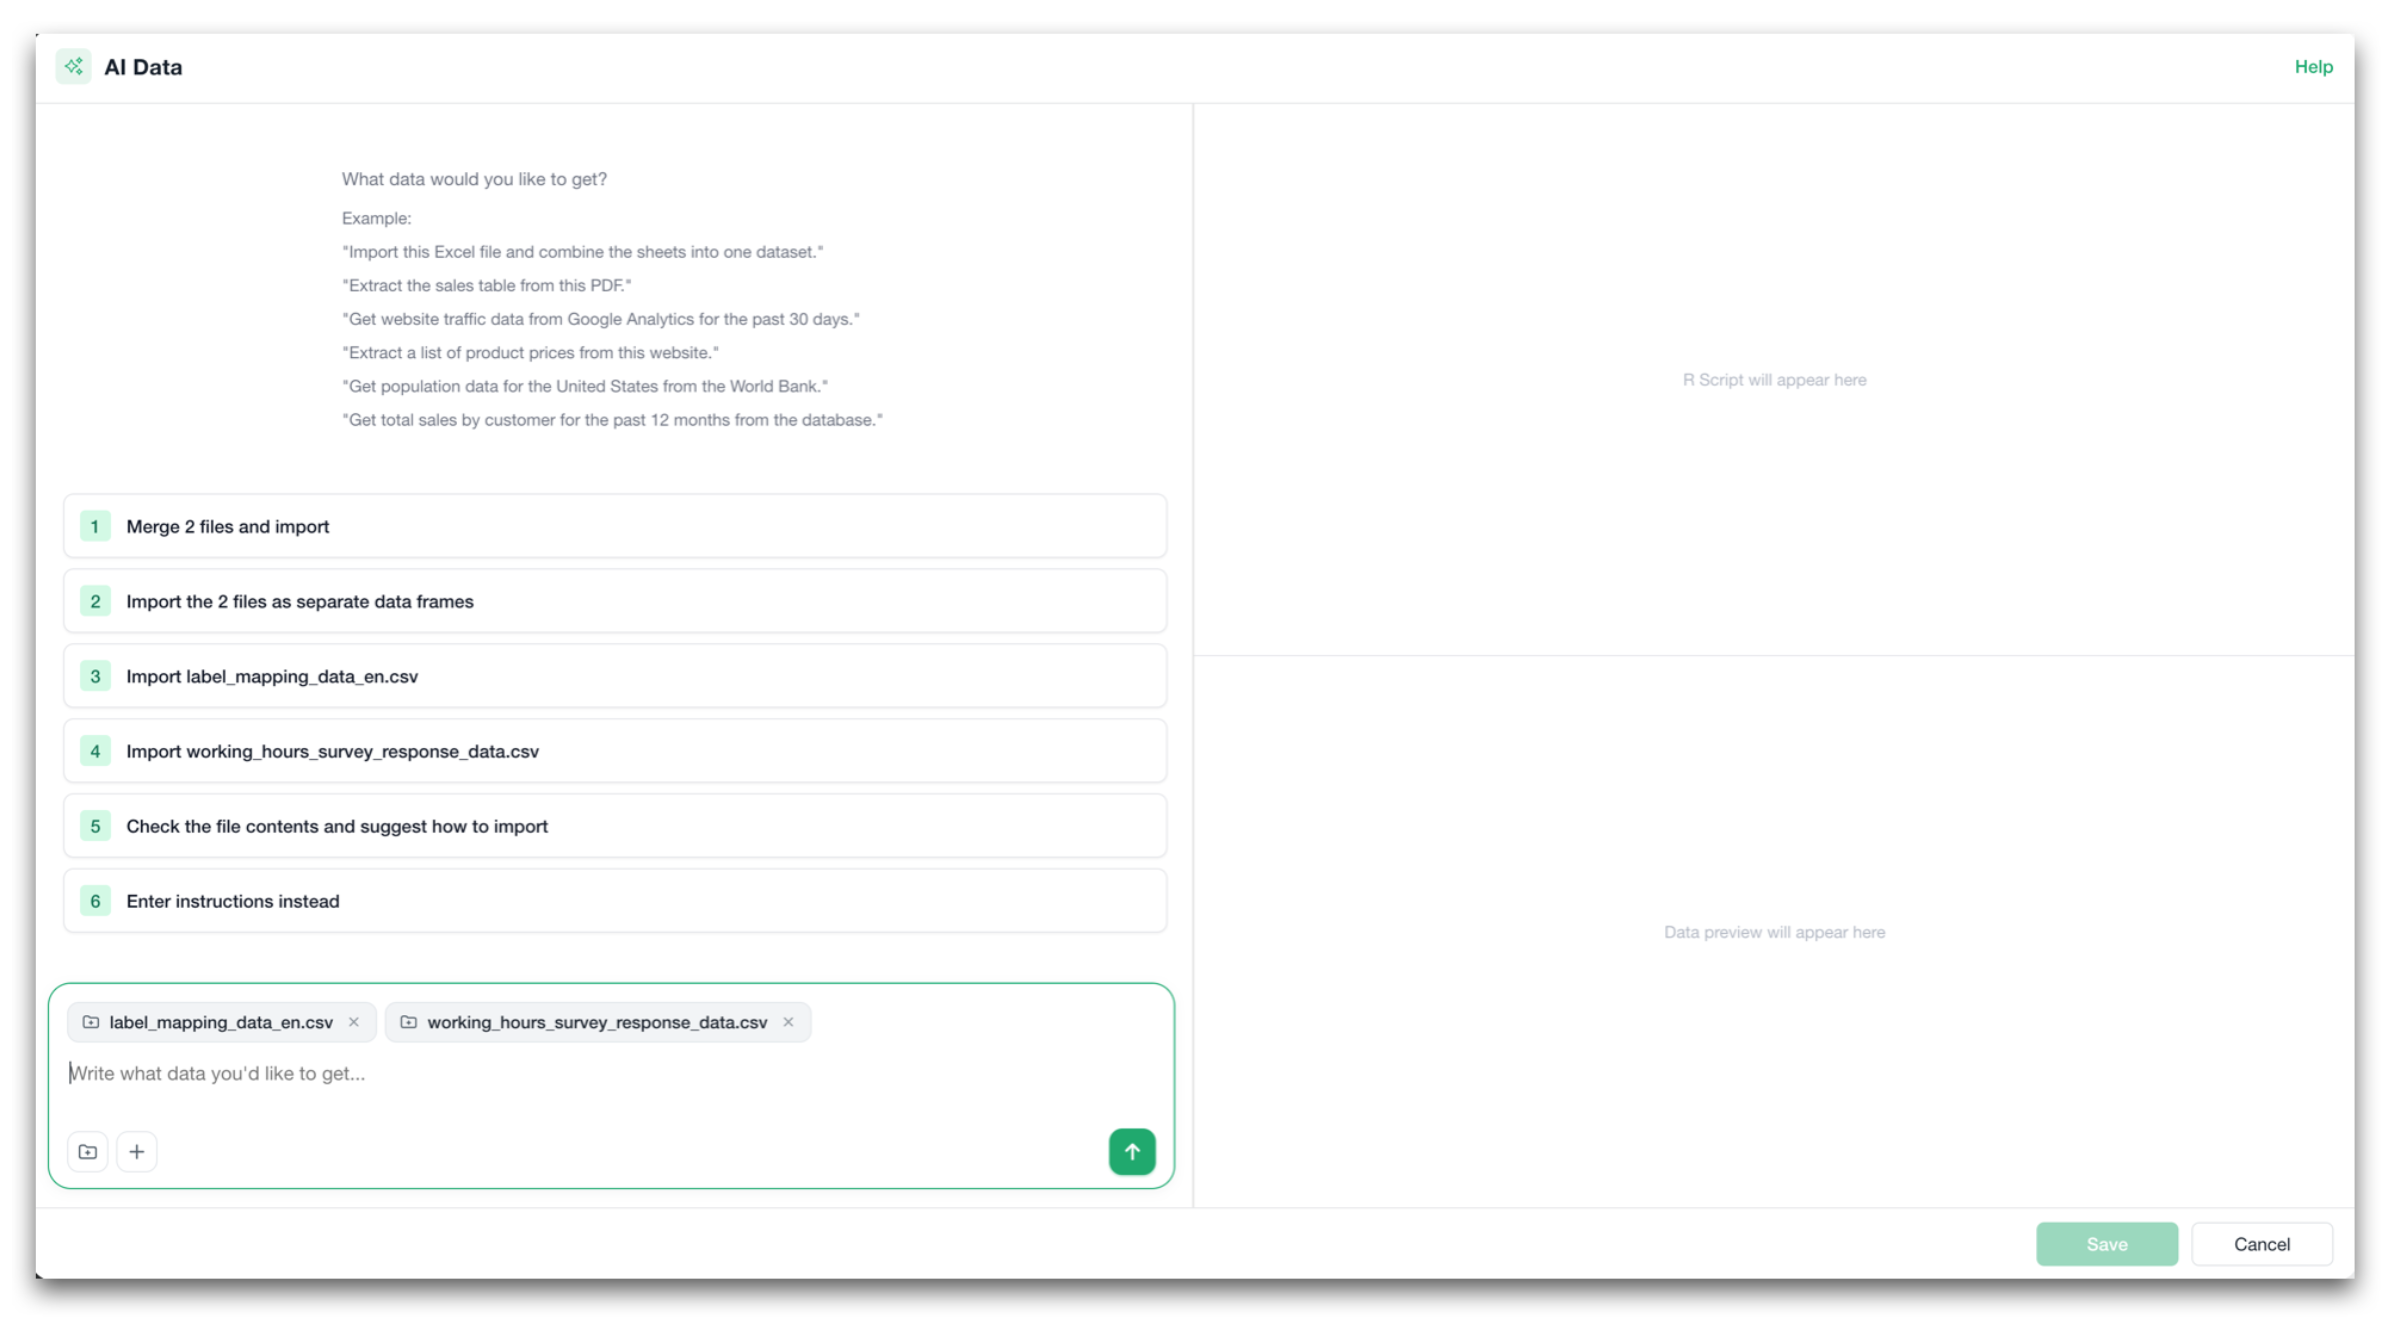
Exploratory then uses AI to analyze the files and suggest a few options.
Once you tell it that you want to replace the column names and values with the mapping names from another file, it will figure out how to do it, generates the necessary R script, runs it, examines the result, and prepares the data that is ready for analysis!
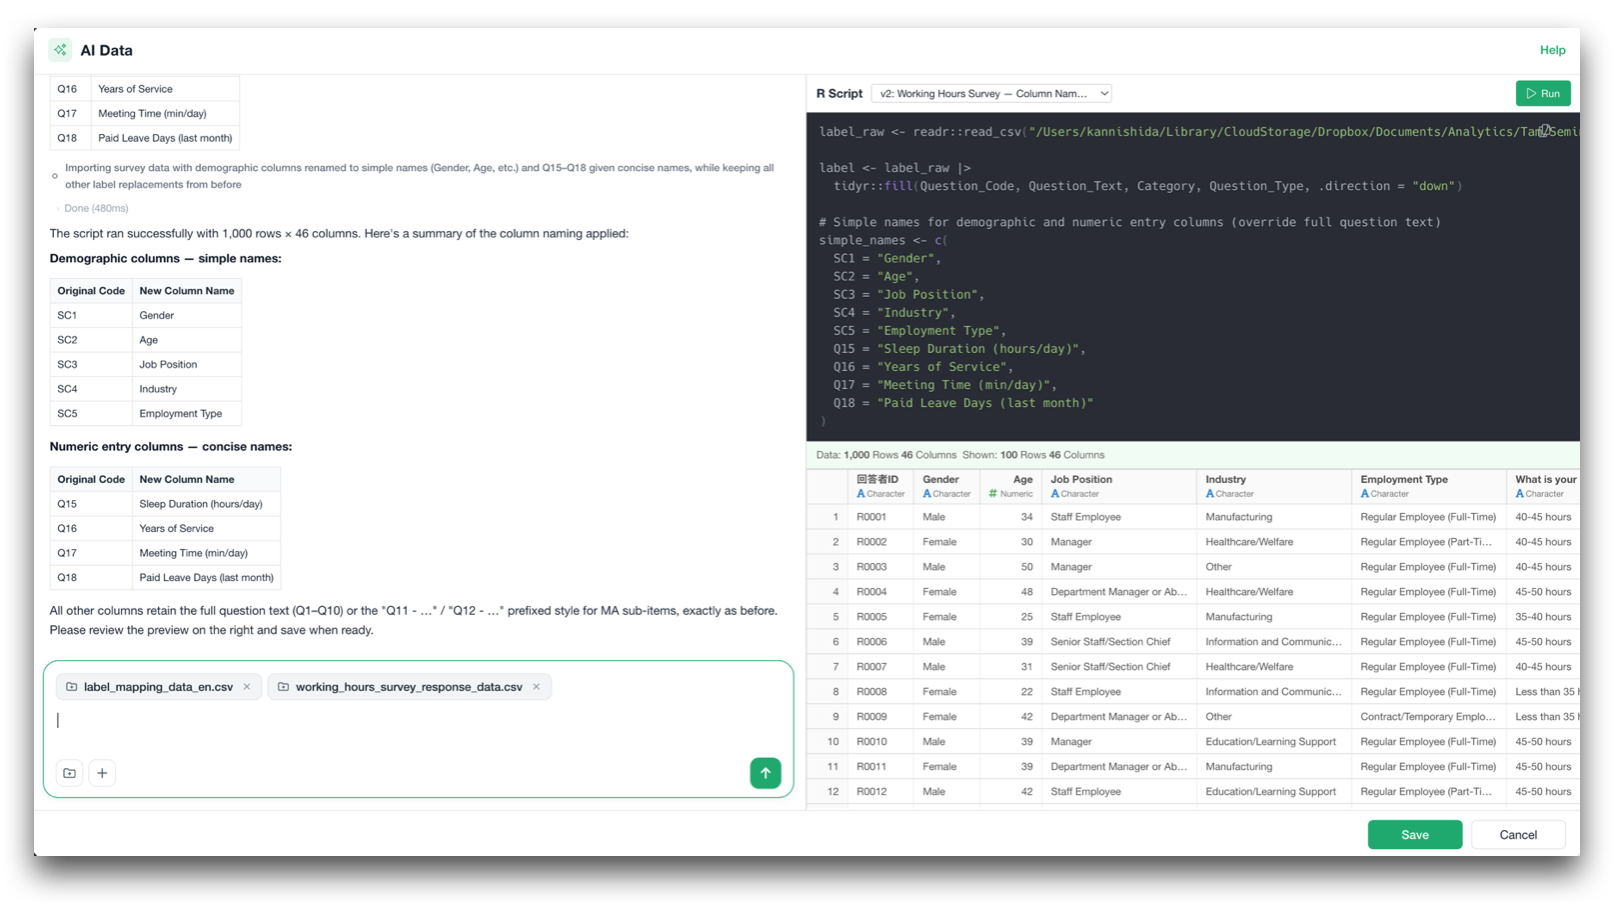
It can handle tasks such as:
- Reading multiple files
- Joining them together
- Replacing question IDs with actual question text
- Converting response codes into meaningful labels
- Cleaning up column names and data types
- Reshaping and transforming the data
And it is not limited to Excel or CSV files on your local PC.
Because Exploratory runs on R and AI Data generates R script, as long as the data can be accessed by R, you can get and prepare any data with AI Data.
You can ask it to do things like:
- “Import this Excel file and combine the sheets into one dataset.”
- “Extract the sales table from this PDF.”
- “Get website traffic data from Google Analytics for the past 30 days.”
- “Extract a list of product prices from this website.”
- “Get total sales by customer for the past 12 months from the database.”
- “Use an API to get the latest exchange rates.”
The potential of what data you can bring in is limitless!
As long as you can describe what data you want it will get it for you!
Reproducibility that it counts!
But here is the most important part.
AI should make data preparation easier, but we didn’t want it to turn the process into a black box.
The data retrieval and transformation process created by AI Data is ultimately saved as an R script.
Once the script is generated the way you like, you can rerun the same script whenever new data arrives. You do not need to use AI to recreate the process every time.
Yes, AI helps you build the workflow, and R makes the workflow reproducible.
We think this combination can fundamentally change how analysts work with data - not only for survey analysis, but for many other types of projects as well.
2. Prepare and Summarize Survey Data with Much Less Work
Even after you have the data, survey analysis comes with its own set of challenges.
Survey datasets often contain ordered categories, multiple-response questions, dozens or hundreds of question columns, and long question labels.
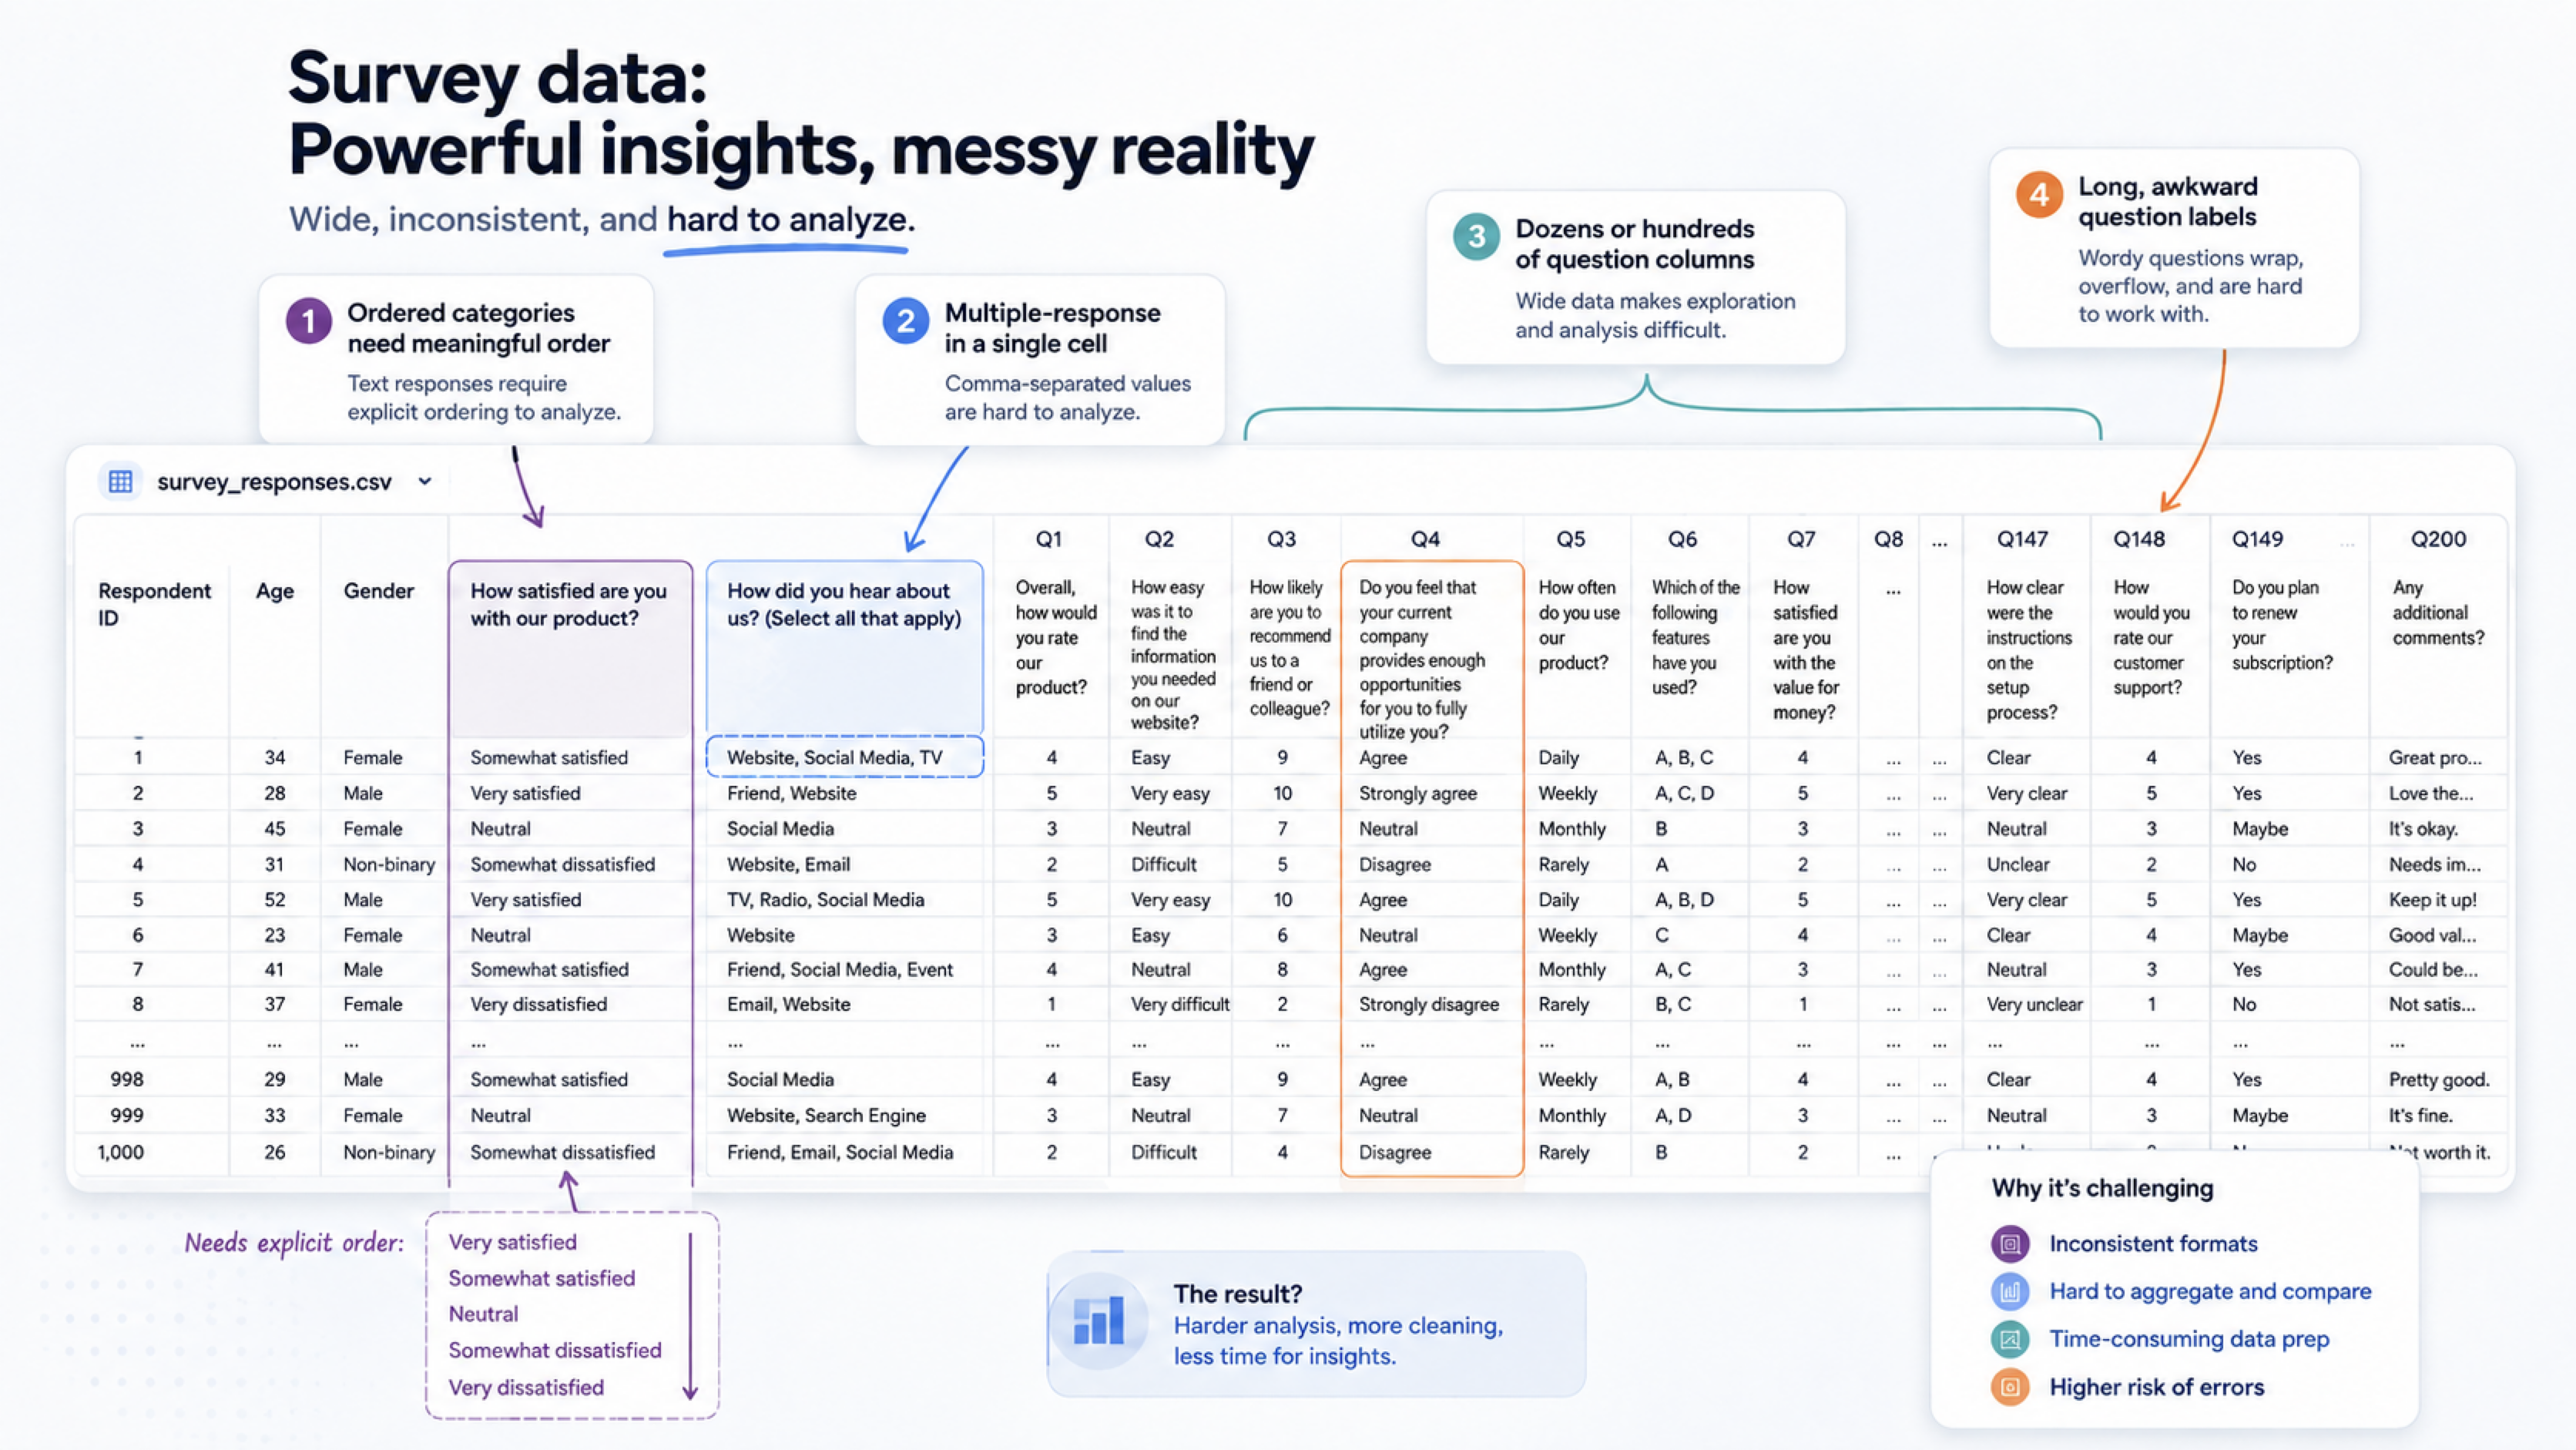
Historically, many of these required extra data wrangling before you could start summarizing or visualizing the results.
In v16, we wanted to reduce that work as much as possible.
Multiple-response questions
One of the challenges of dealing with survey data is multiple-response questions.
For example, a question like the below will have multiple answers.
Which of the following sources do you use to get the latest news? Select all that apply.
And those answers are stored in a single cell like below.
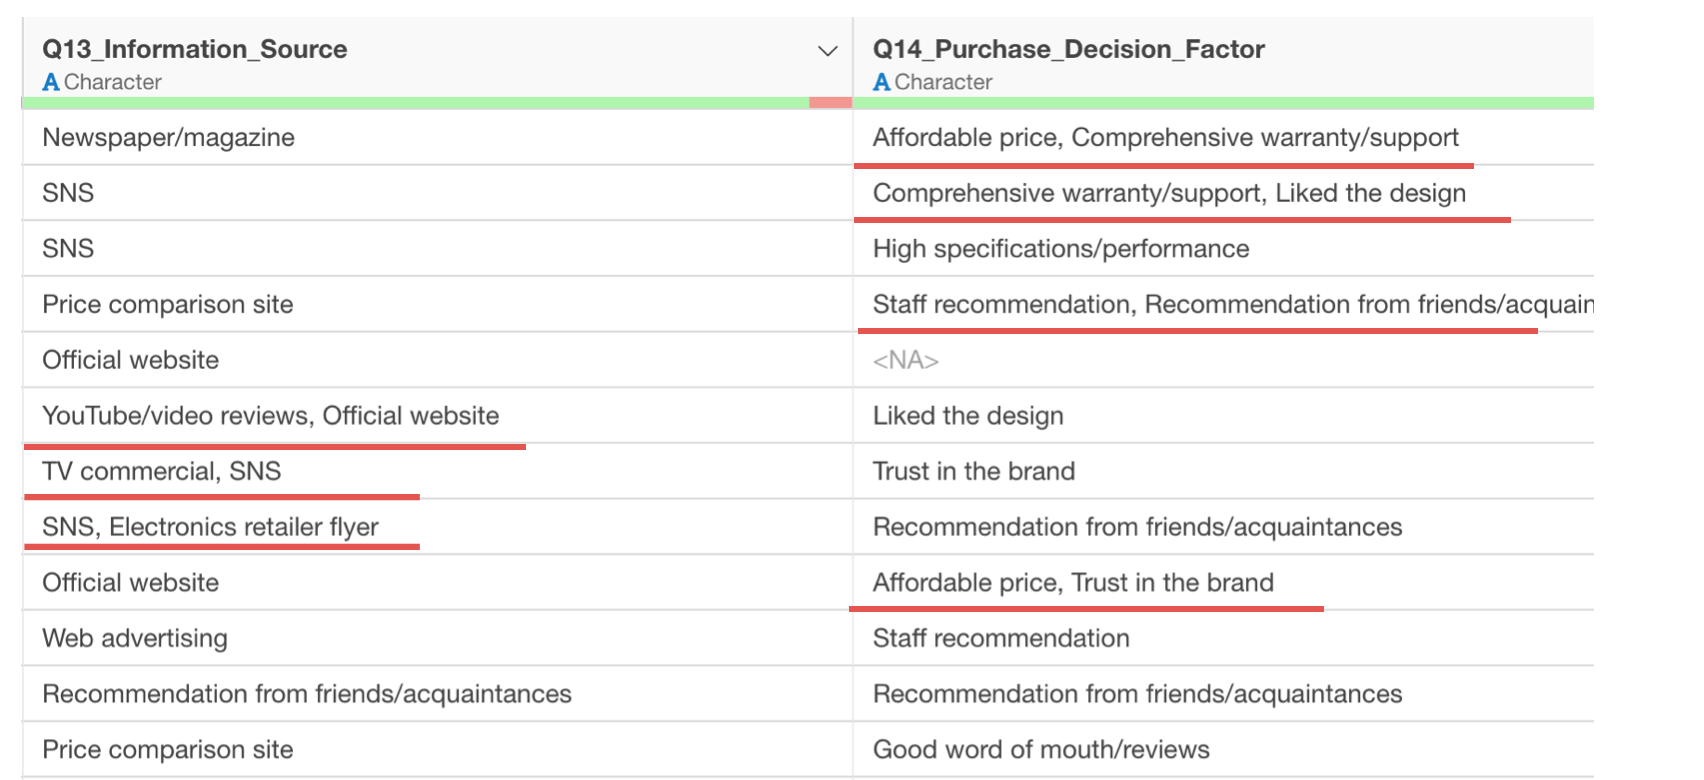
If you assign such columns to Pivot Table or Chart you will get something like this.
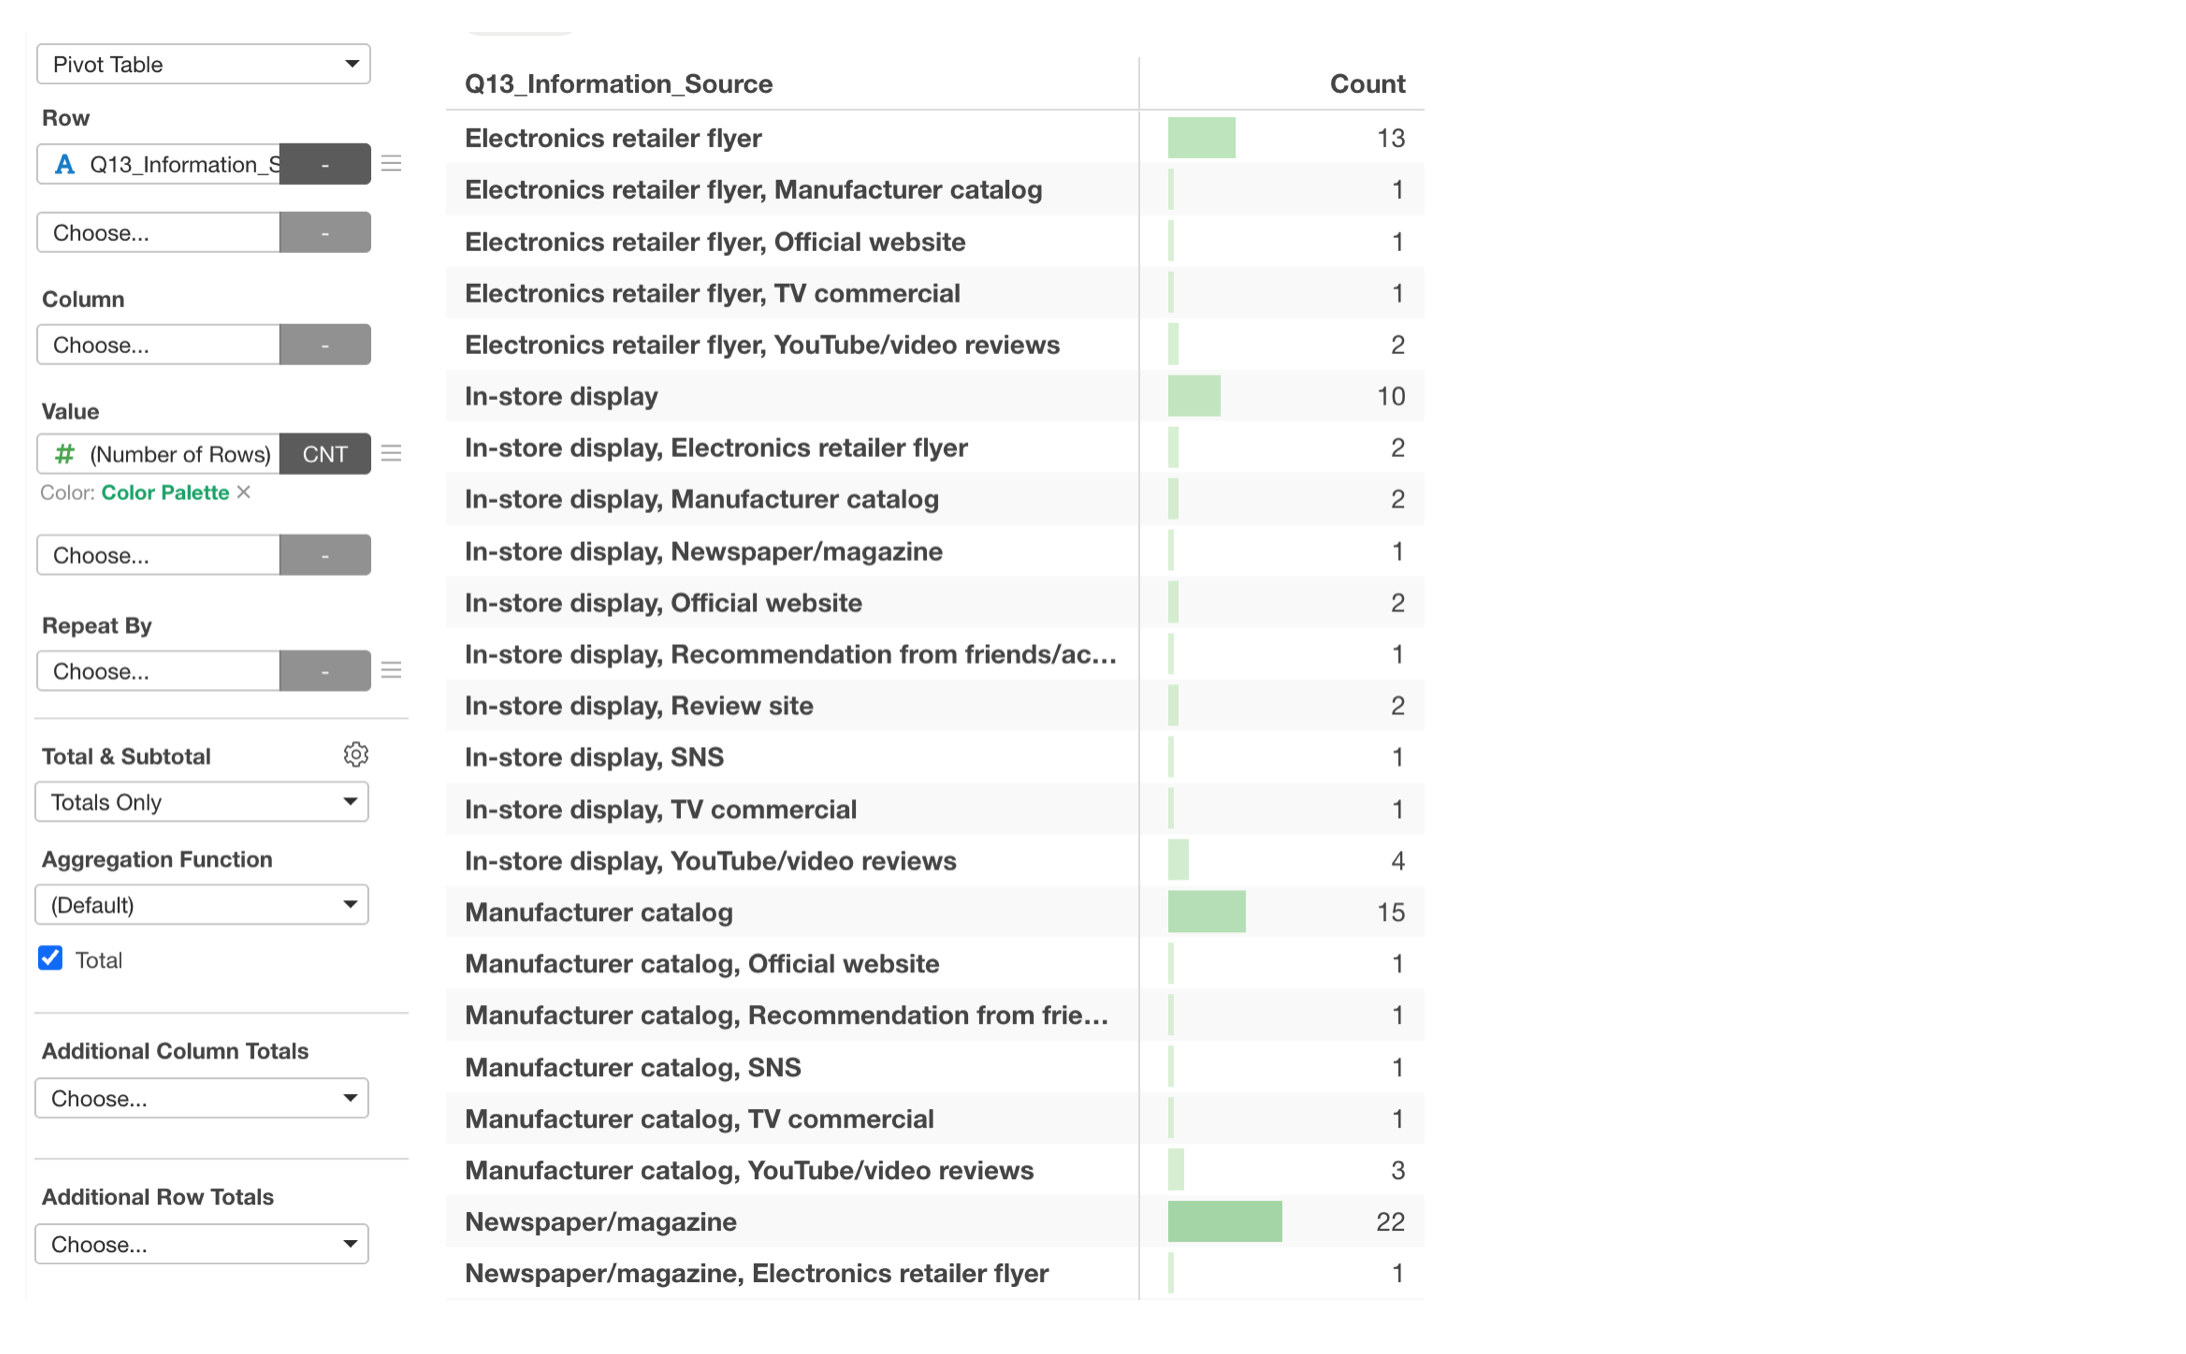
Each combination of the answers will be treated as an unique value as whole, and that’s not what we are interested in. We want to know which of the choice items are more than the others, not the combinations of the choices.
Before v16, you needed to split those responses into multiple rows before you could summarize them.
With v16, you can use this type of column directly in Pivot Tables and Charts.
You can simply assign such columns to ‘Row’ or ‘X-Axis’, for example, and select ‘Multiple Values’ from the menu.
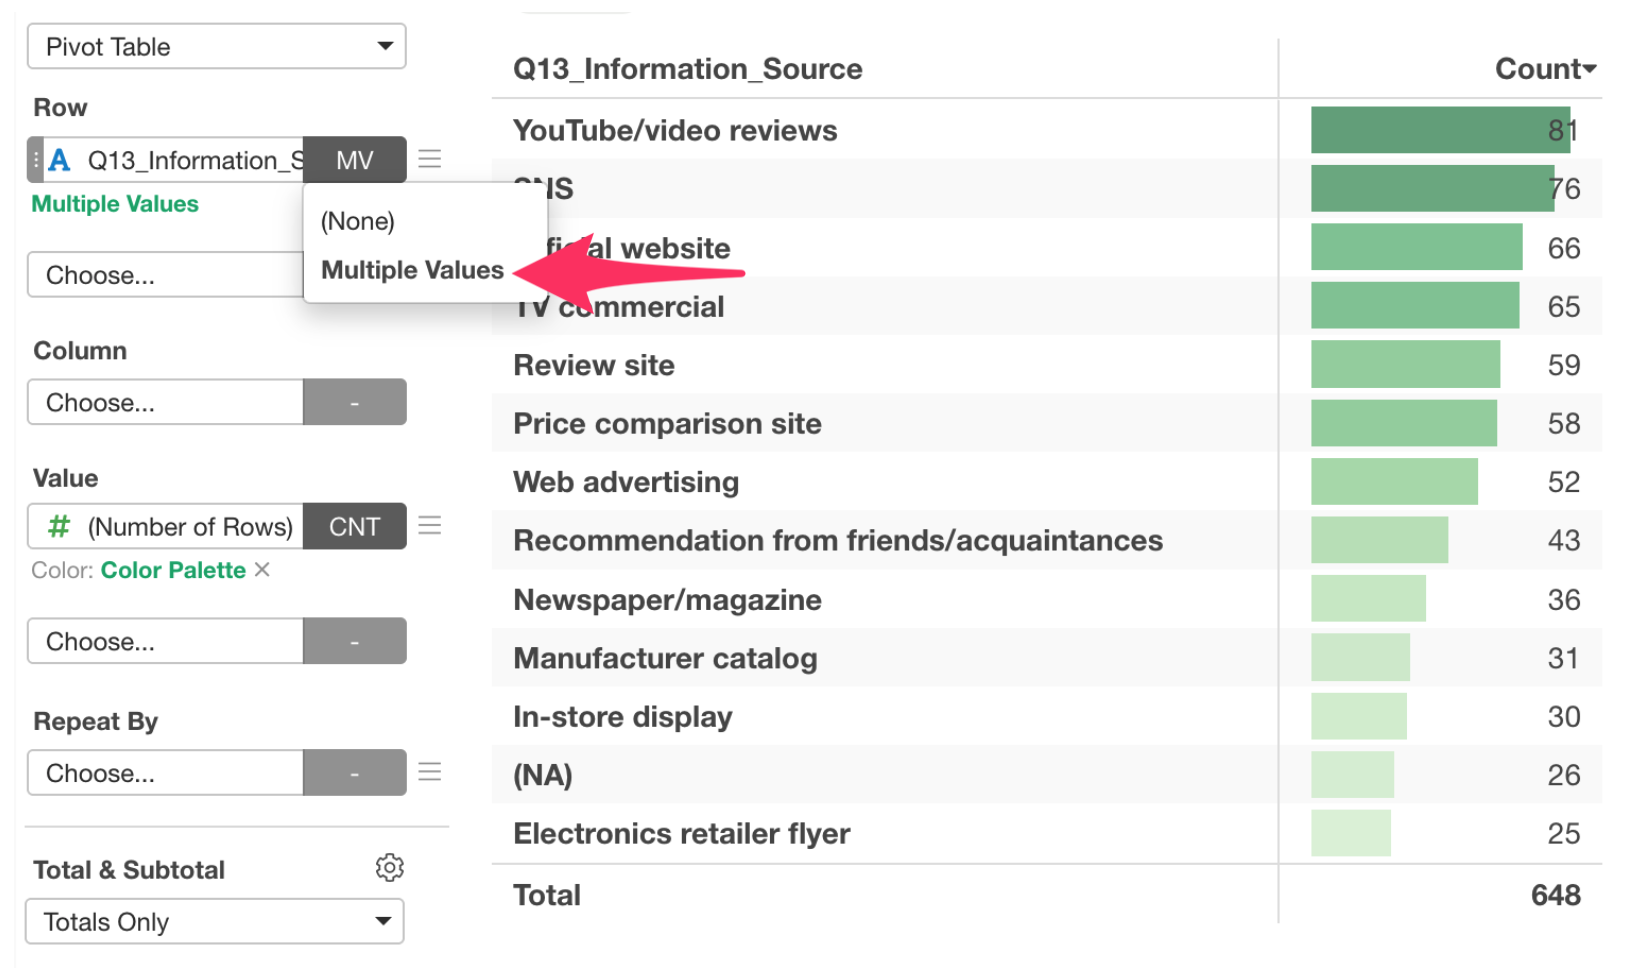
Exploratory can internally convert the data by separating the values internally and show them as separate values. Yes, you can quickly create summaries and visualizations without restructuring the original data first.
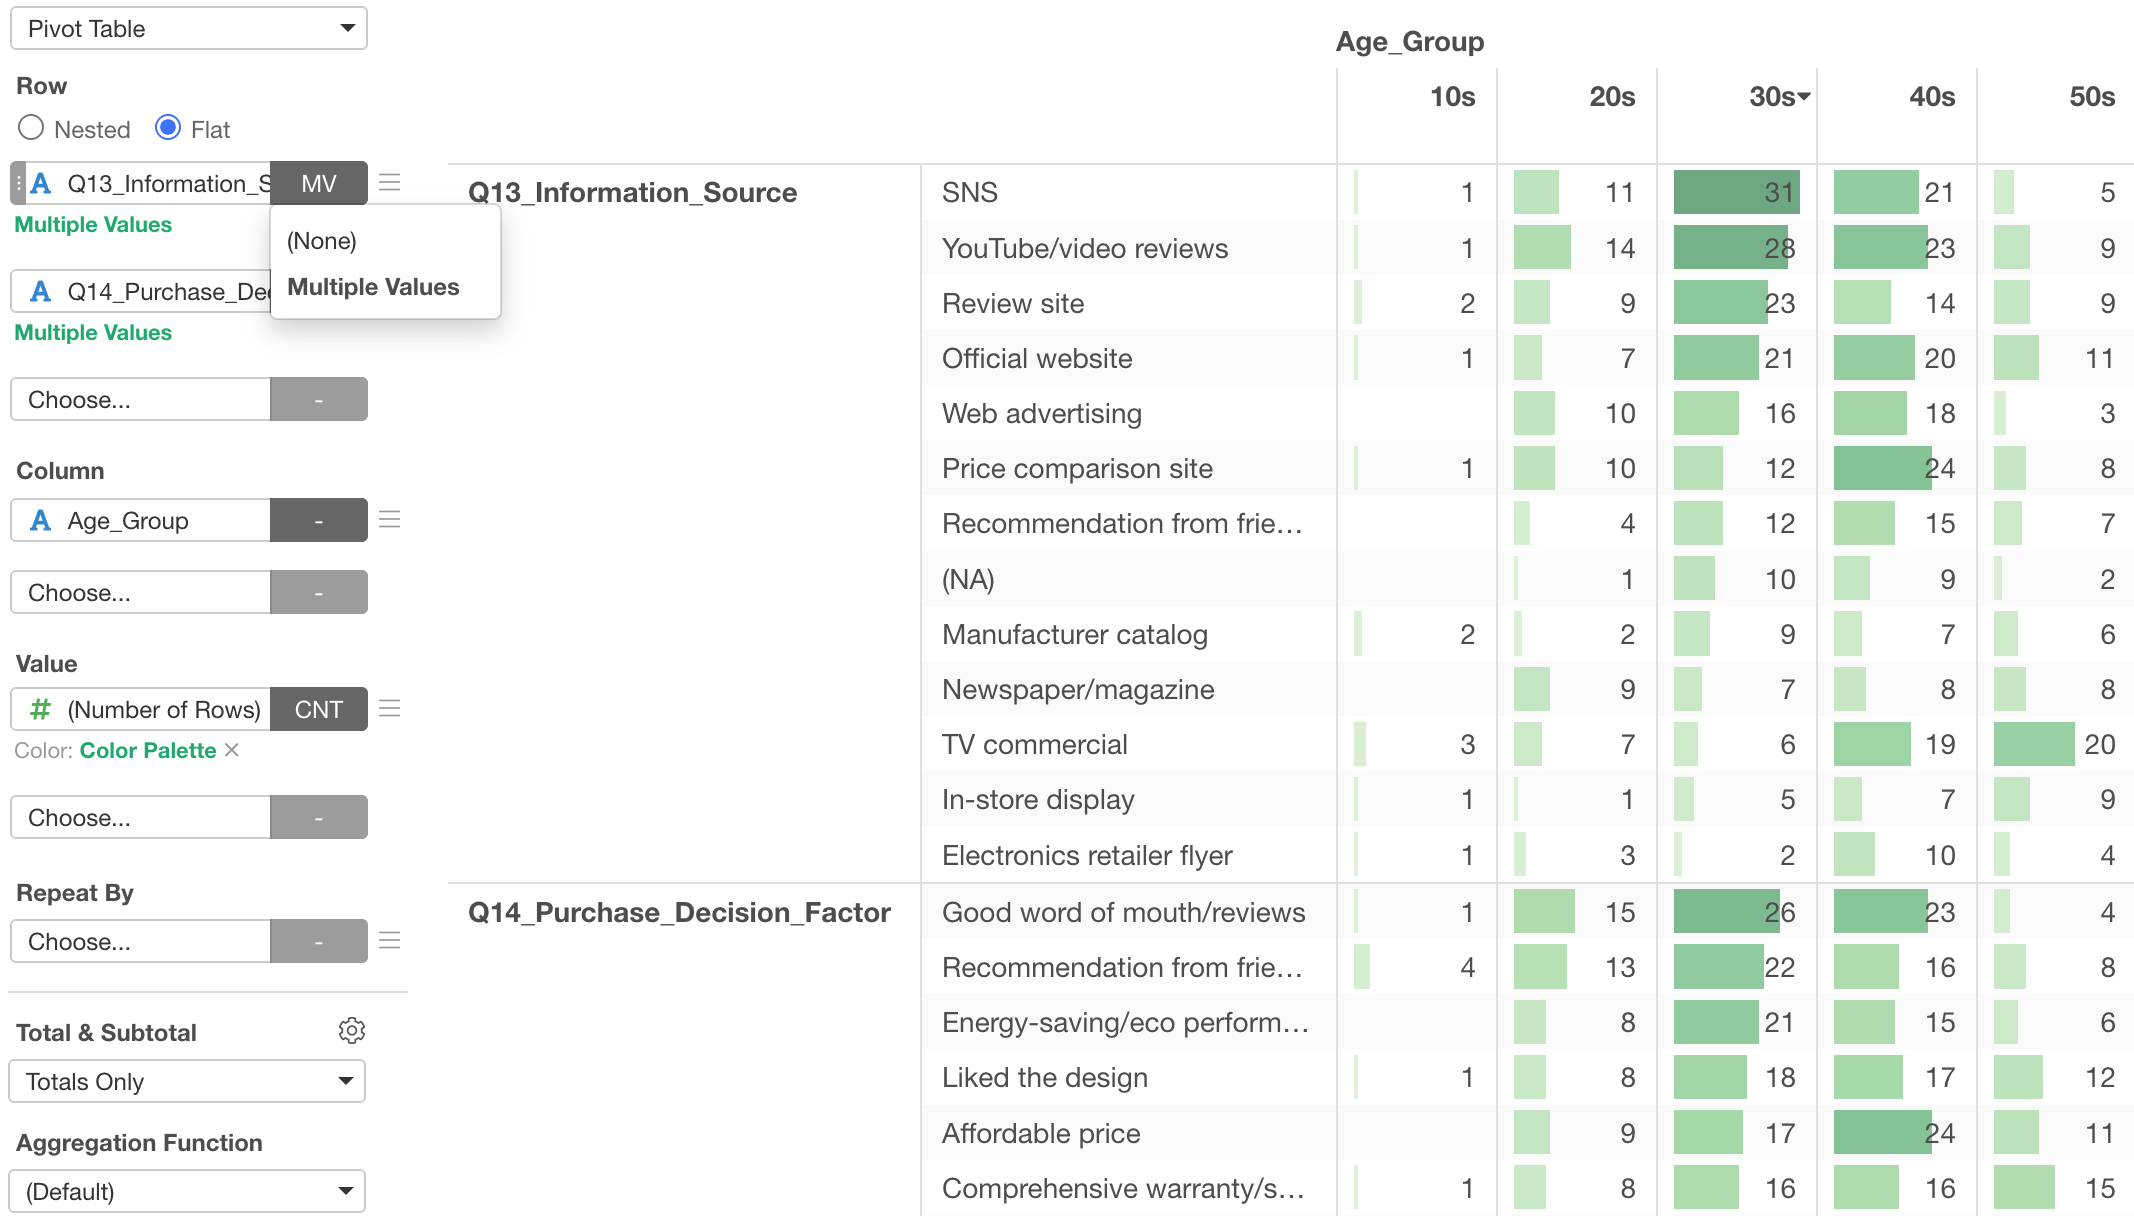
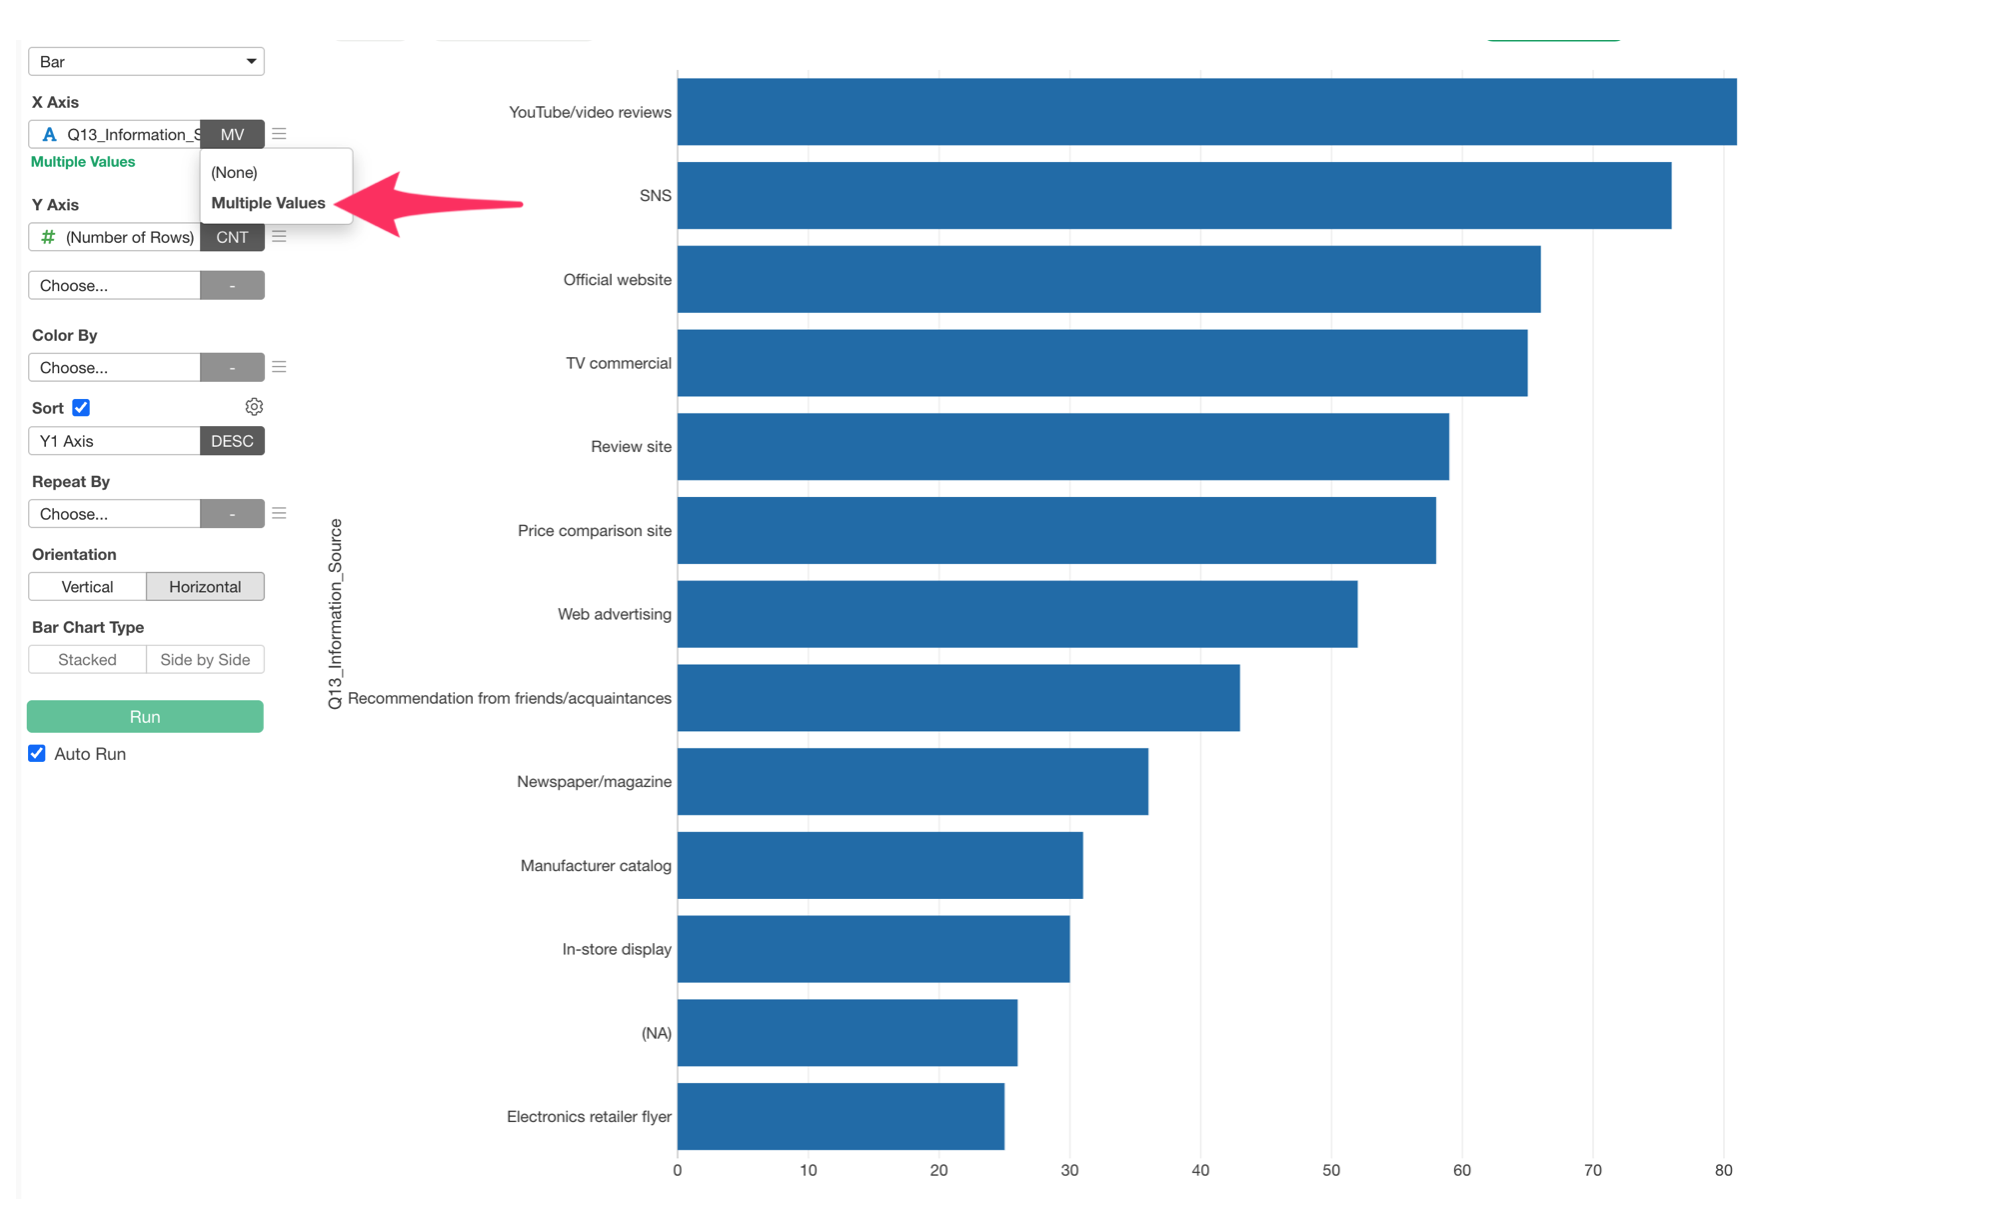
And this is not just for Pivot Table, but also for Chart!
Compare Many Questions Without Reshaping the Data
Survey datasets are usually stored in wide format, with one column for each question.
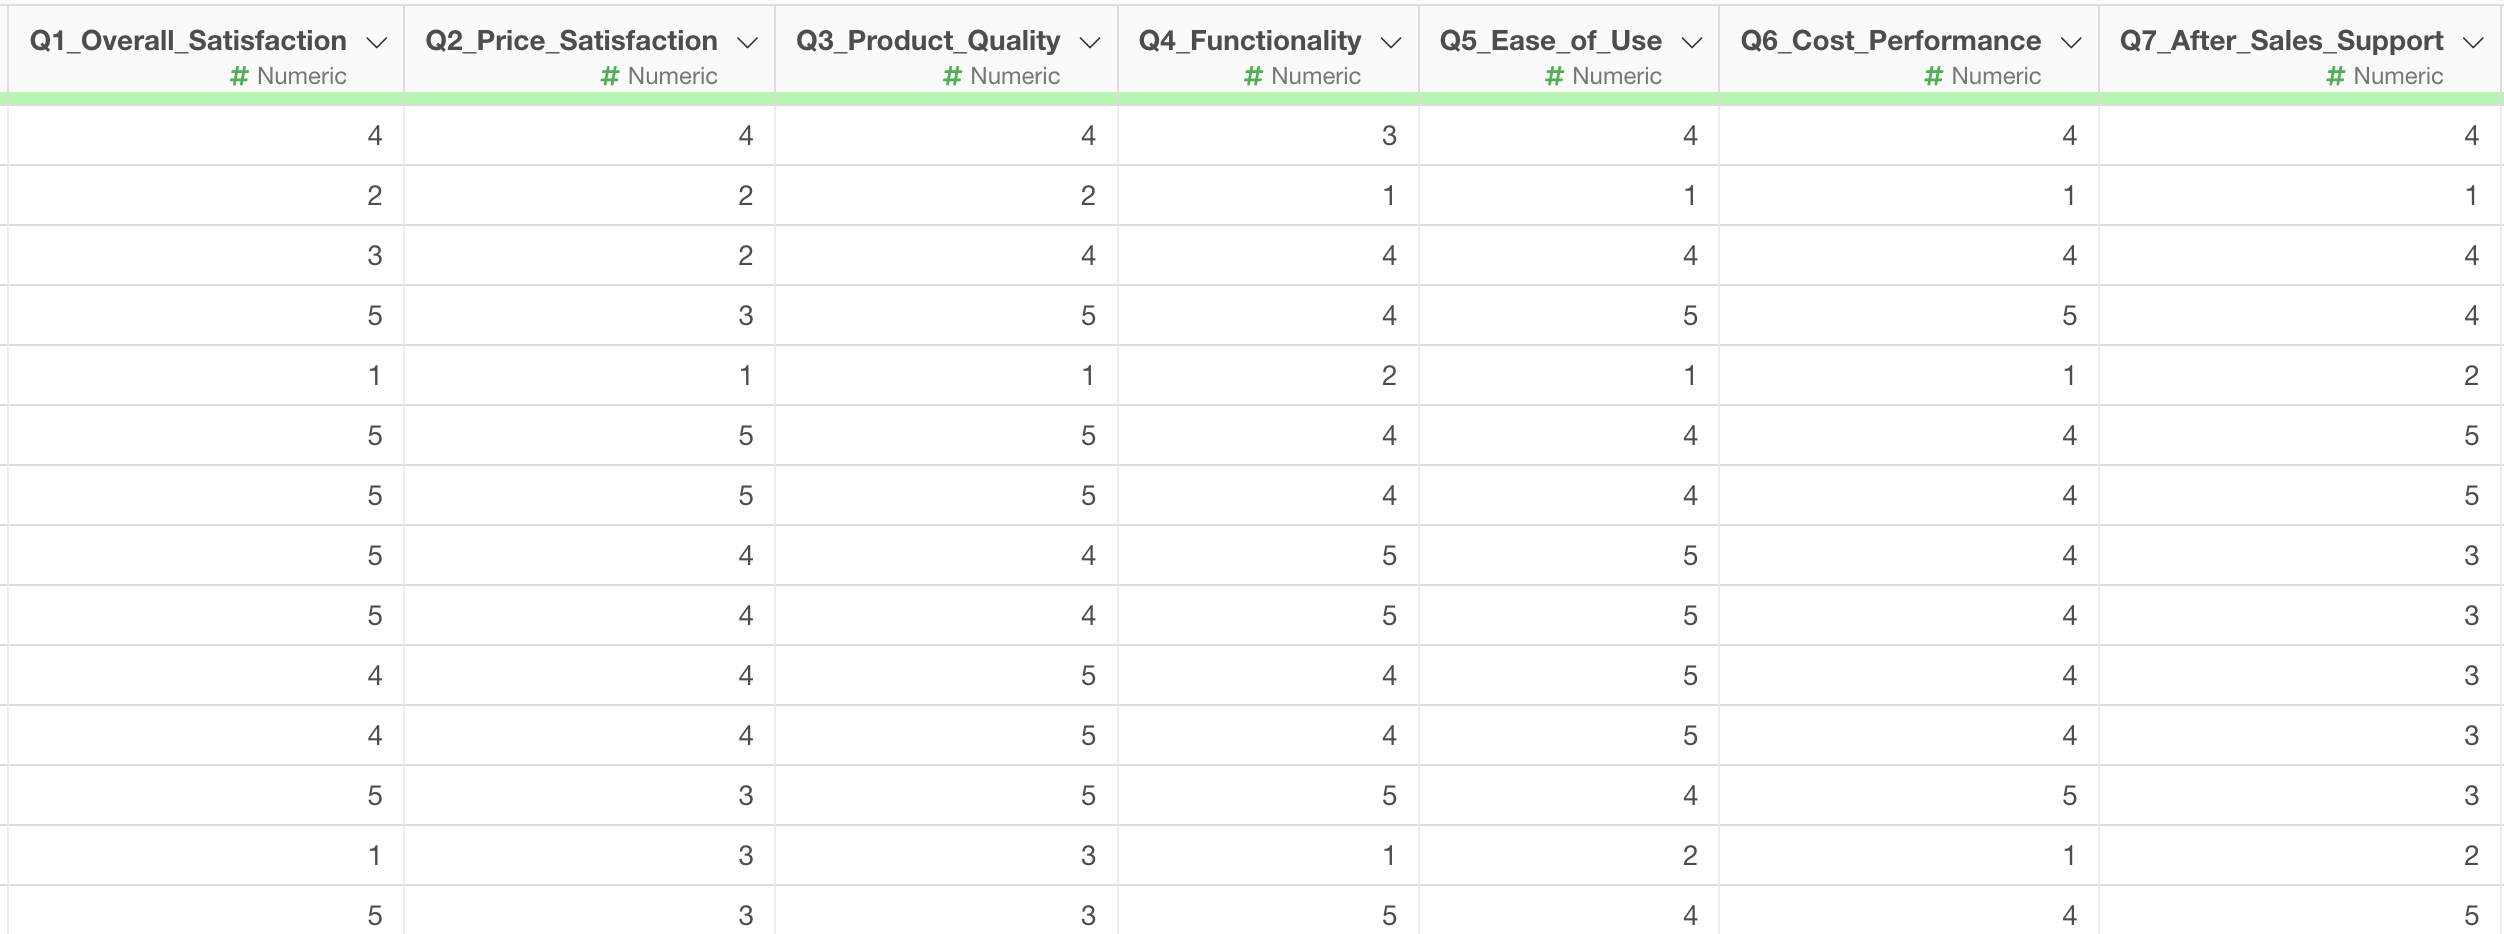
In the past, comparing many questions together sometimes required transforming the data into long format first.
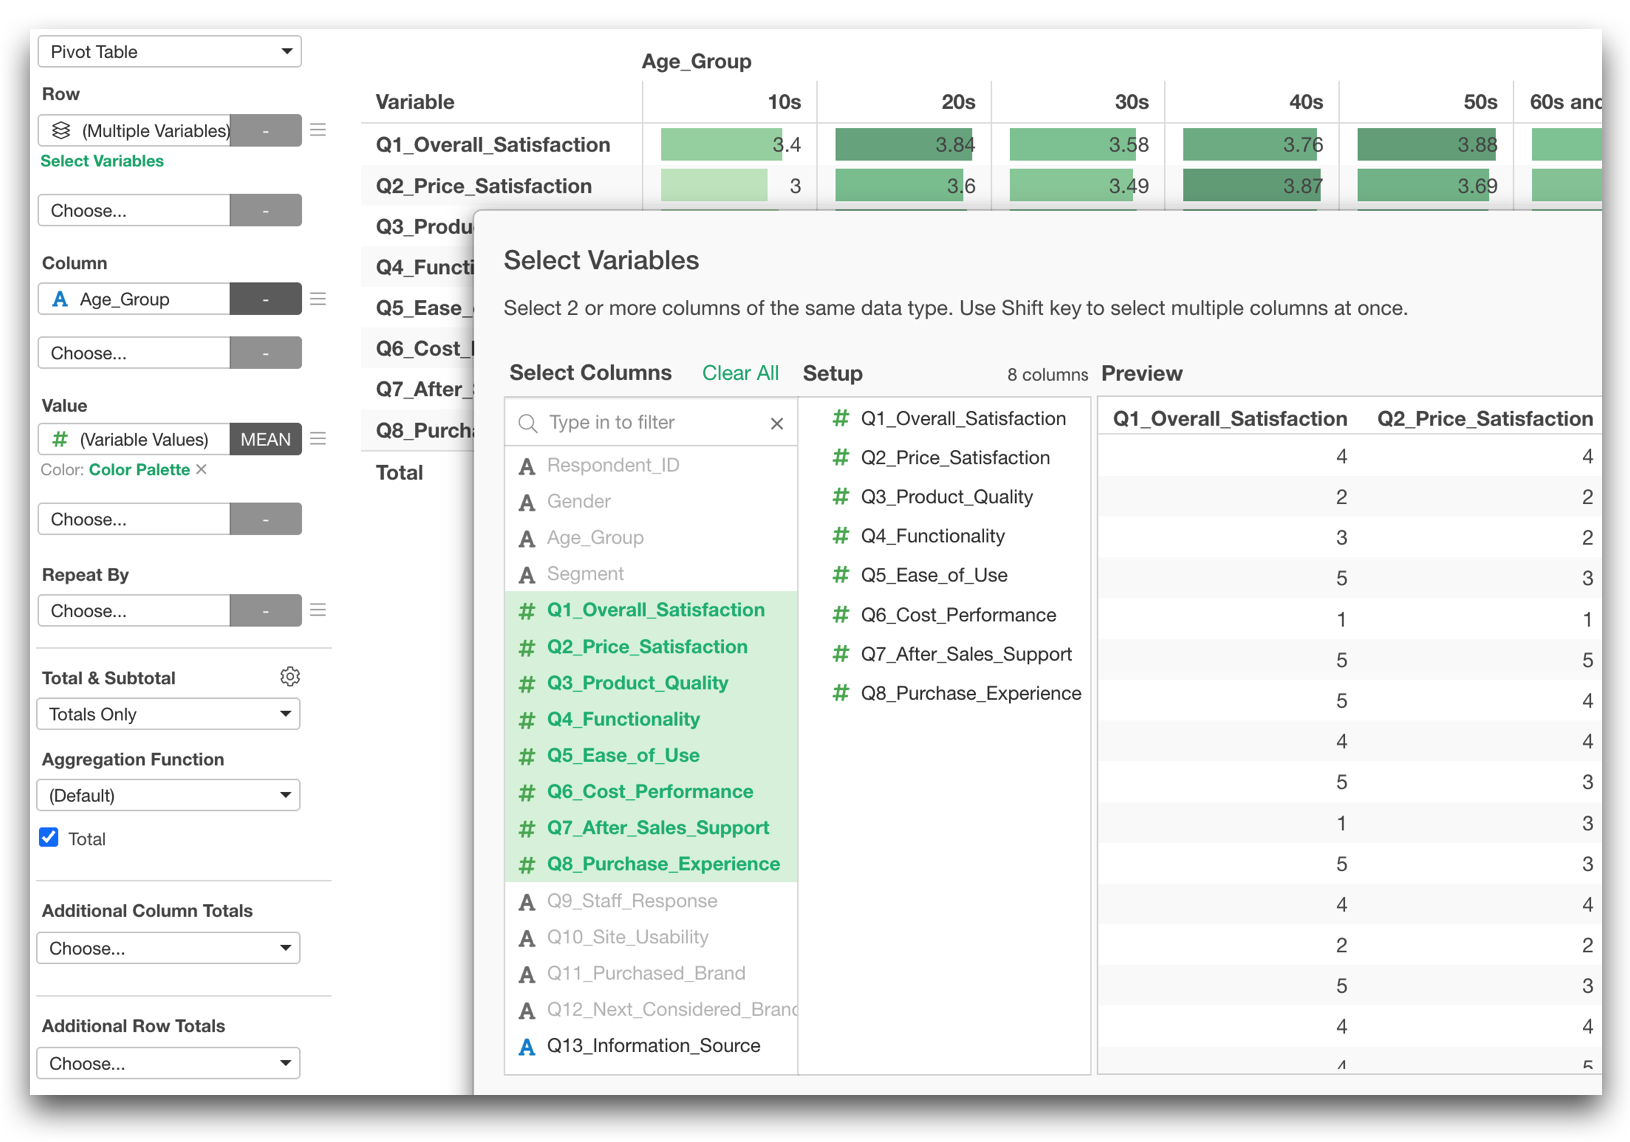
In v16, Pivot Table and Chart can work with multiple variables much more efficiently.
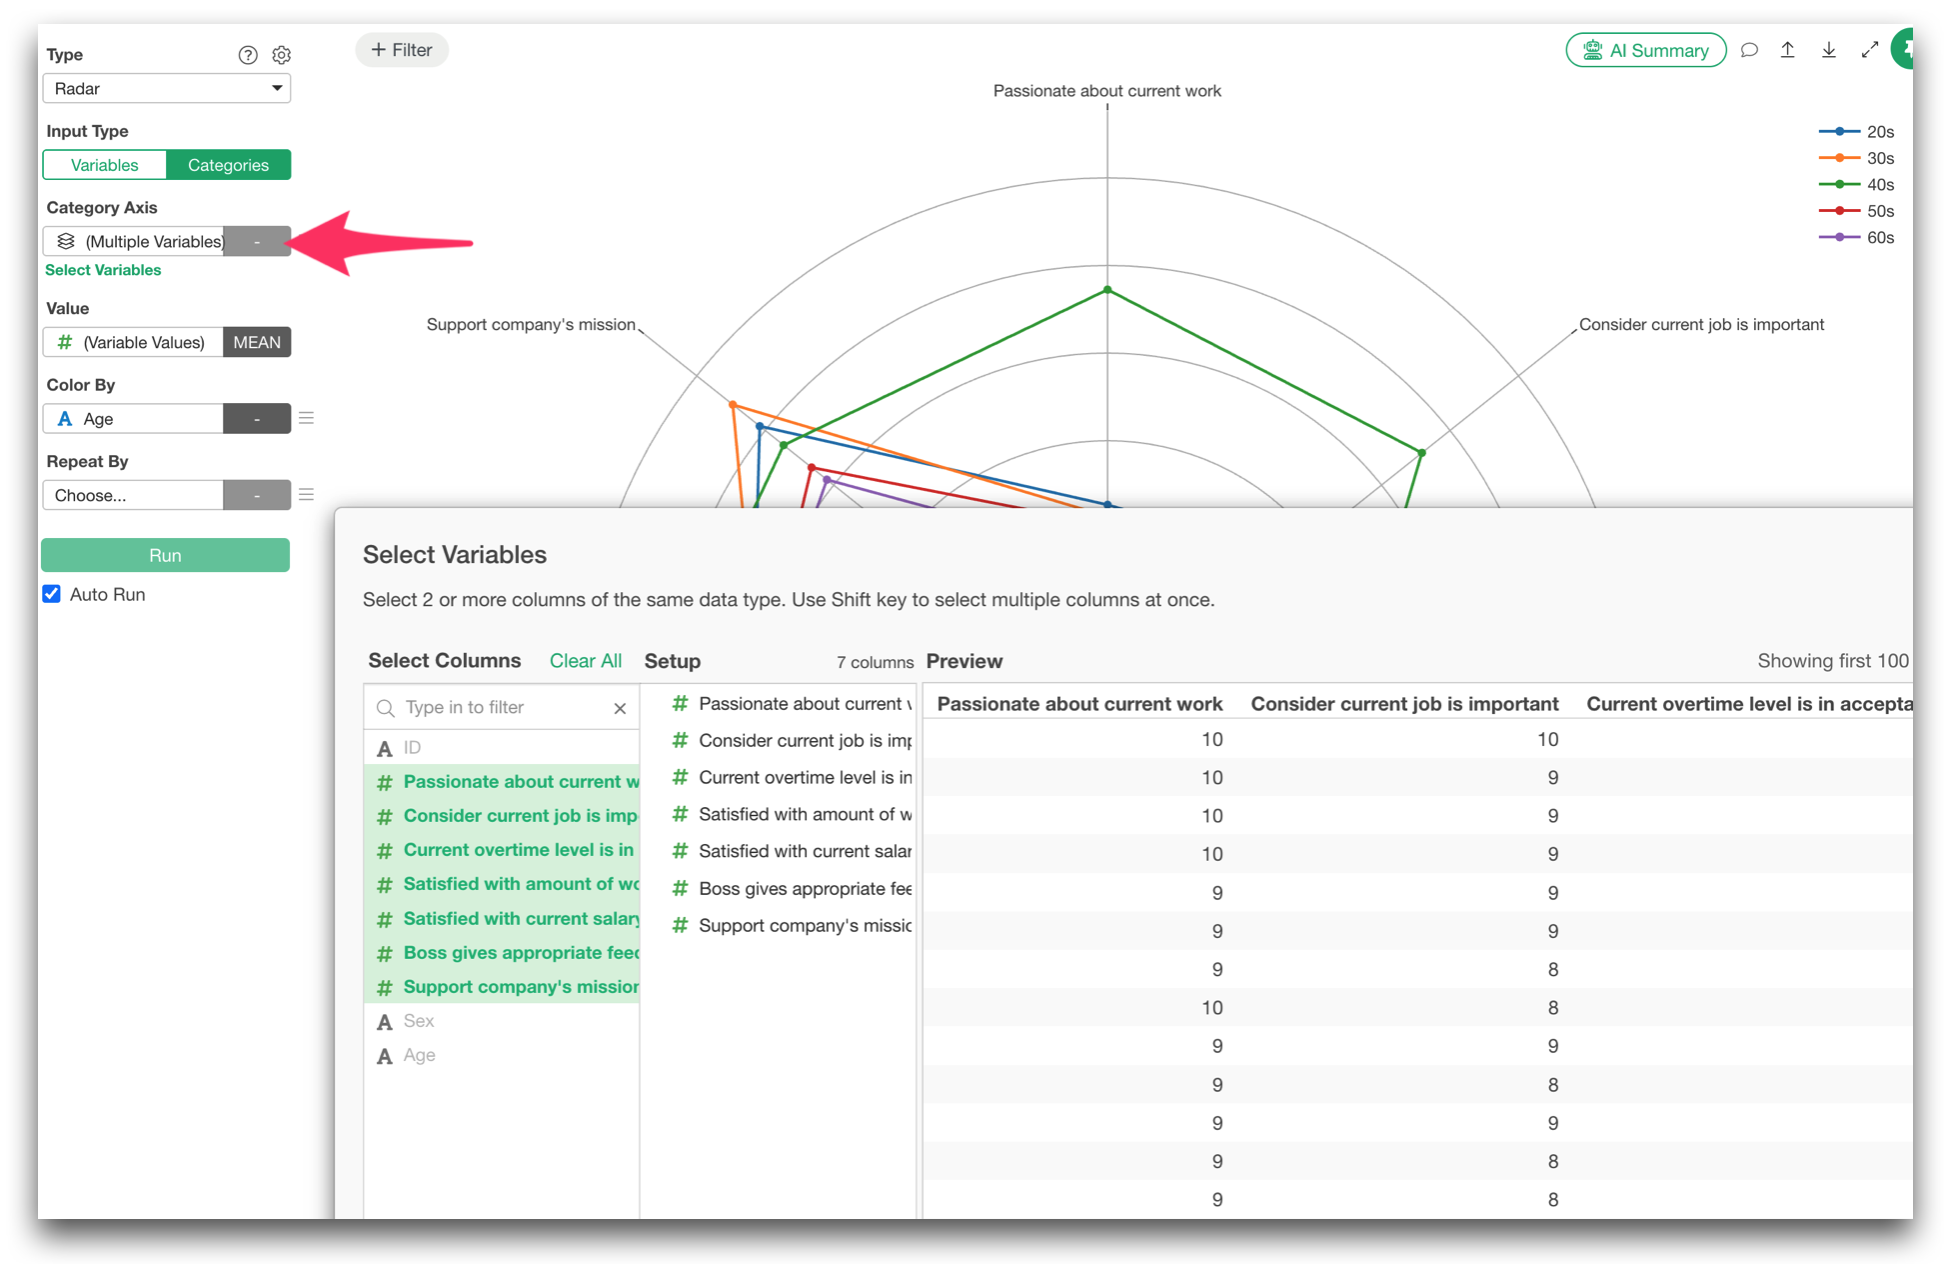
You can now select ‘Multiple Variables’ for Row, Column, and Repeat By, and select multiple columns that are same data type.
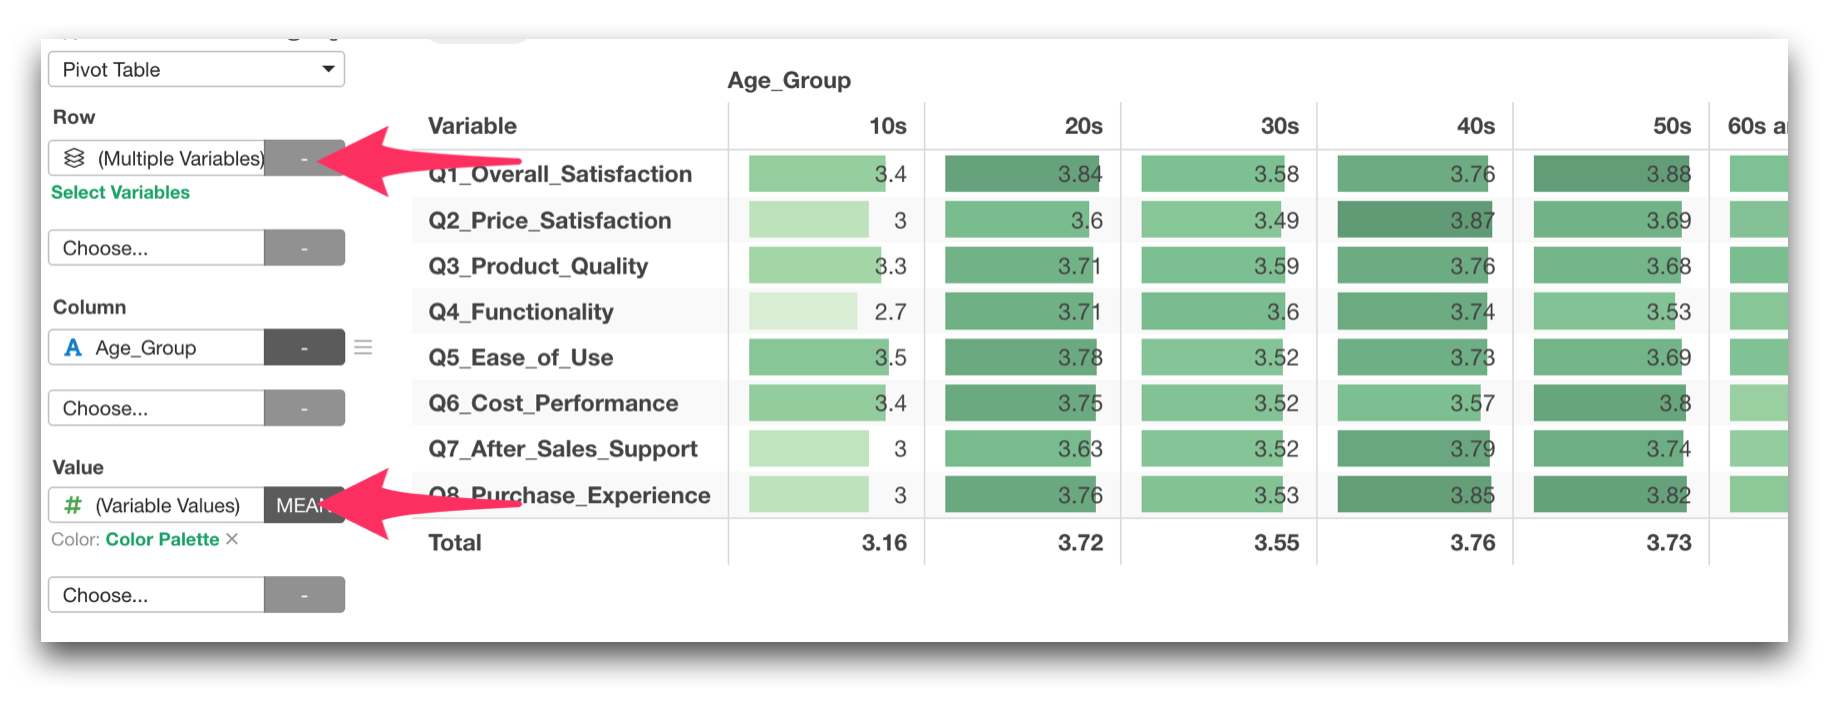
And you can assign ‘Variable Value’ to Value, Column, etc. to see the mean scores of all the variables, for example.
With a shared scale like 1 to 5, you can quickly compare response patterns across every question at once.
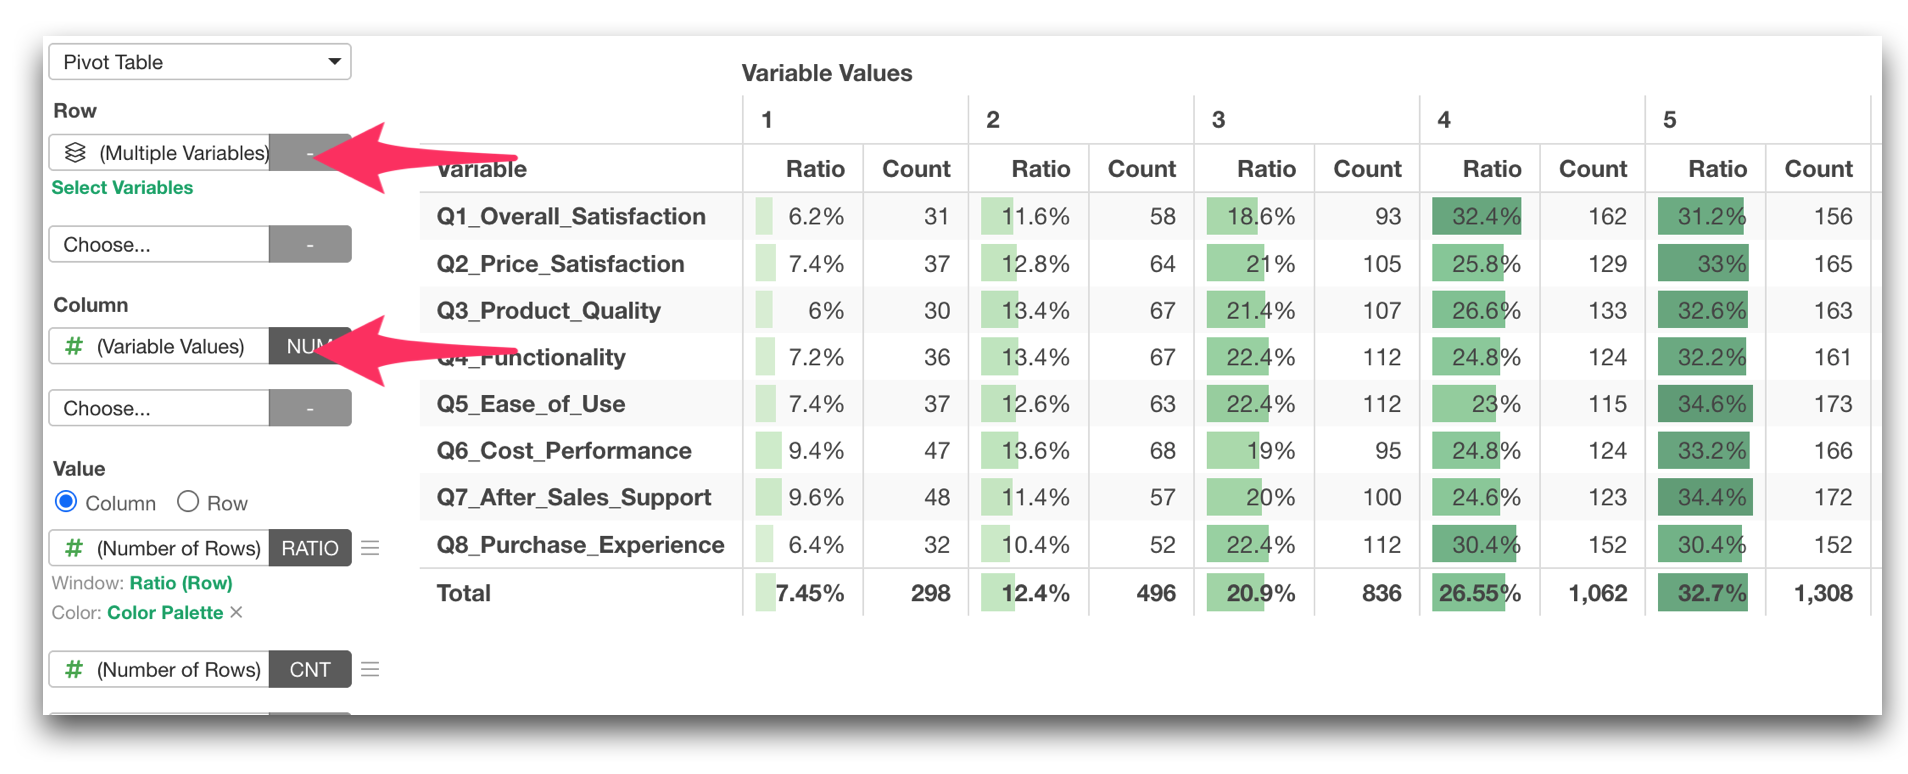
With this new option, you can now quickly compare the averages of many questions side by side, compare their response distributions, or break them down by attributes such as age group, department, region, or customer segment.
Generate Many Cross-Tabulations with “Repeat By”
We added Repeat By support for Pivot Table!
For example, you can create the same set of tables repeatedly for different departments or regions without rebuilding each one individually.
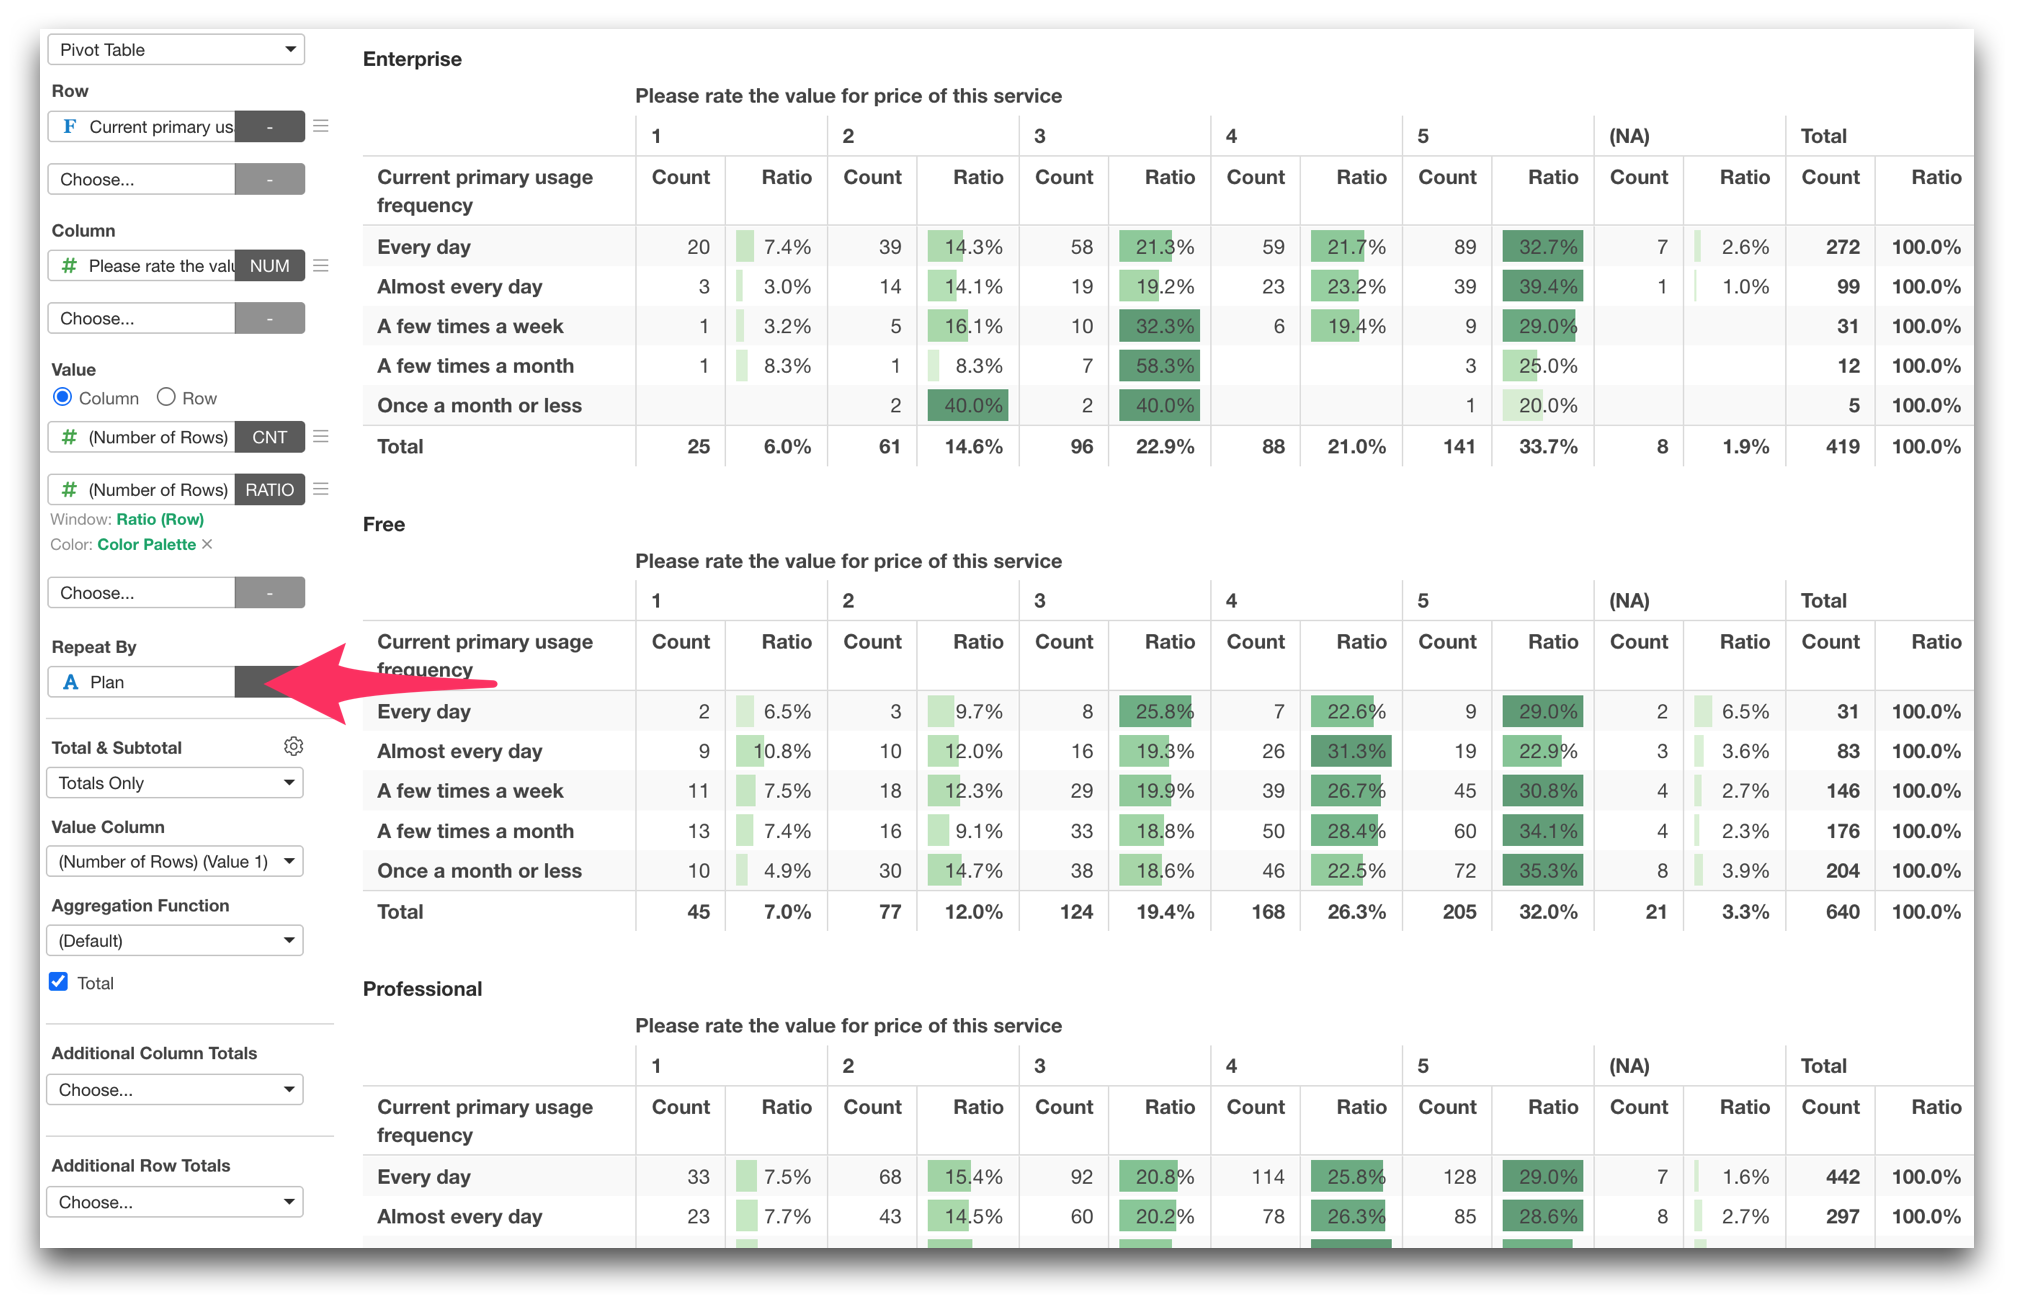
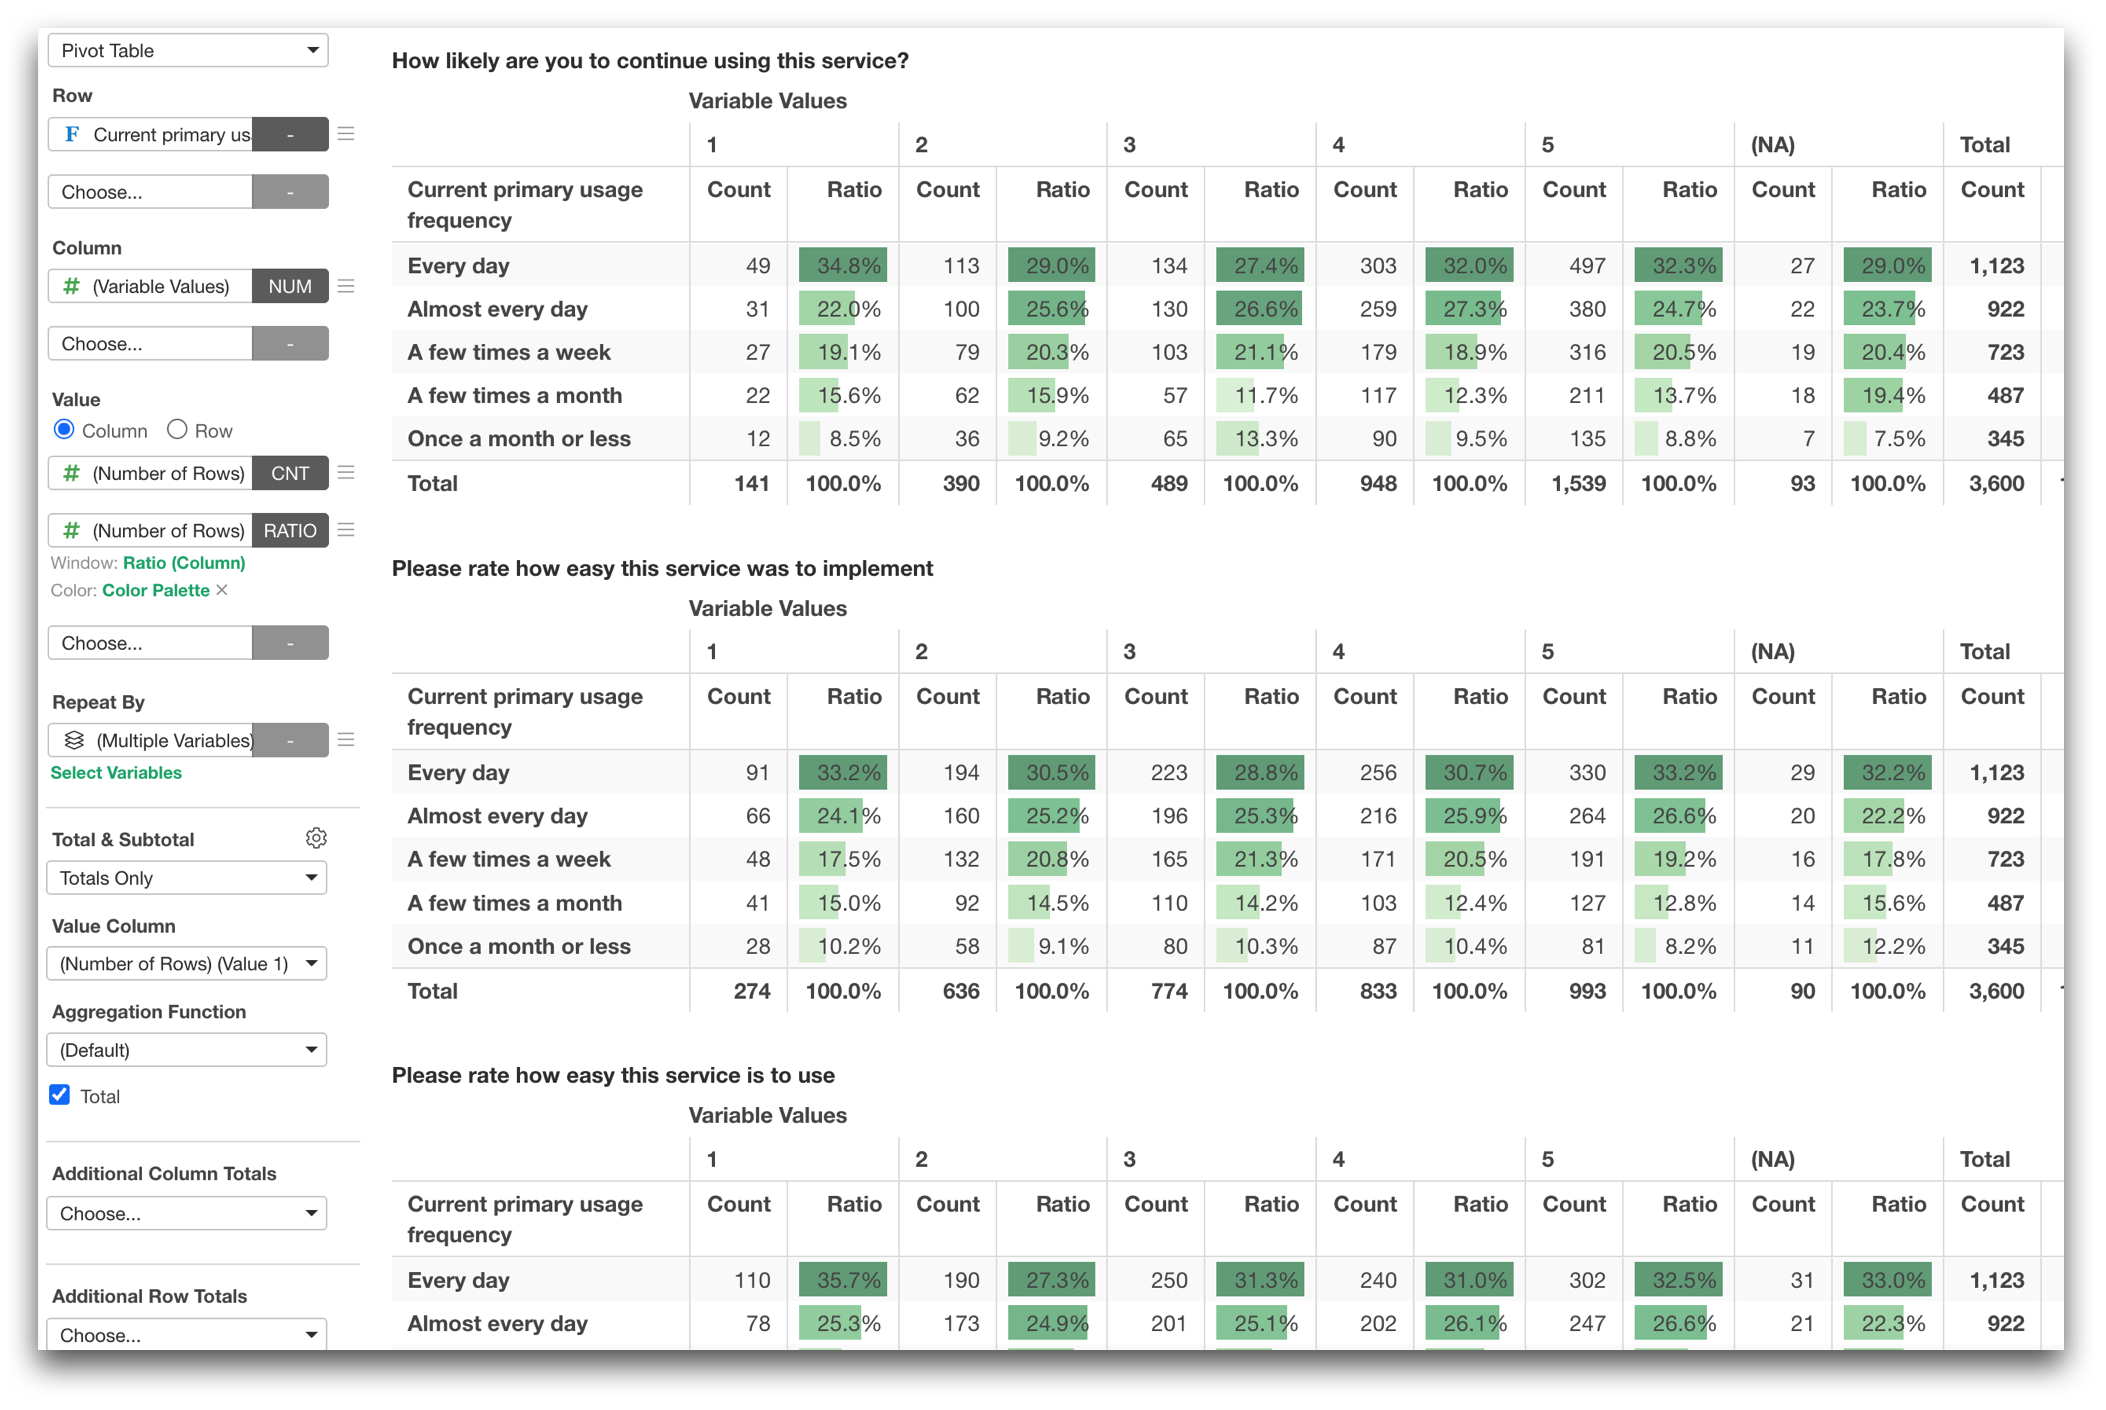
And, the multiple-variable functionality described above can also be used together with Repeat By. This means, you can generate cross-tabulation repeatedly by questions if you select ‘Multiple Variable’ for Repeat by.
And one more!
When you export the result to Excel or Google Sheets, each repeated table can be exported to a separate sheet!
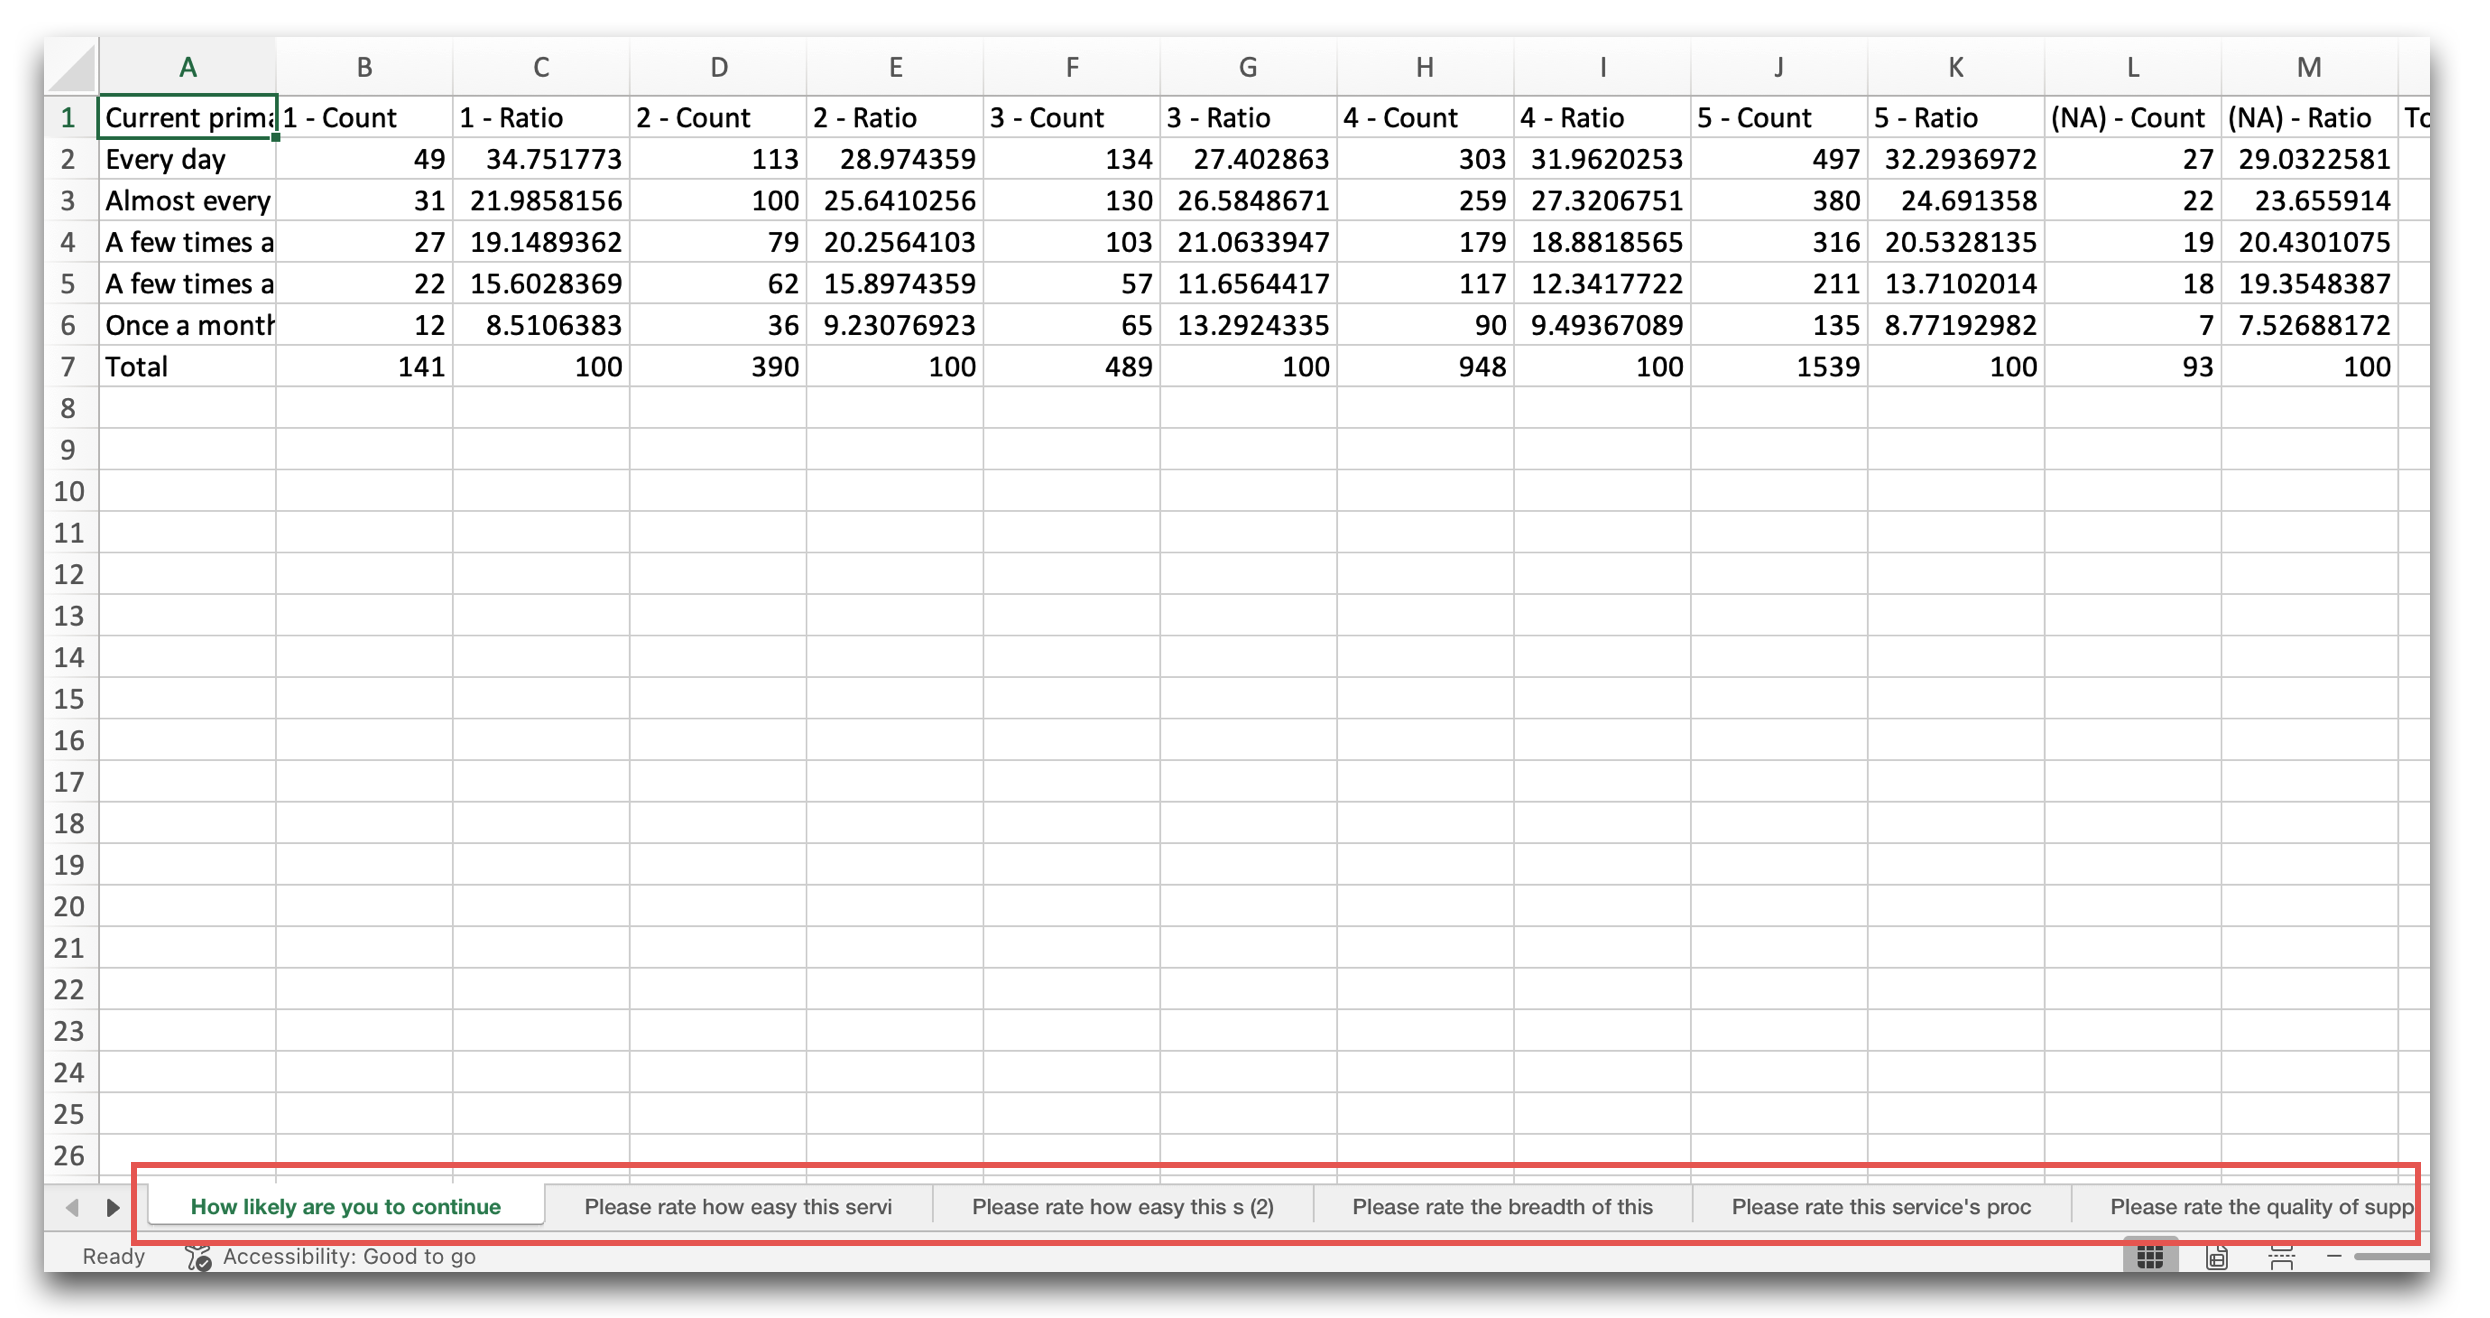
Instead of building the same table over and over again, you can now generate them all at once!
Create Cross-Tabulations at the Same Level with “Flat”
We added a new Flat option to Pivot Table rows.
Previously, when multiple variables were assigned to Rows, they were generally displayed hierarchically. Age Group for each type of Gender, for example.
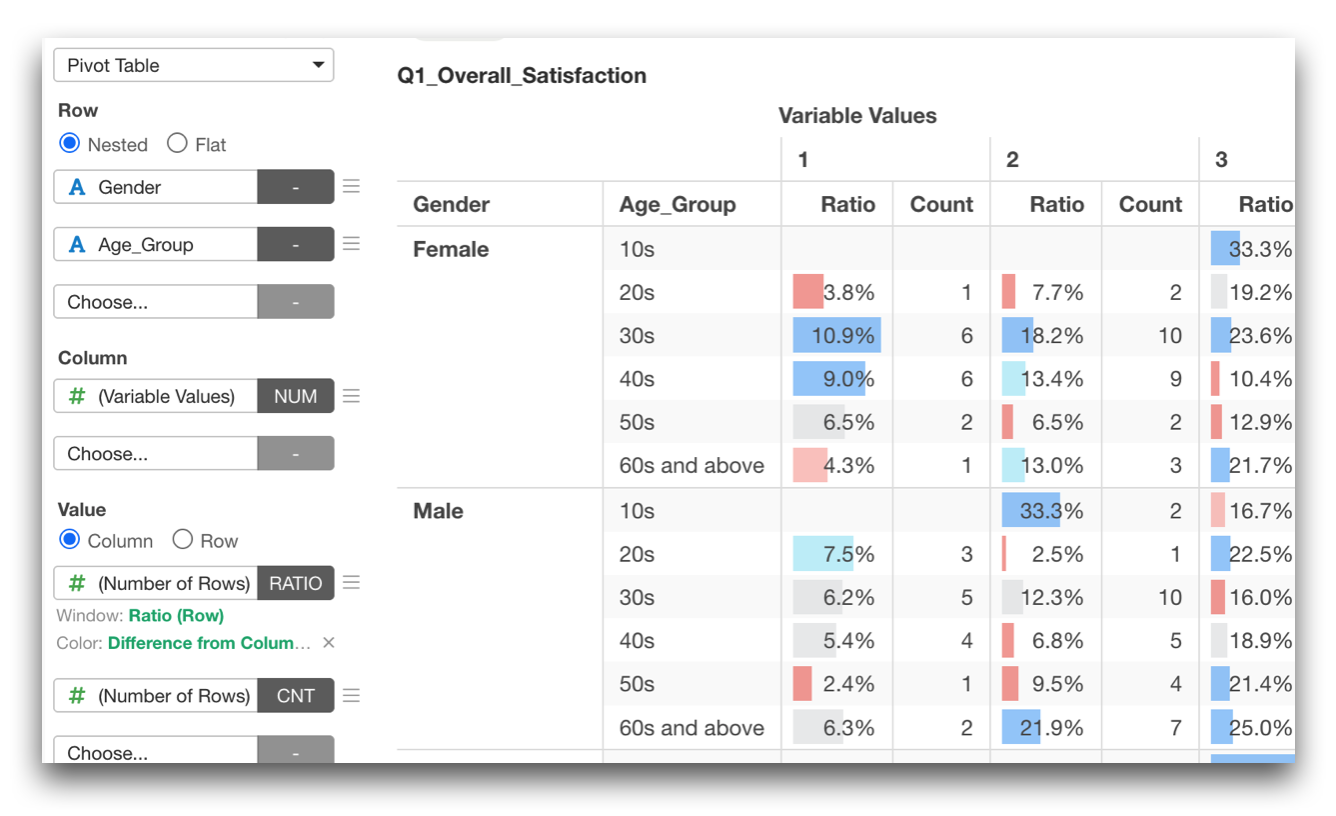
With the new Flat option, each variable such as Gender, Age Group, etc. can instead be displayed independently at the same level.
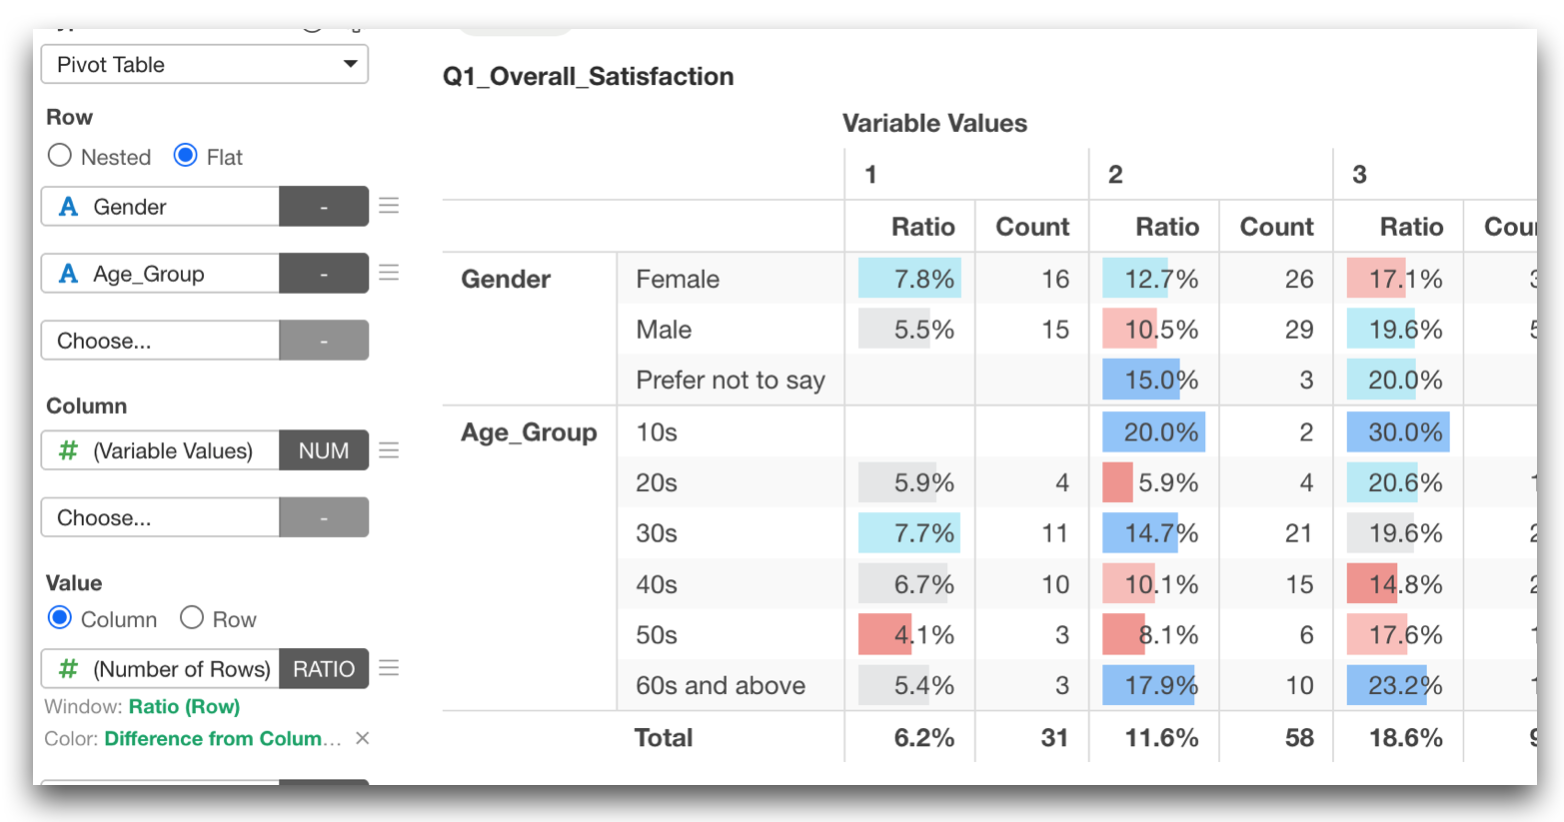
This makes it particularly useful for survey questions that you want to present the result listed by each demographical group.
Categorical Input Mode for Radar Charts
Radar charts now support a categorical input mode.
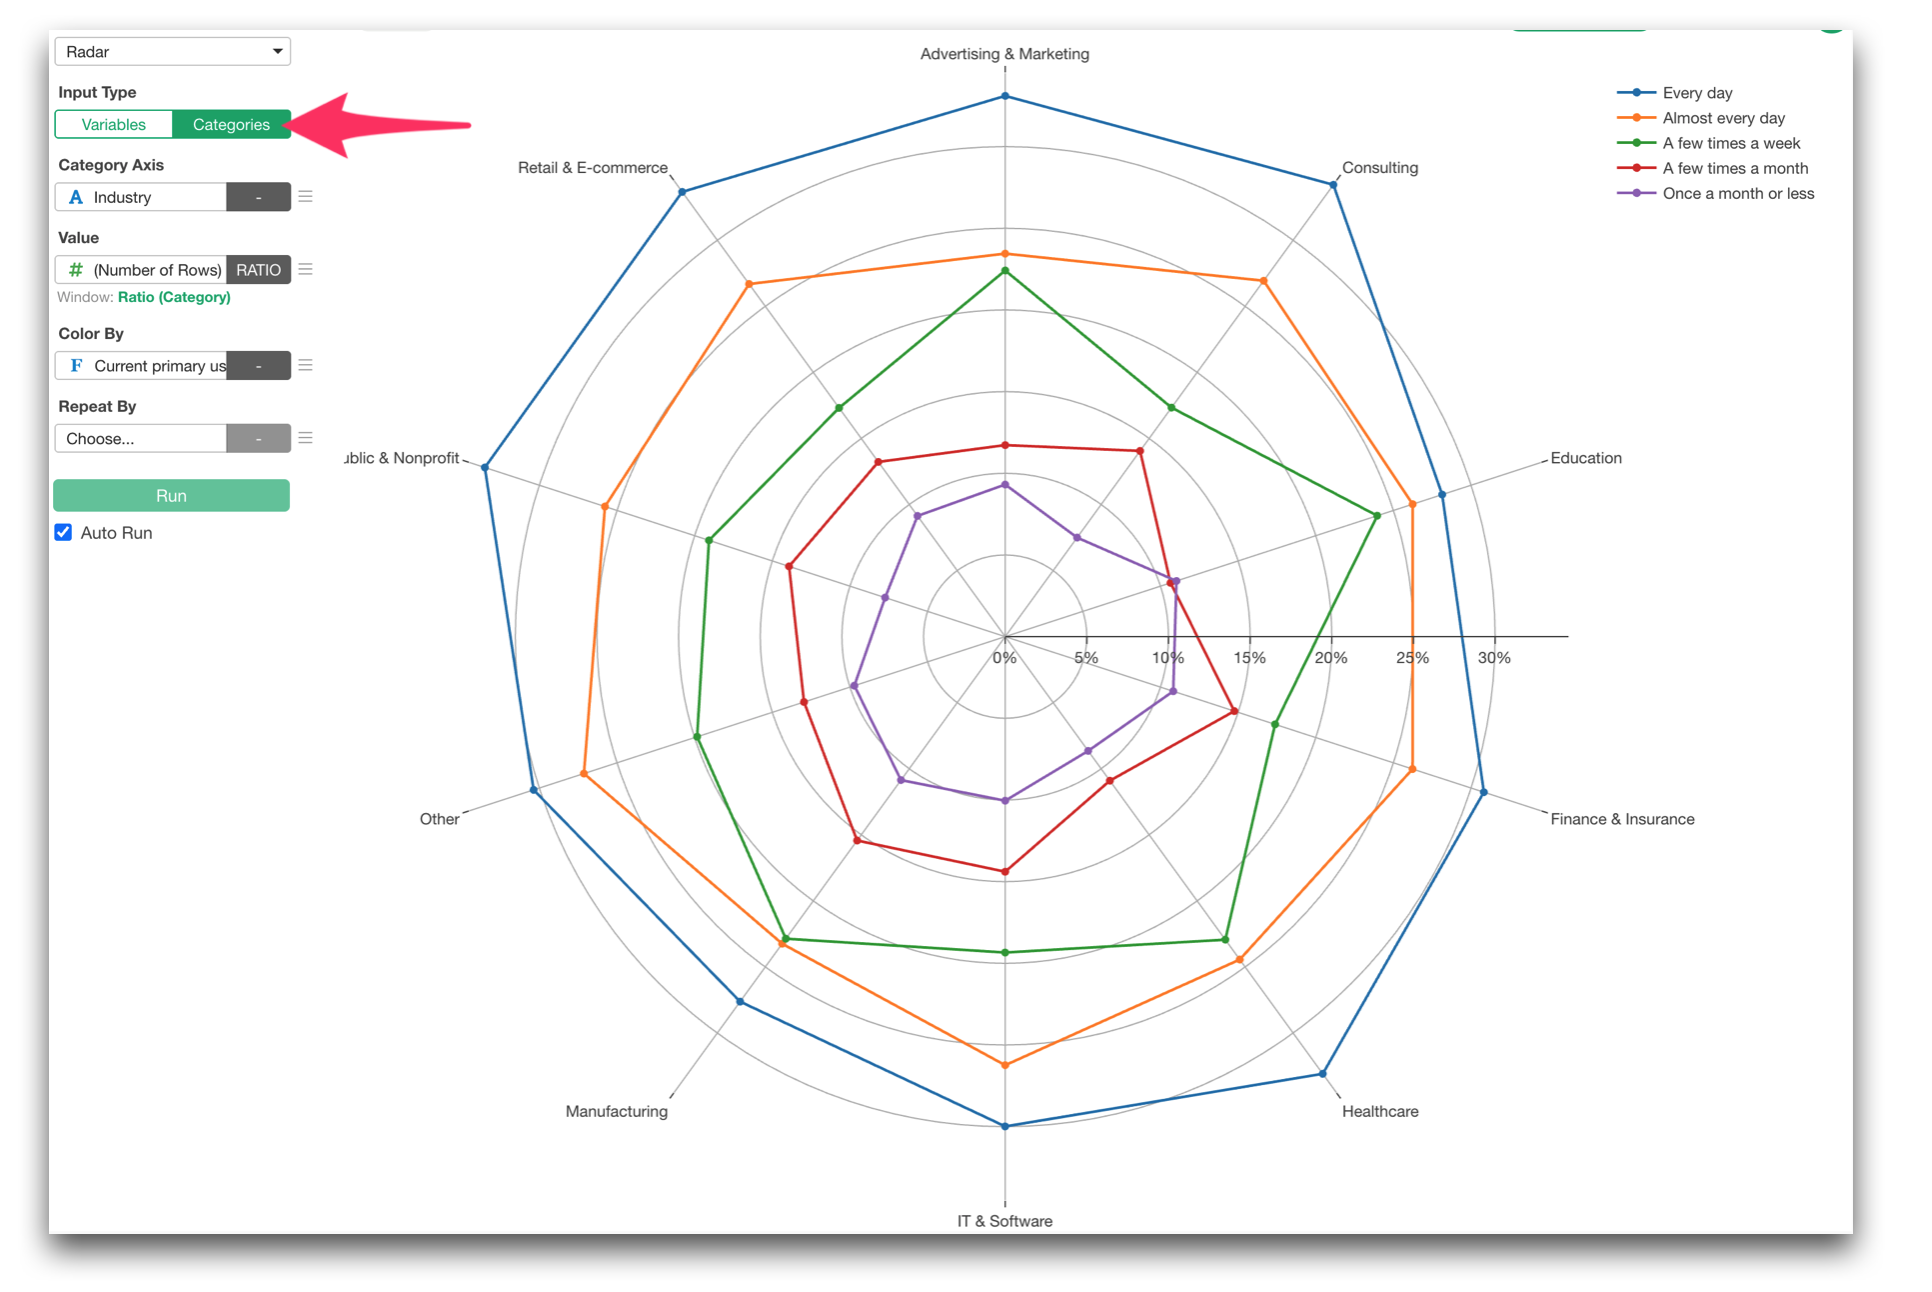
You can also select the ‘Multiple Variables’ as the Category. This makes it easy to visualize response patterns across multiple questions by assigning them all at once, rather than adding each question column one by one under ‘Variables’ tab.
Create Ordered Categories with Drag-and-Drop
Survey responses often have a meaningful order:
- Very dissatisfied
- Somewhat dissatisfied
- Neither
- Somewhat satisfied
- Very satisfied
And you want to show these values in that order when you present.
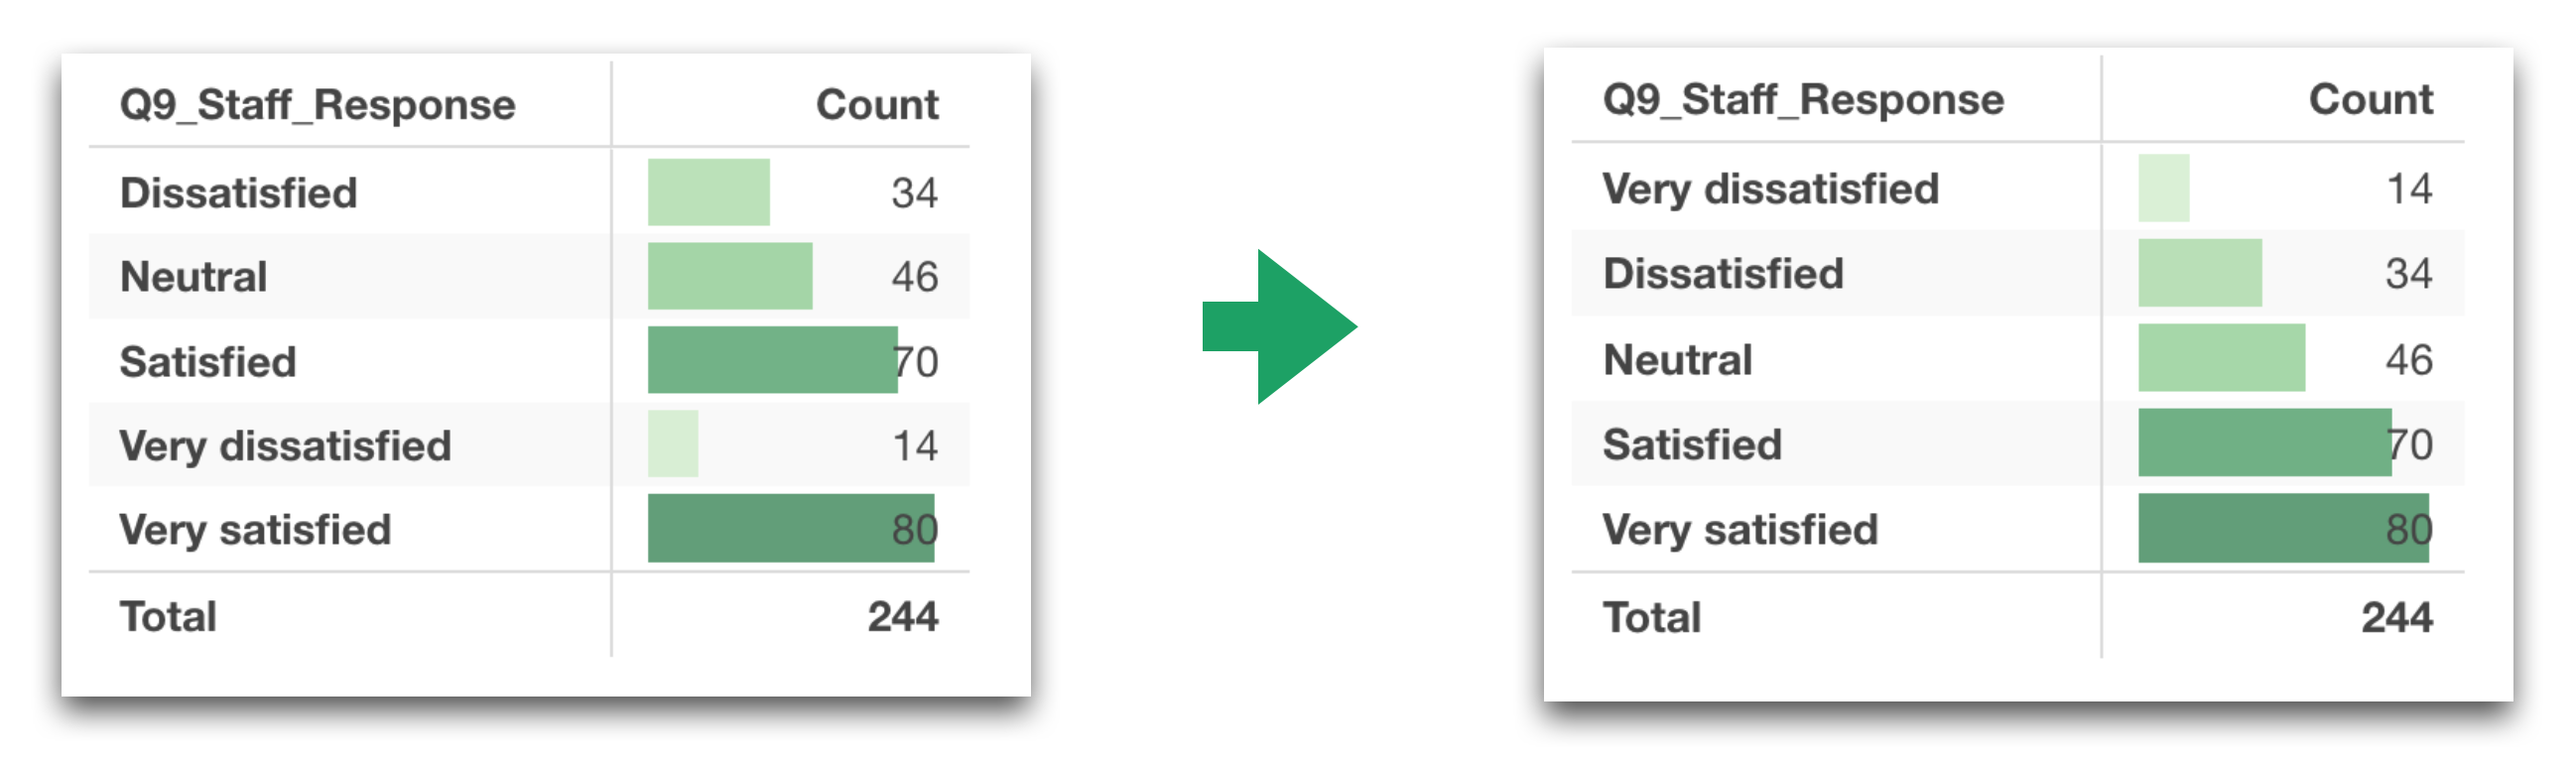
In v16, we built a new UI to set the order of categories. Now you can simply drag and drop categories to define their order.
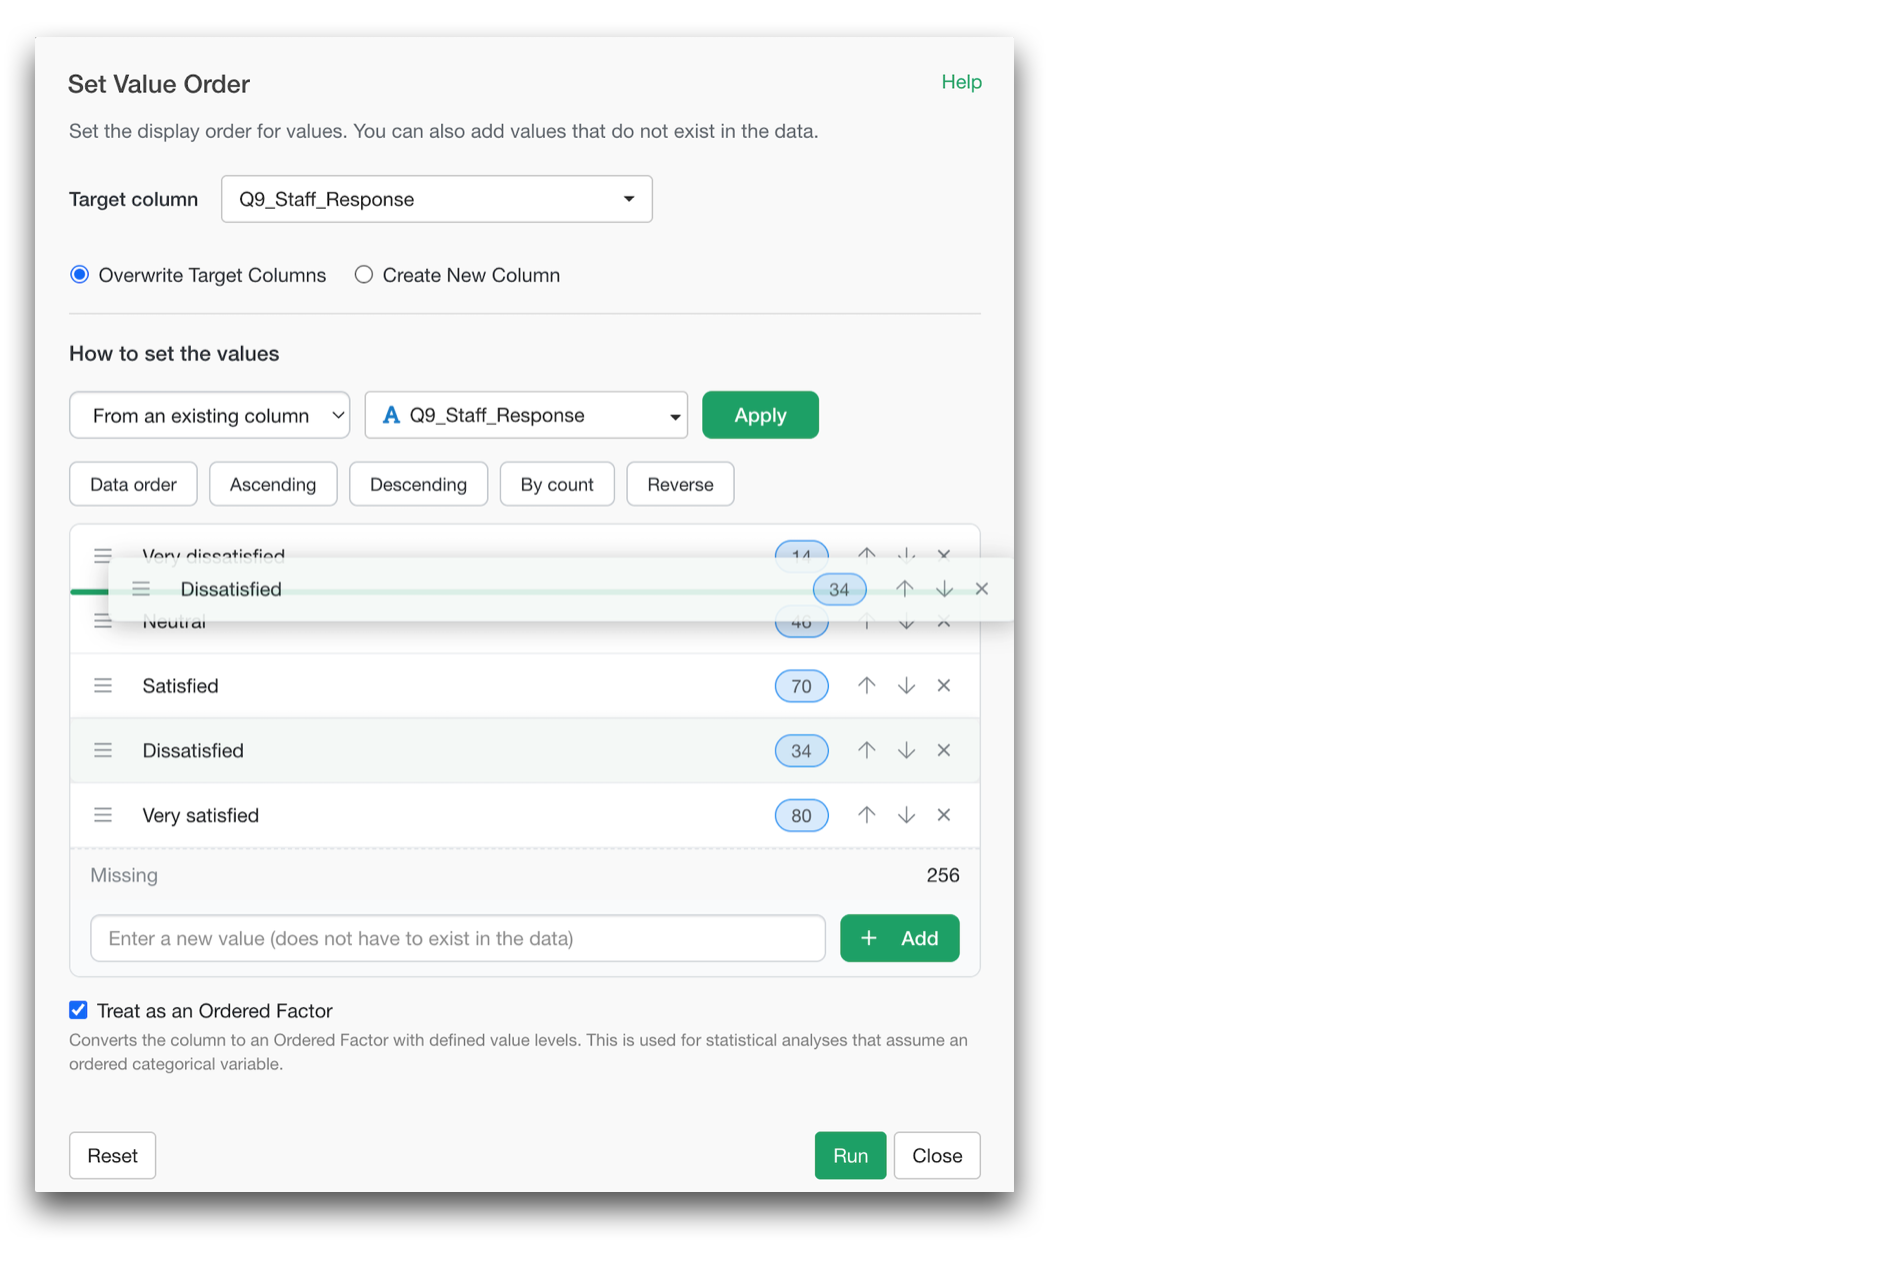
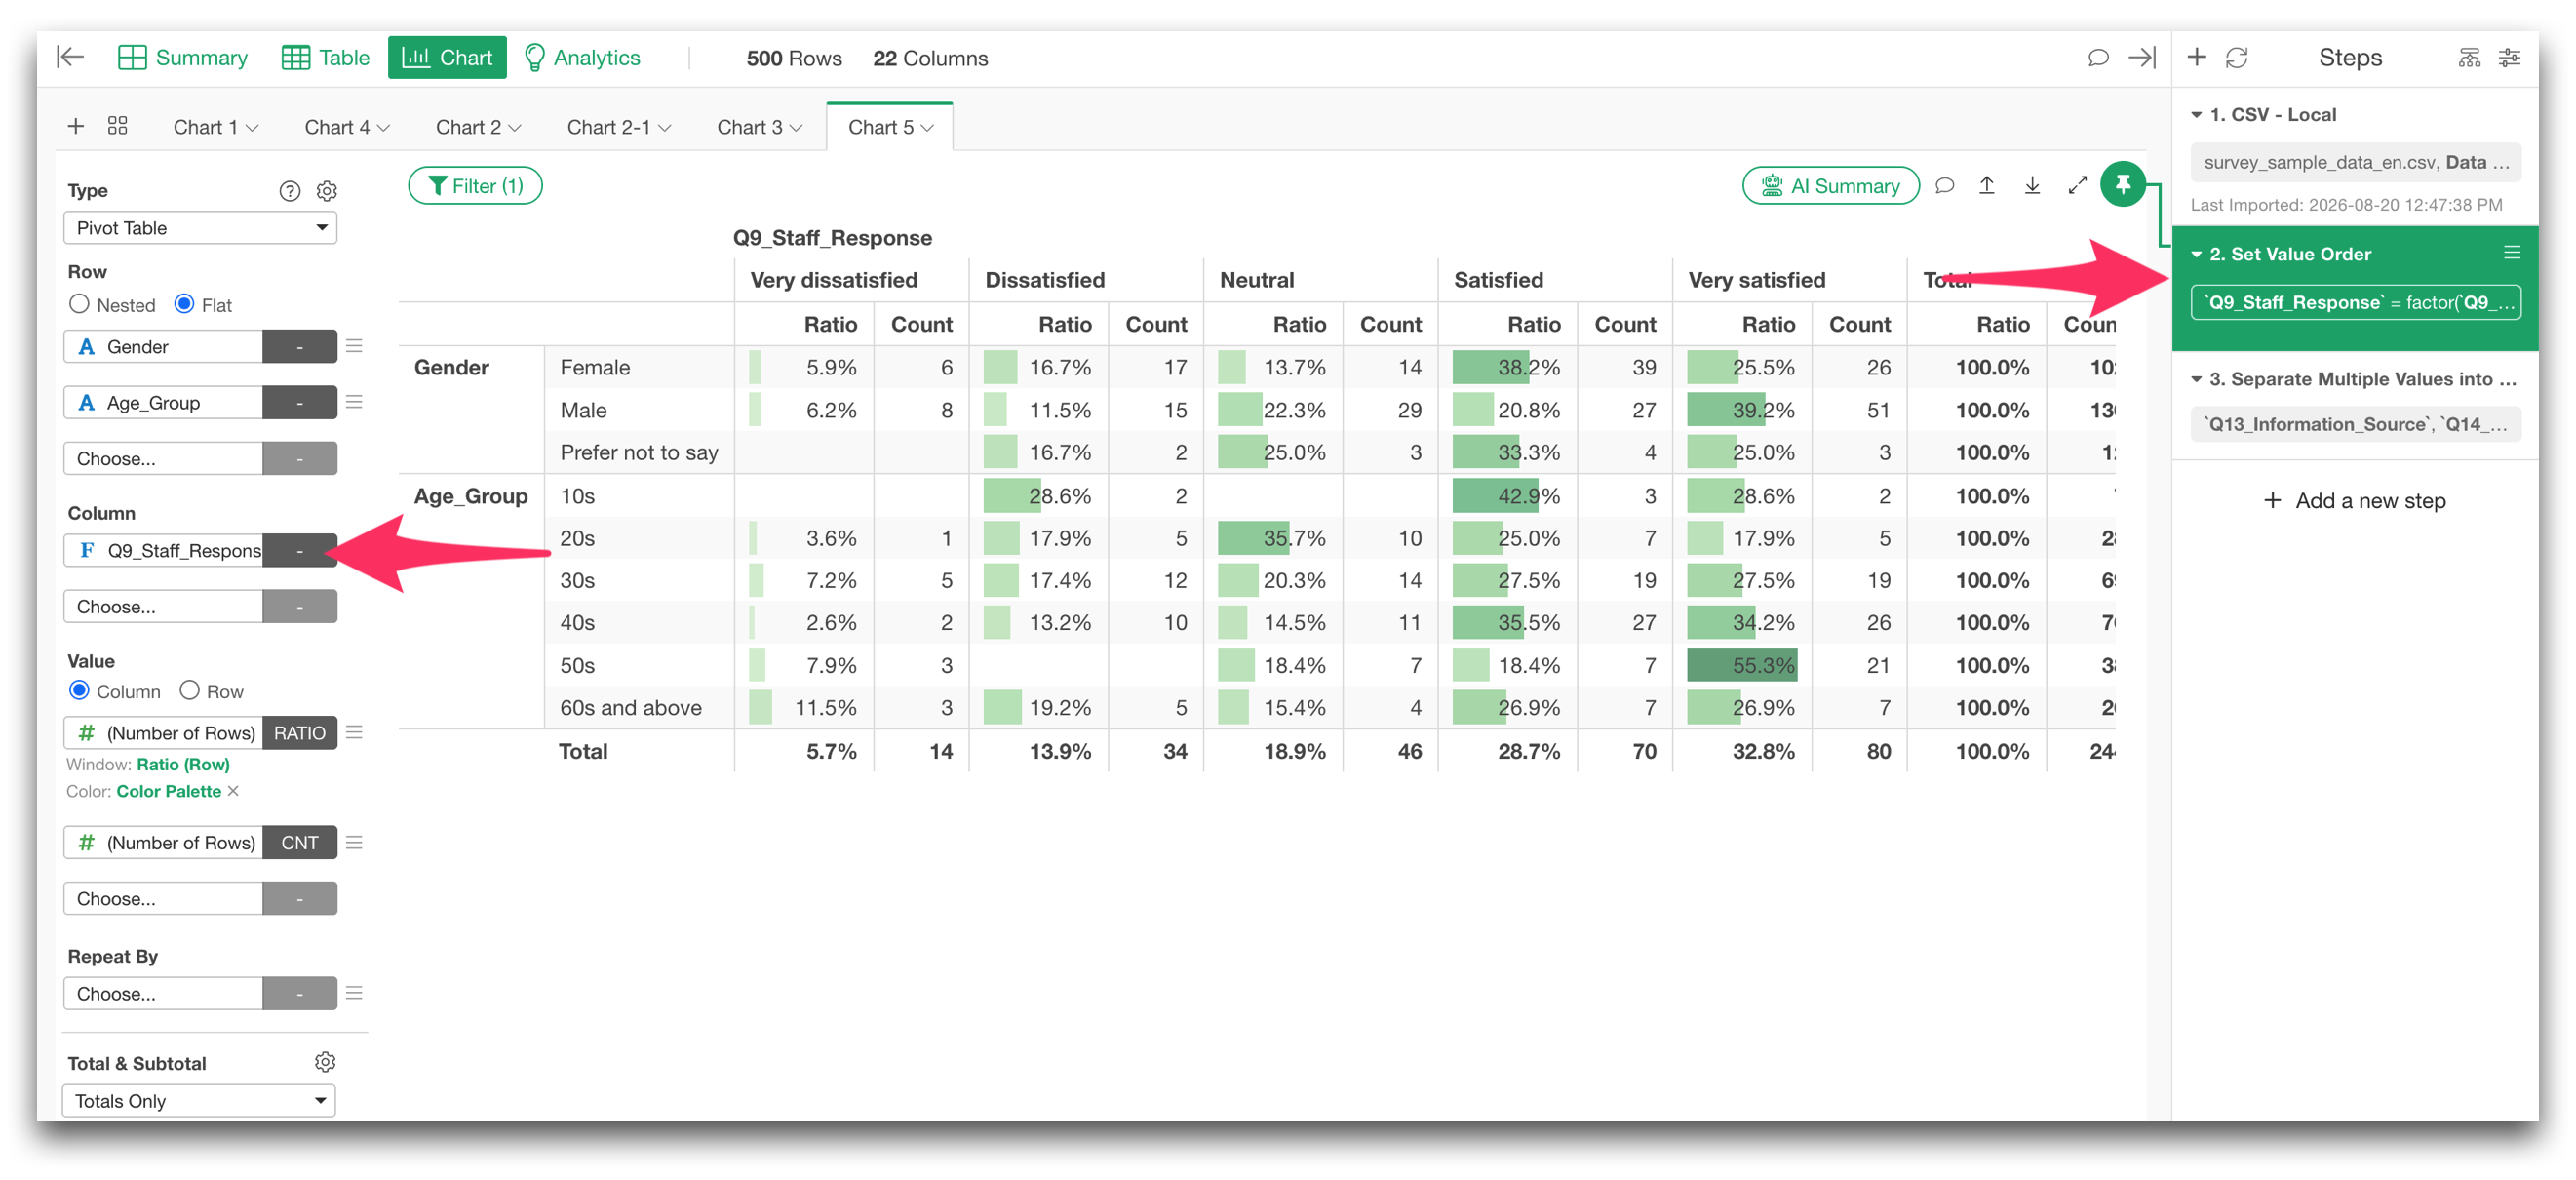
Once that order is defined, it is used consistently in your summaries and visualizations.
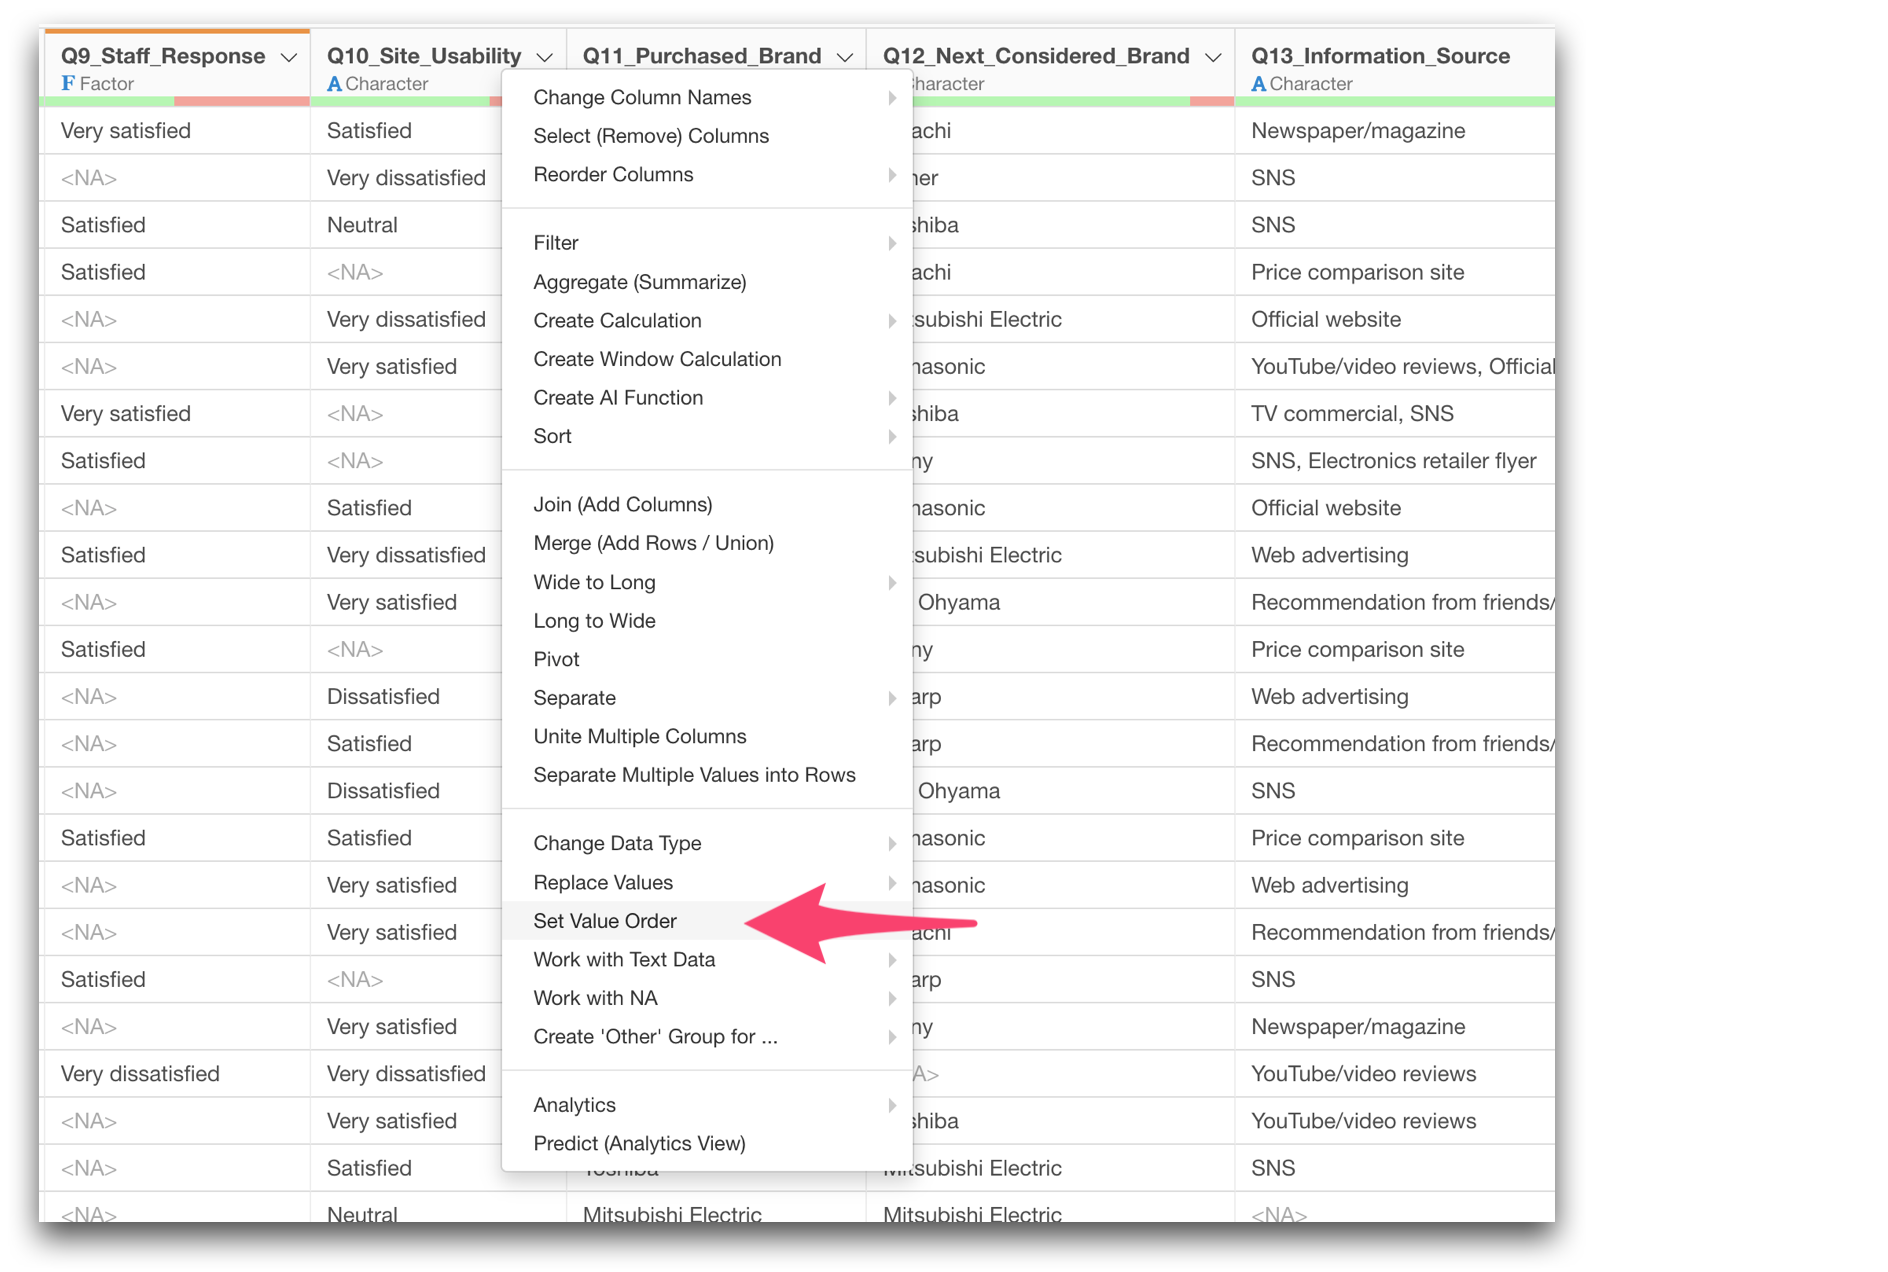
You can access this dialog from the column header menu ‘Set Value Order’.
There are more improvements around Pivot Table and Chart, but the overall idea is simple:
We wanted to make it easier and quicker to start analyzing survey data without spending too much time on data wrangling and preparation.
3. Go Beyond Cross-Tabs with Deeper Survey Analytics
Cross-tabulations and charts are essential for survey analysis.
But they usually lead to more questions.
- Why is satisfaction higher for some people?
- What distinguishes highly engaged employees from less engaged ones?
- Are there different types of respondents with distinct response patterns?
- Are several questions actually measuring the same underlying concept?
- Which combinations of categories are particularly distinctive?
In v16, we significantly expanded the analytics capabilities designed to answer these kinds of questions.
What Drives Higher Satisfaction or Engagement?
Ordinal Logistic Regression
We added Ordinal Logistic Regression for outcomes such as 5-point or 7-point ratings, NPS, etc. that are categorical but have an intended order.
This allows you to analyze questions such as:
Which factors are associated with higher customer satisfaction?
or:
Which aspects of the employee experience are most strongly associated with higher engagement?
Unlike a simple comparison of averages, ordinal logistic regression lets you consider multiple factors simultaneously while respecting the ordered nature of the outcome.
Redesigned Decision Tree Visualization
We also completely redesigned the Decision Tree visualization.
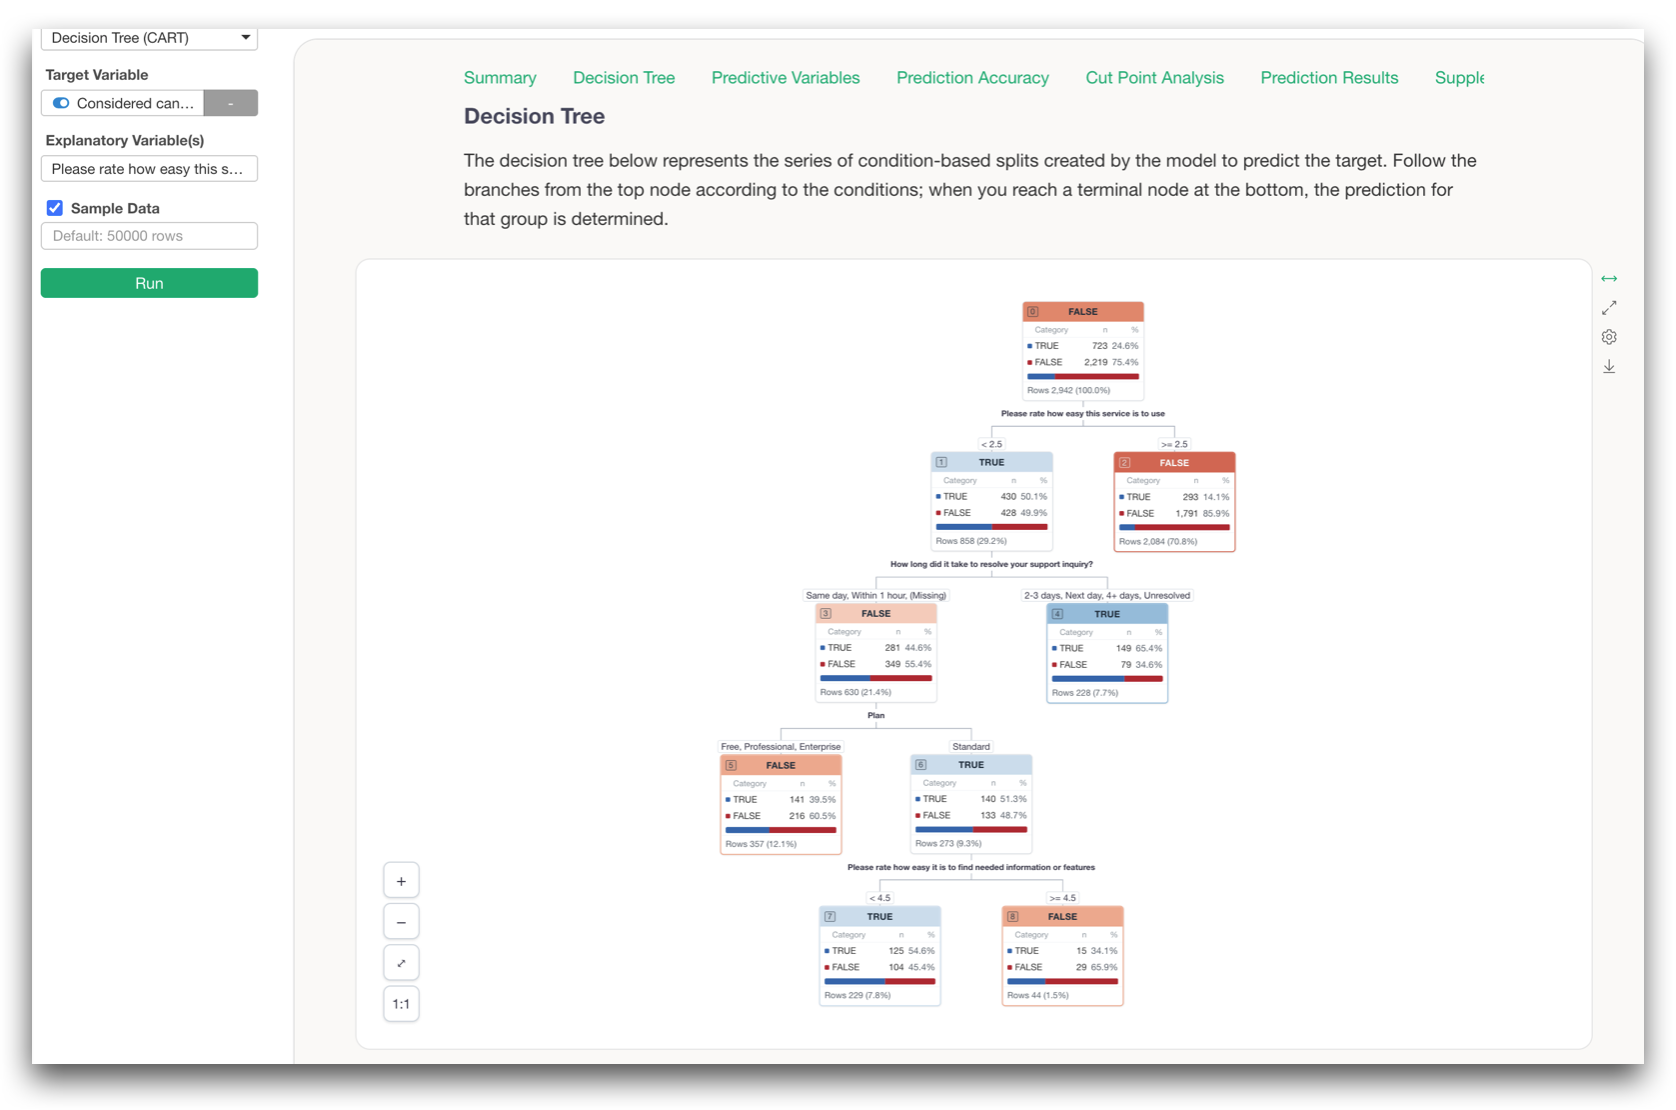
Each node now shows the actual distribution of the data inside it, and you can interactively explore the conditions that define each group.
CHAID Decision Tree
We added another type of decision tree called CHAID, or Chi-squared Automatic Interaction Detection.
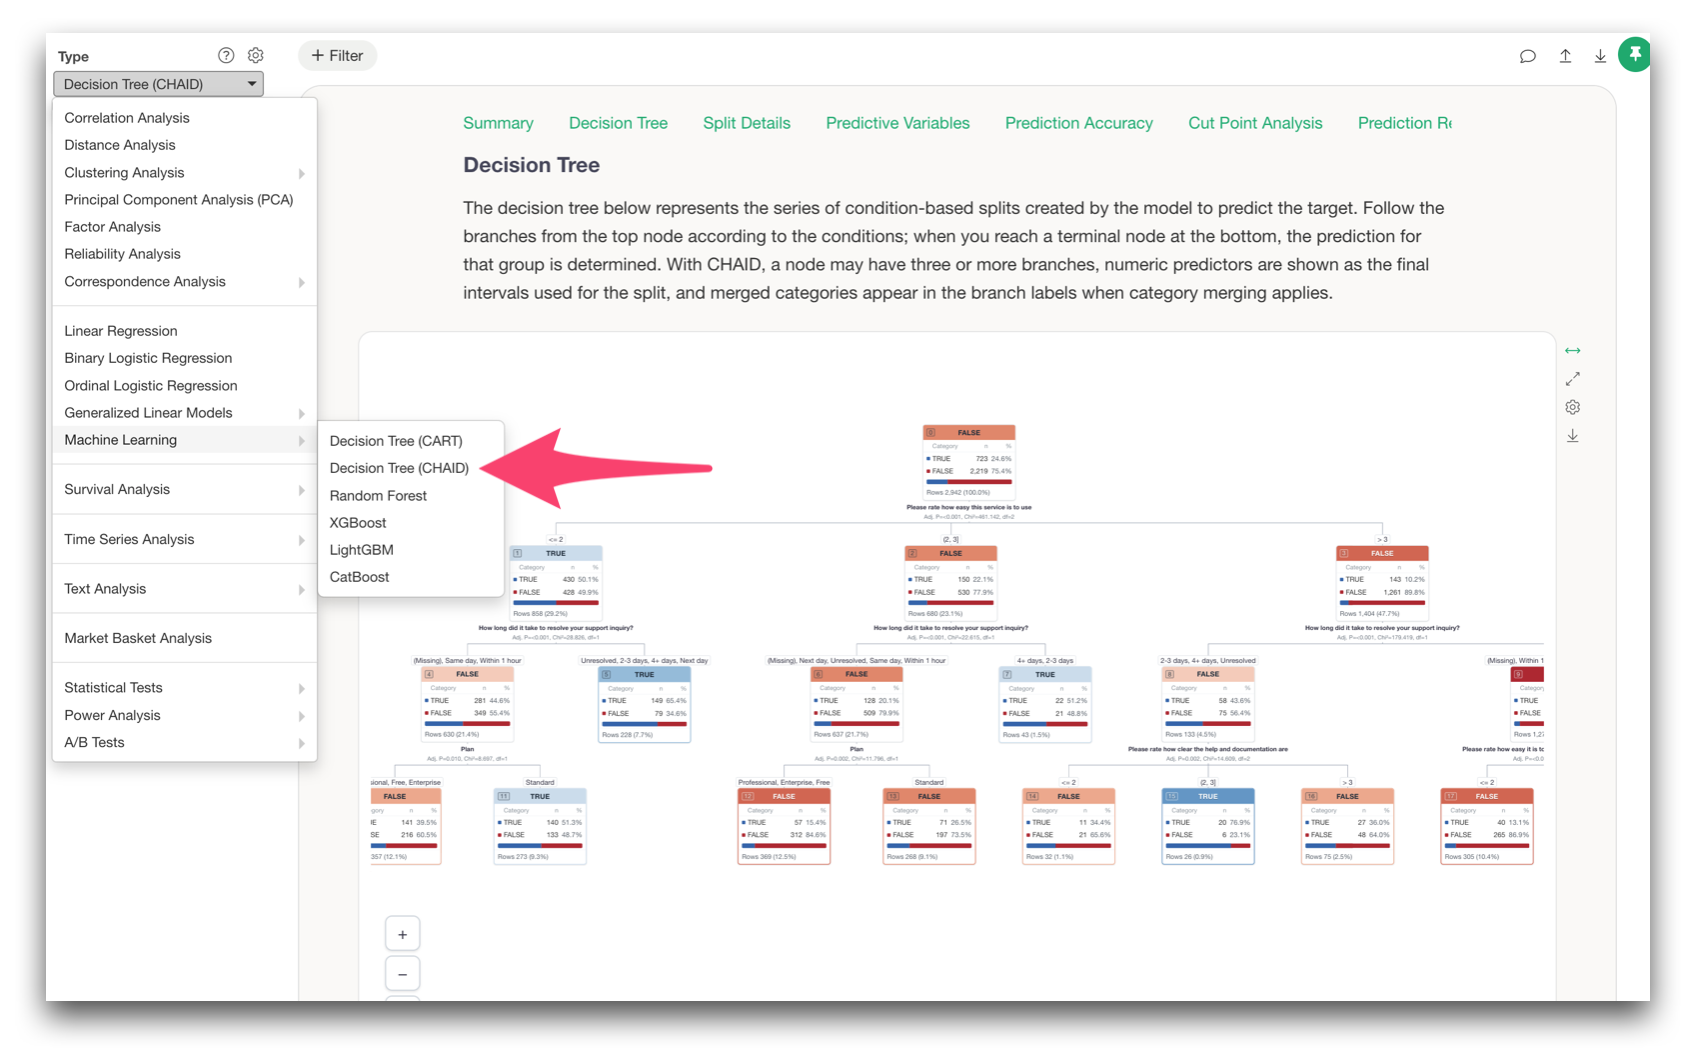
CHAID is particularly useful with categorical survey data because it finds statistically distinctive groups based on relationships among categories.
For example, it can help you explore:
What characterizes customers with high satisfaction?
or:
What combinations of responses are associated with high employee turnover intention?
What Types of Respondents Exist?
We also added two new clustering methods.
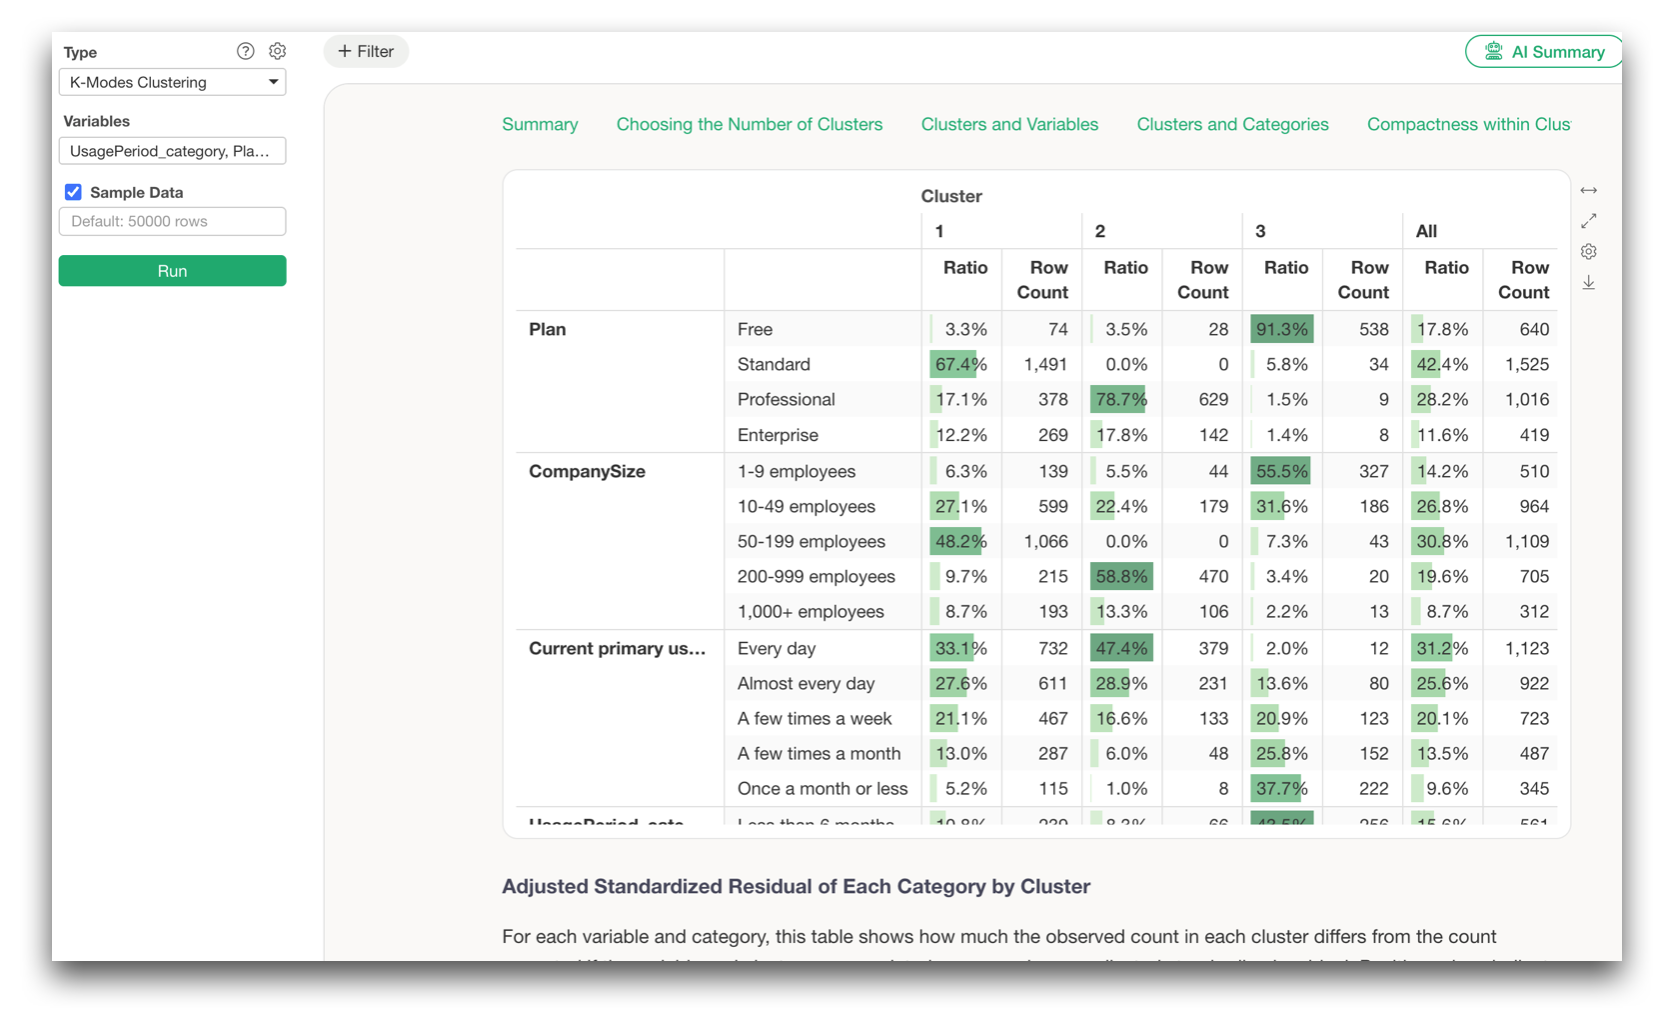
K-Modes Clustering
K-Modes is designed for categorical data, making it possible to segment respondents based on things such as the services they use, products they purchase, information sources they rely on, or other categorical attributes.
K-Medoids Clustering
K-Medoids is particularly useful when working with ordered survey responses such as 5-point satisfaction ratings.
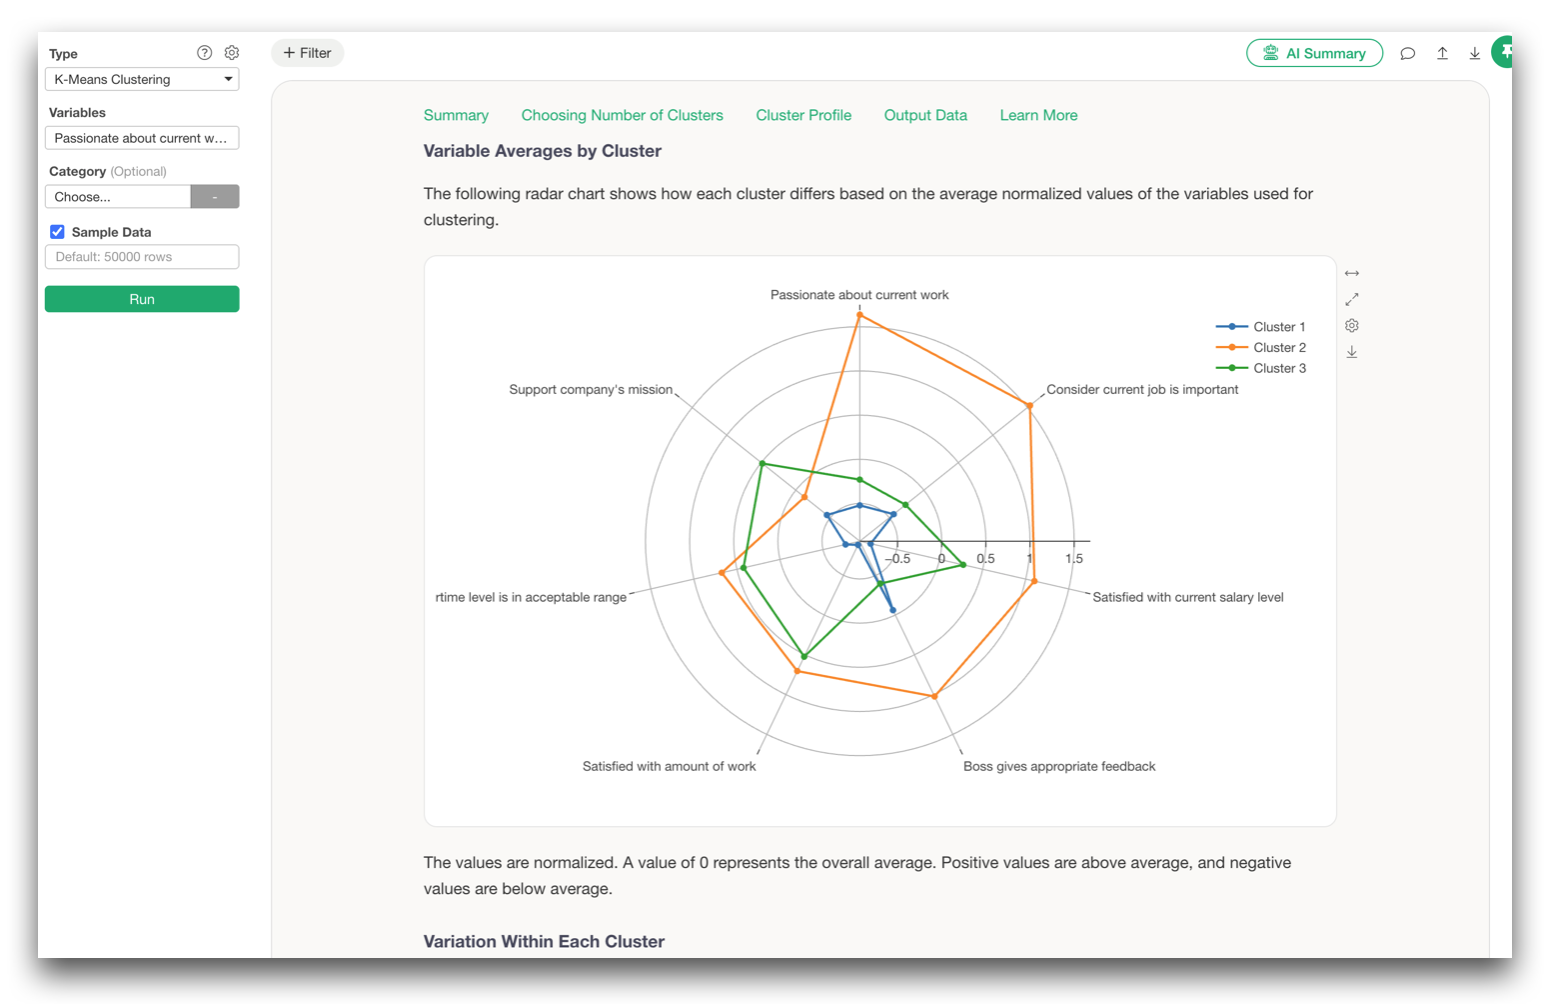
Using a set of survey questions, you might discover groups such as:
- Respondents who are satisfied across most areas
- Respondents who like the product but dislike the price
- Respondents who are particularly unhappy with support
- Respondents with consistently low ratings
Instead of looking only at the average respondent, you can identify distinct response patterns that exist within the data.
What Are All These Questions Really Measuring?
Factor Analysis
We also made major improvements to Factor Analysis.
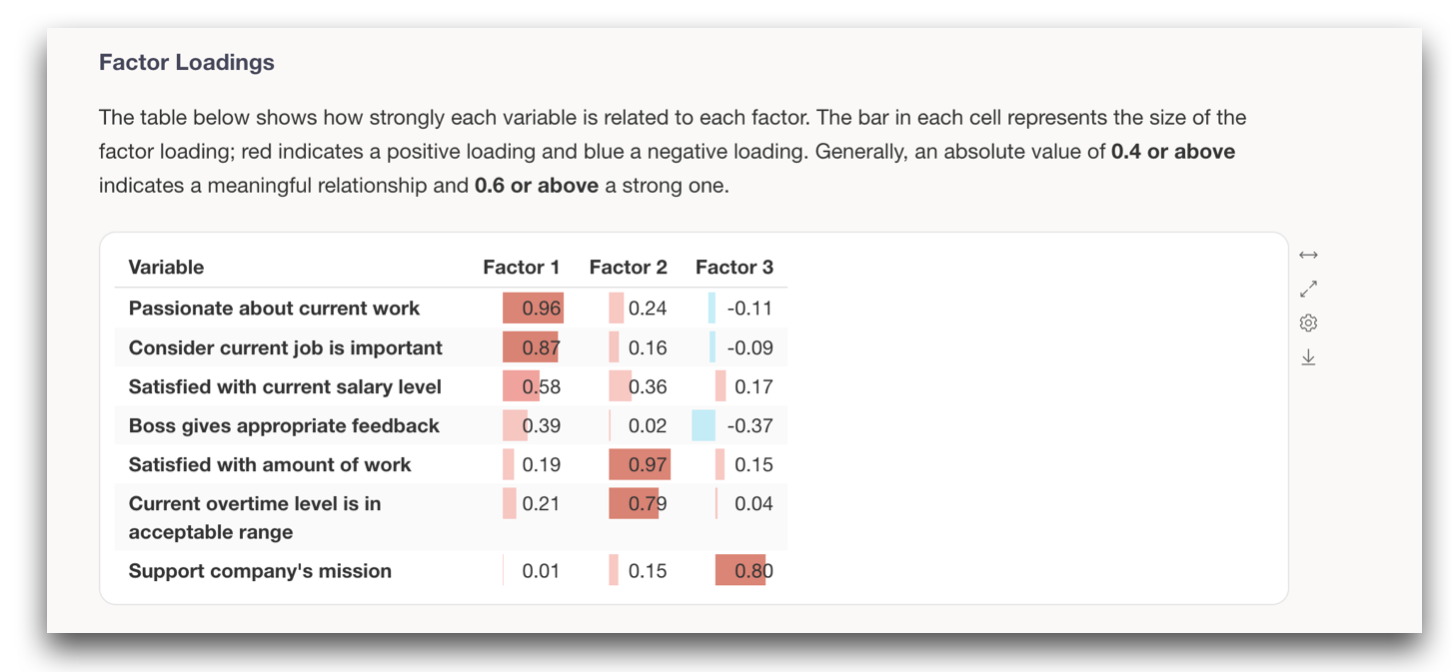
The analytics report has been completely redesigned to make it easier
to evaluate whether factor analysis is appropriate, determine how many
factors to use, and interpret what those factors represent.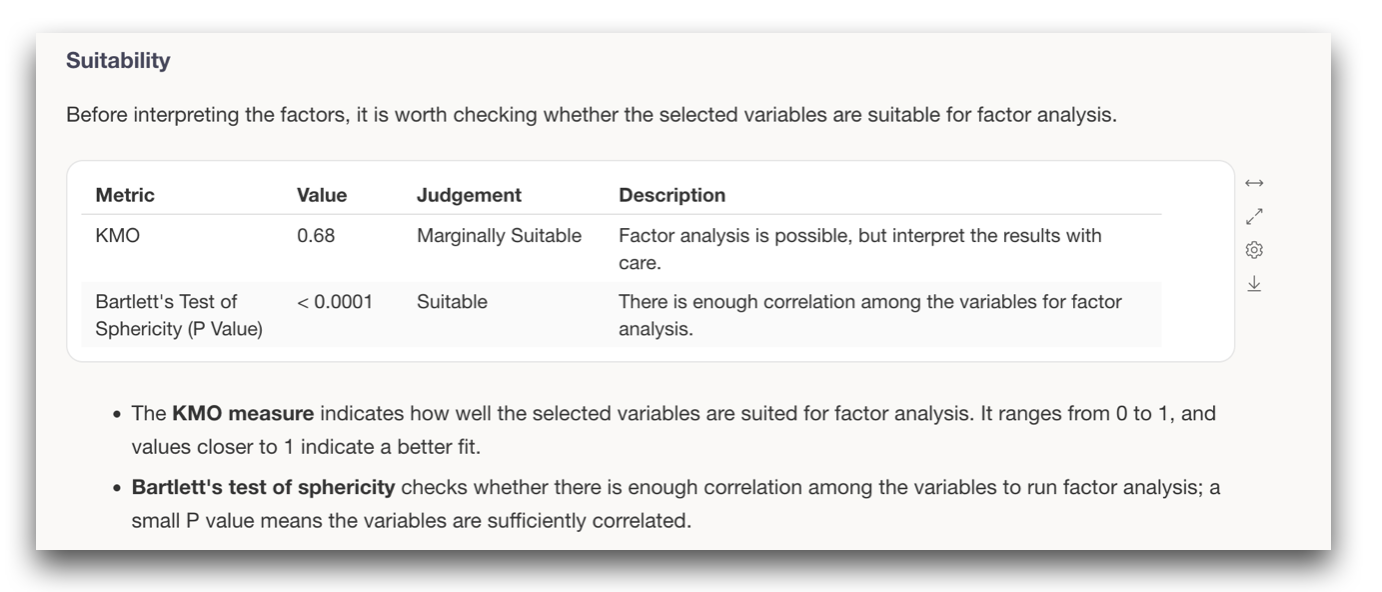
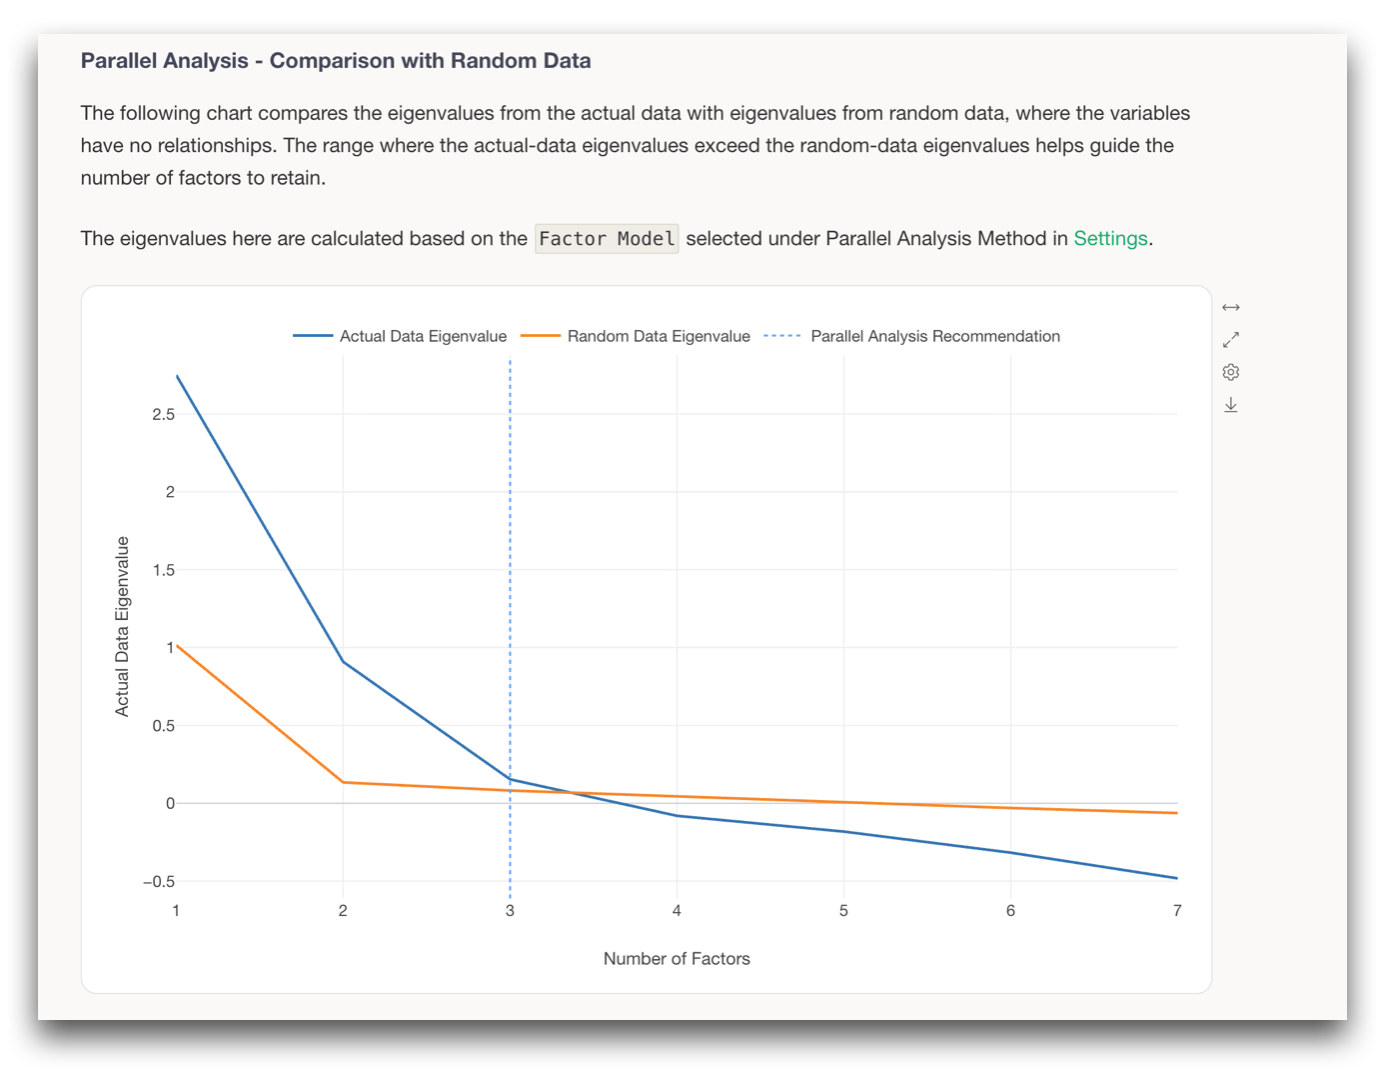
The new report includes information such as KMO, Bartlett’s test, factor loadings, communality and uniqueness, eigenvalues, parallel analysis, and recommendations for the number of factors.
Reliability Analysis with Cronbach’s Alpha
We also added Reliability Analysis using Cronbach’s Alpha.
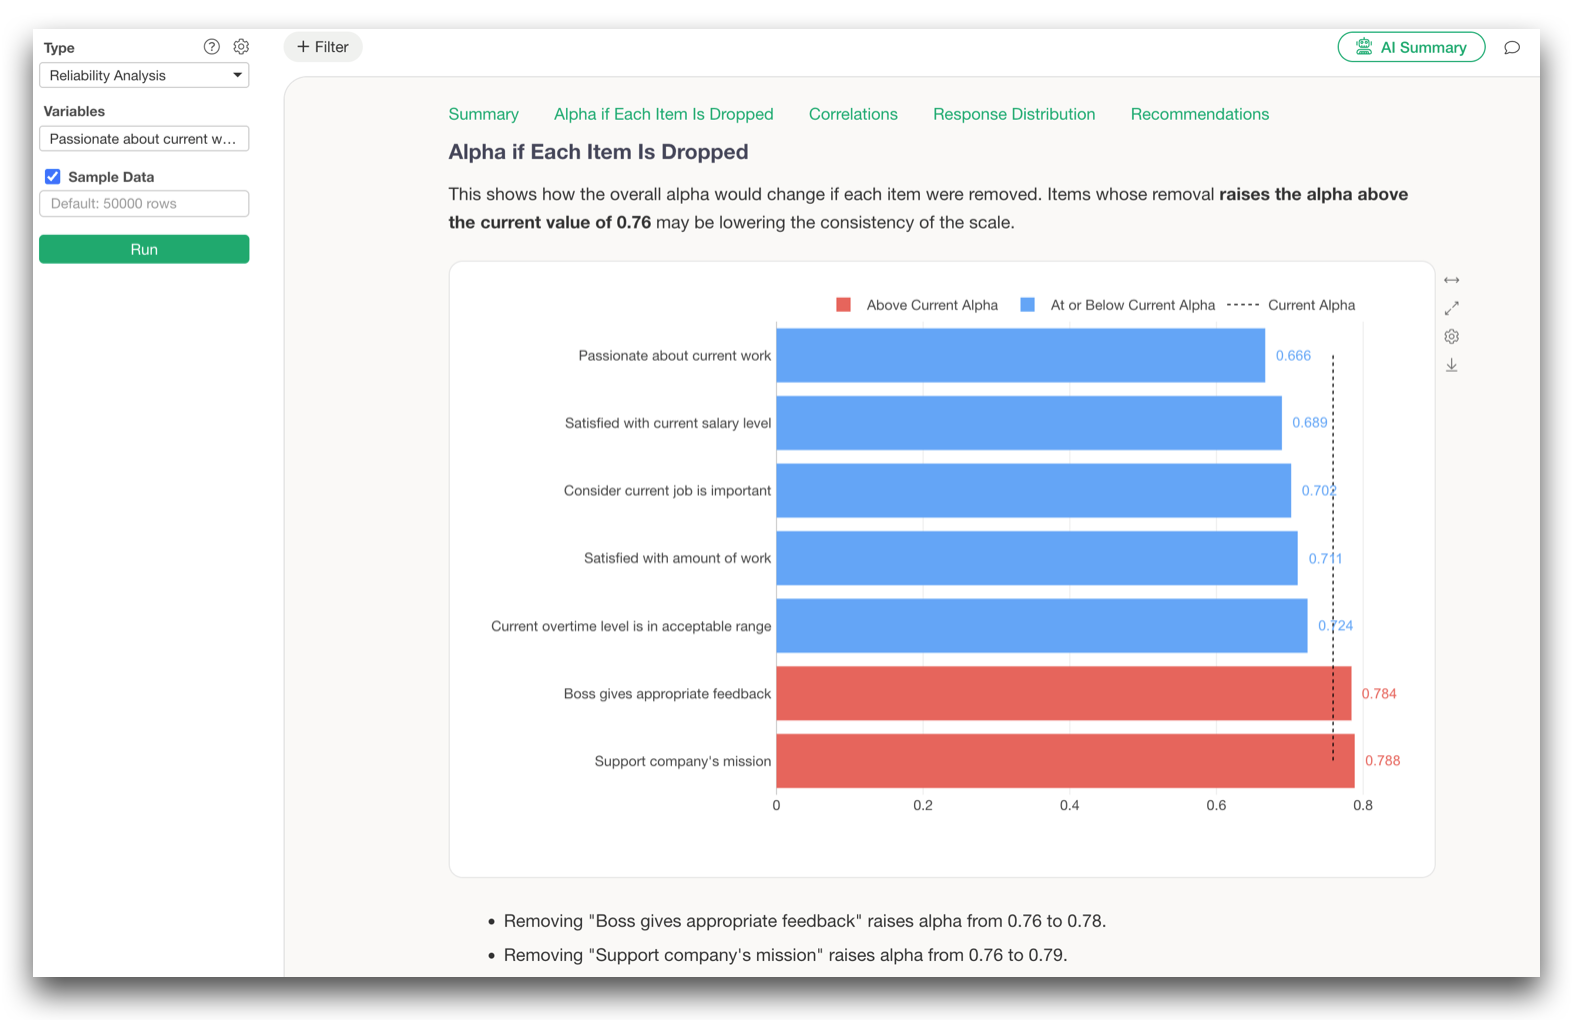
Once you identify a set of questions that appear to measure a common concept, you can evaluate how consistently those questions work together as a scale.
Factor Analysis helps answer:
What underlying concepts are these questions measuring?
Reliability Analysis helps answer:
Do these questions consistently measure that concept?
Treat Ordered Survey Responses as Ordered Data
A 5-point survey response may be stored as 1, 2, 3, 4, and 5, but that does not necessarily mean the distance between every adjacent response level should be treated as exactly equal.
For this reason, v16 adds support for Polychoric Correlation and Mixed Correlation in Correlation Analysis, Factor Analysis, Principal Component Analysis, and Reliability Analysis.
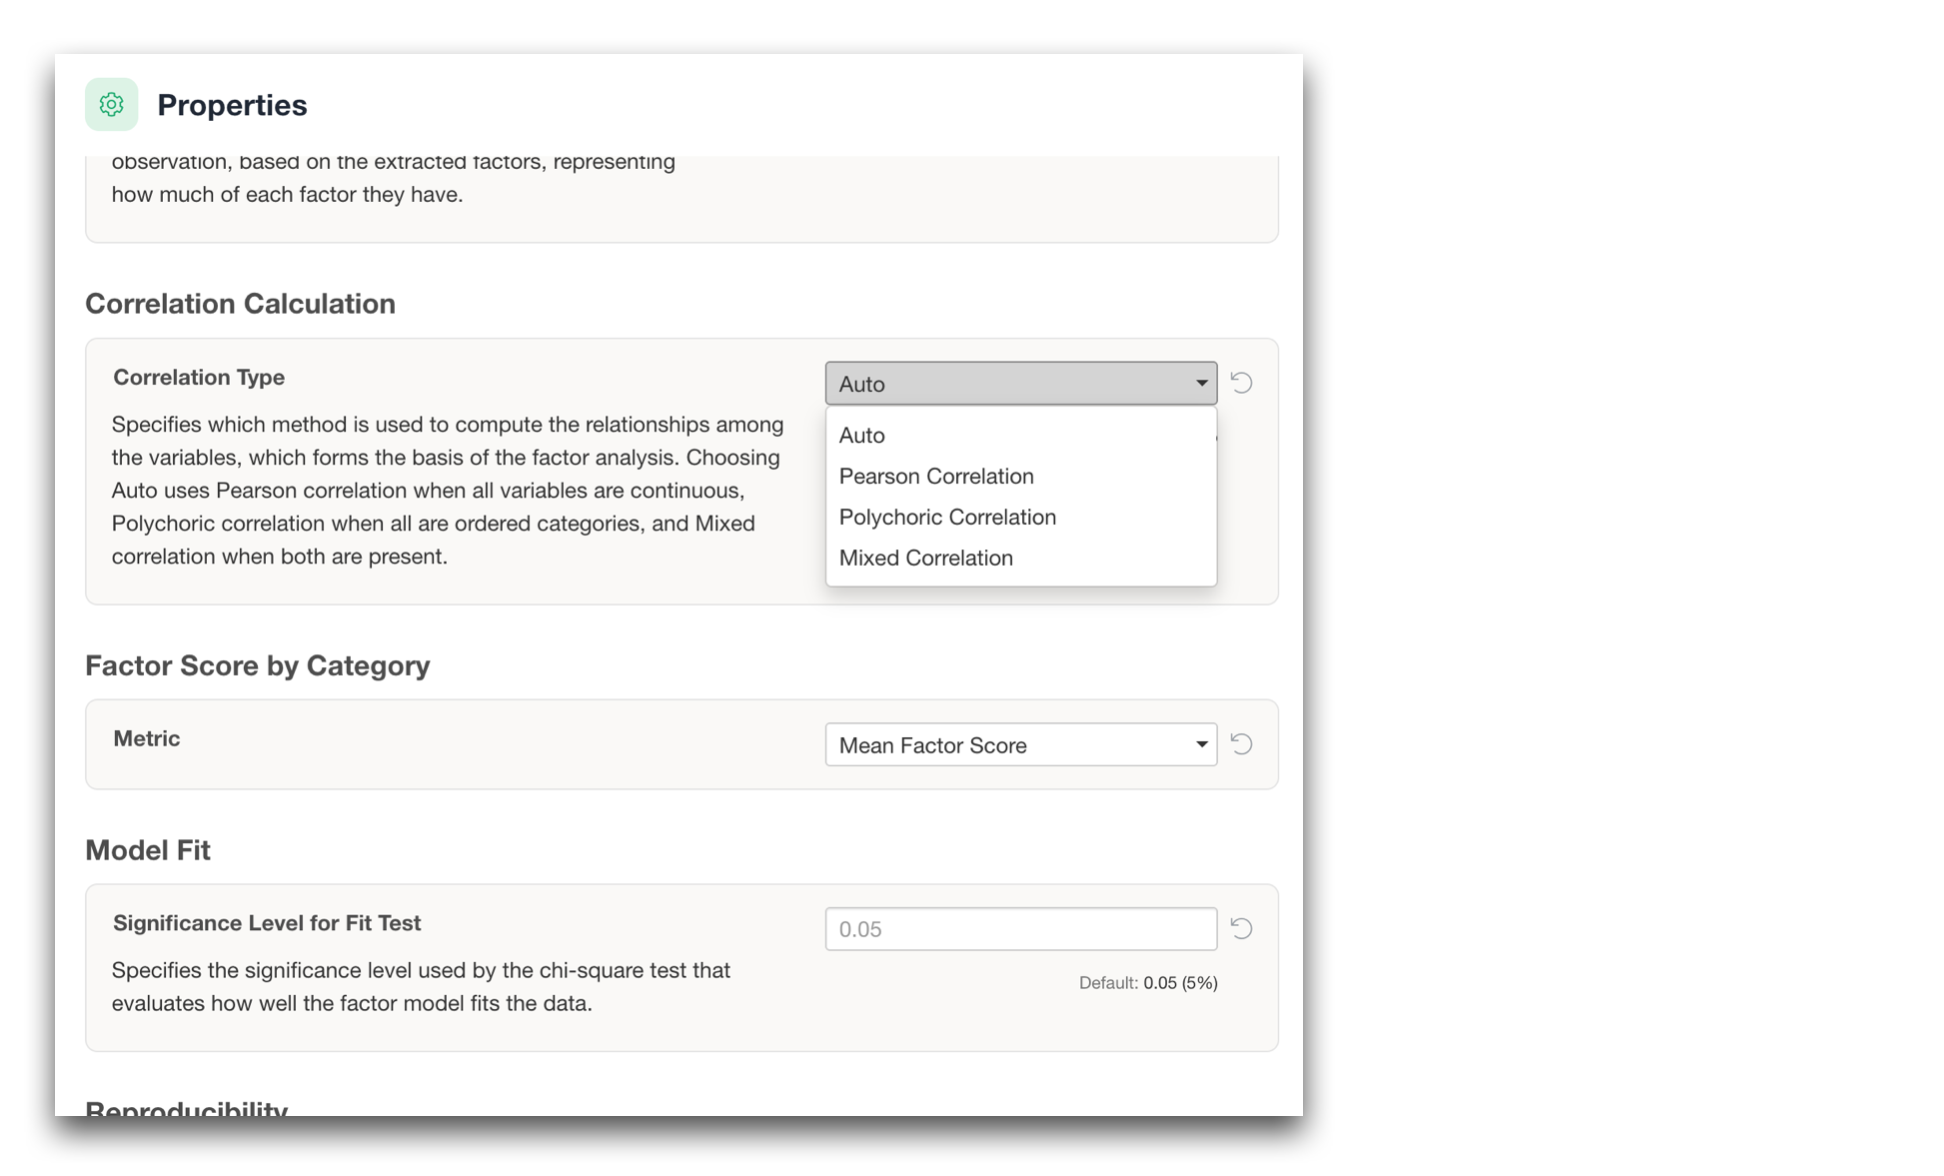
This gives you the option to analyze ordered survey responses according to their ordinal nature rather than automatically treating them as ordinary continuous numerical values.
Principal Component Analysis
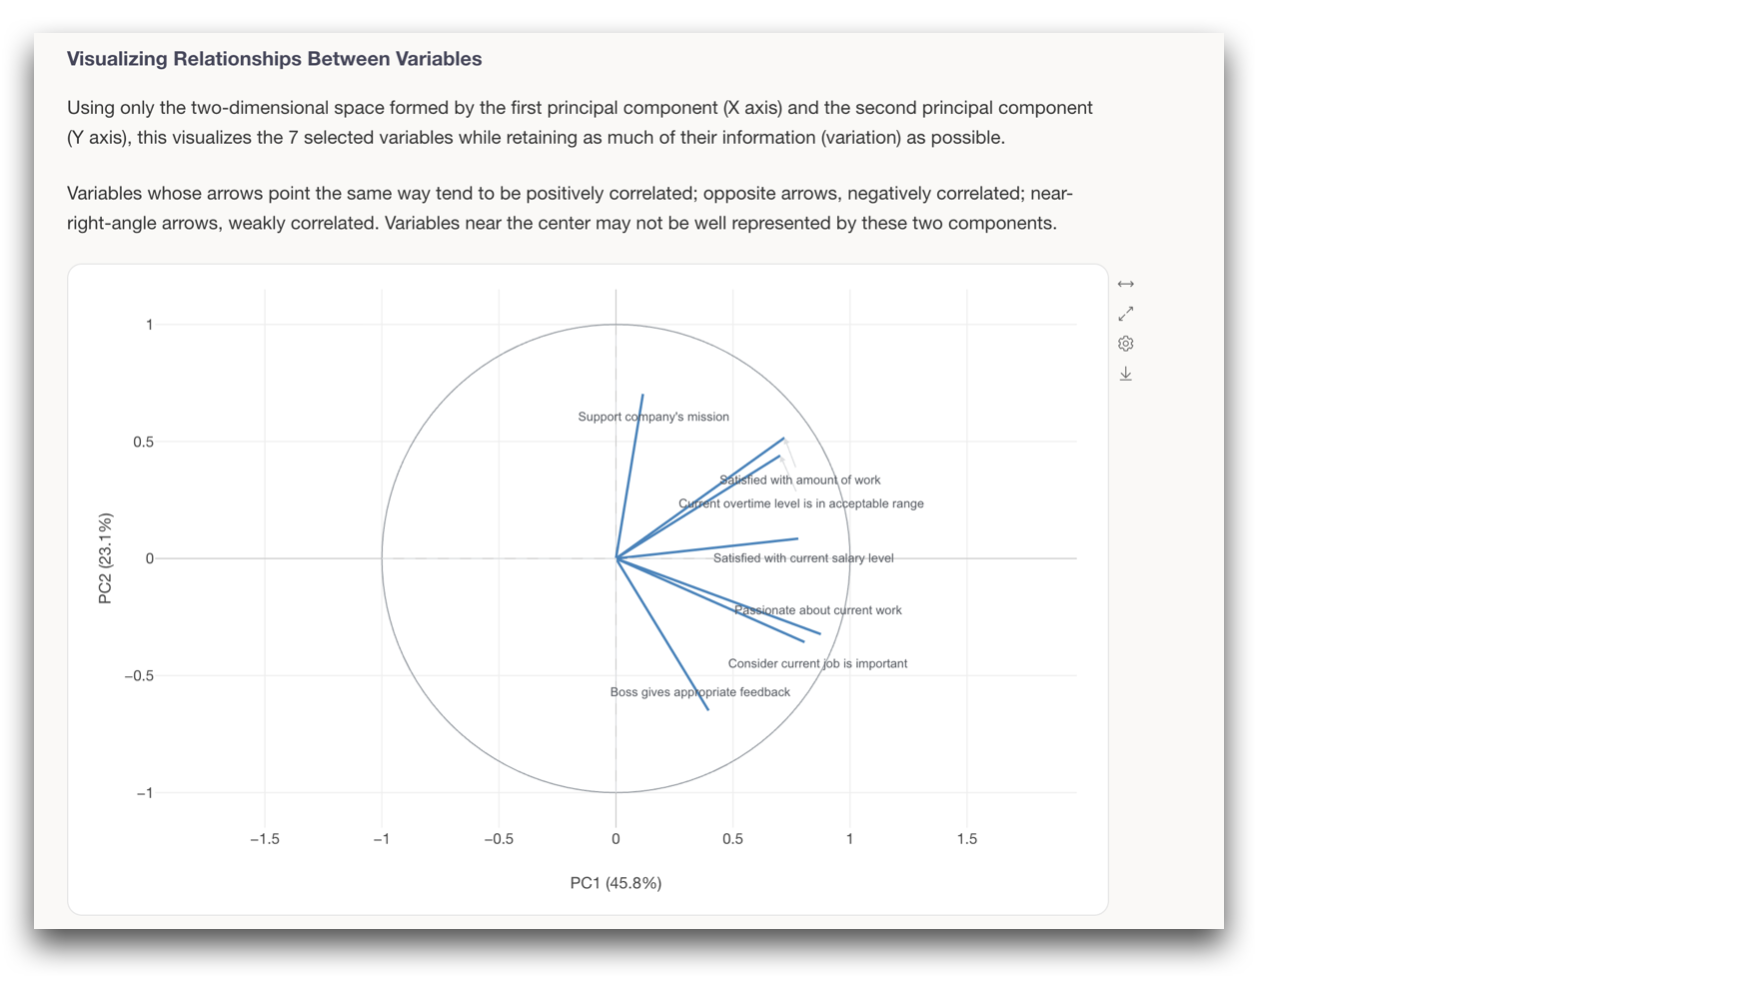
We also improved Principal Component Analysis, including a new correlation circle in the PCA biplot and additional information to make principal components easier to interpret.
Understand Relationships Between Categories
Correspondence Analysis
Finally, we completely redesigned the Correspondence Analysis report.
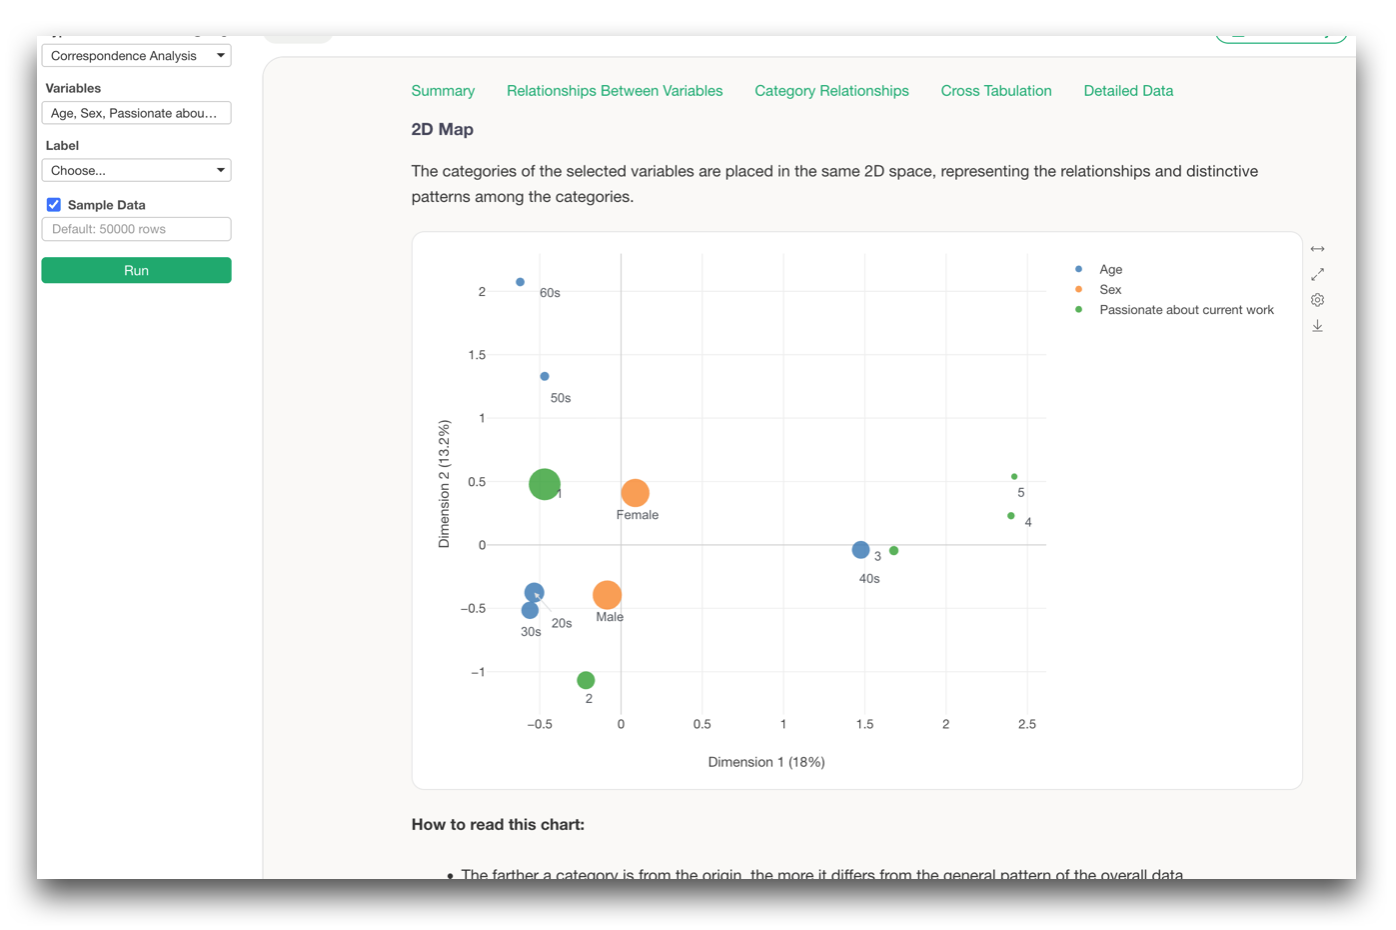
Correspondence Analysis is useful when you want to understand questions such as:
Do different age groups tend to prefer different things?
Which response categories are particularly associated with satisfied customers?
The new report goes beyond simply showing categories on a two-dimensional map.
It now helps you evaluate the strength and statistical significance of the relationships, understand which categories contribute most to the dimensions, and identify category combinations that occur more or less frequently than expected.
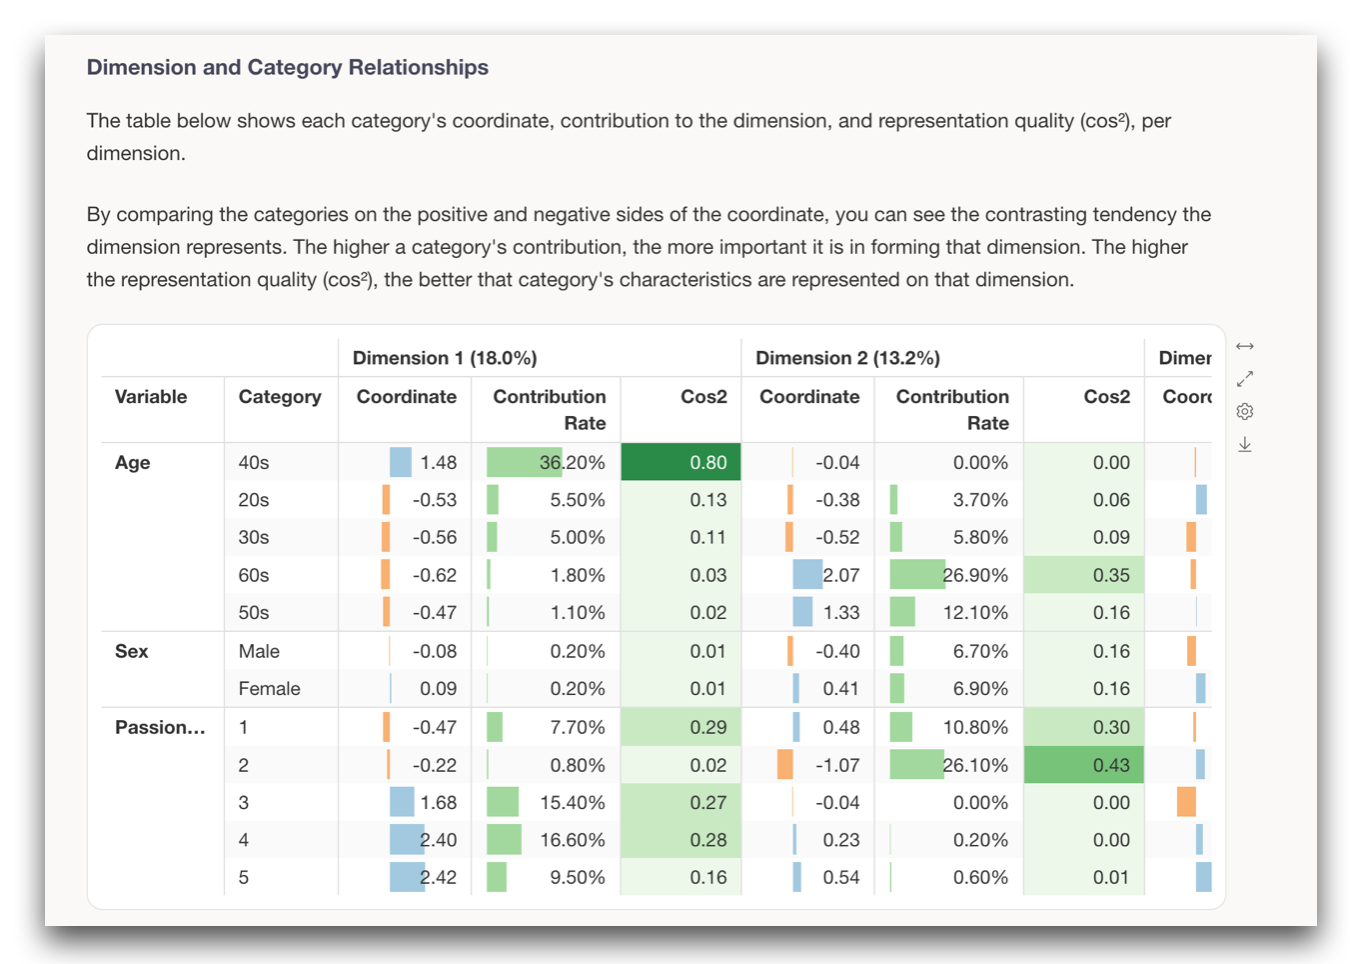
Together, these analytics features make it much easier to move beyond:
“What percentage answered this way?”
and start asking:
“Why?”
“Who?”
and:
“What structure is behind these responses?”
From Data Preparation to Insight
There are many other improvements in Exploratory v16 as well.
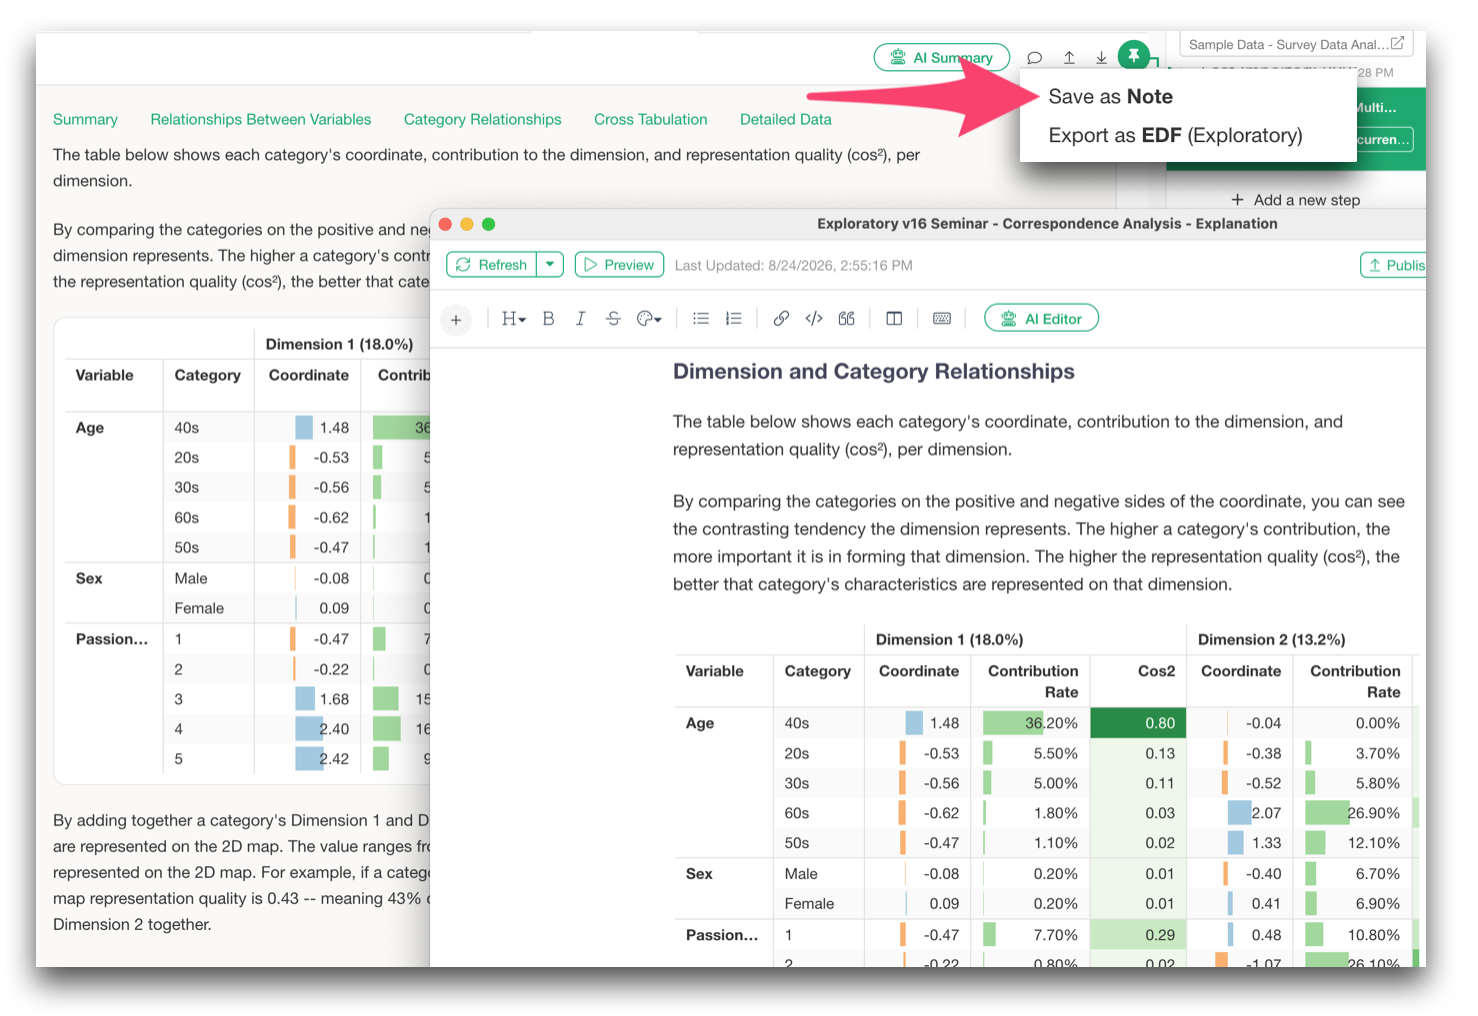
For example, we made it easier to bring Guided Analytics results directly into Notes, insert multiple charts at once, and export reports to Word and PDF.
Take a look at our release note for a full list of enhancements and bug fixes.
But the main story of v16 is a significant improvement on the complete survey-analysis workflow.
- Get the data - Use AI Data to retrieve and prepare complex data by simply describing what you want.
- Prepare and summarize it - Work more directly with ordered categories, multiple-response questions, wide-format survey data, and large numbers of questions.
- Analyze it more deeply - Use Ordinal Logistic Regression, Decision Trees, CHAID, K-Modes, K-Medoids, Factor Analysis, Reliability Analysis, PCA, Correspondence Analysis, and more to understand what is really happening behind the responses.
Survey analysis becomes much more valuable when we can move beyond simply producing another table or chart and start answering questions such as:
- Why is this happening?
- What distinct groups exist in the data?
- What structure is hidden behind all these questions?
And to get to those answers, advanced analytics alone is not enough. We also need to make everything that comes before it, that includes getting the data, preparing it, and summarizing it. And we wanted to make the whole pipeline of work as efficient as possible within Exploratory.
Hence the Exploratory v16 theme:
Analyze survey data more efficiently and more deeply.
Try Exploratory v16
We believe Exploratory v16.0 is an important milestone for democratizing survey data analysis.
Please download the latest version and try it out.
👉 Download Exploratory
https://exploratory.io/download
If you don’t have an account yet, you can start a 30-day free trial here.
👉 Start Free Trial