In the Age of AI, R’s Readability Becomes a Superpower
How readable code enables reliable, reproducible, and interactive data analysis when AI writes the code
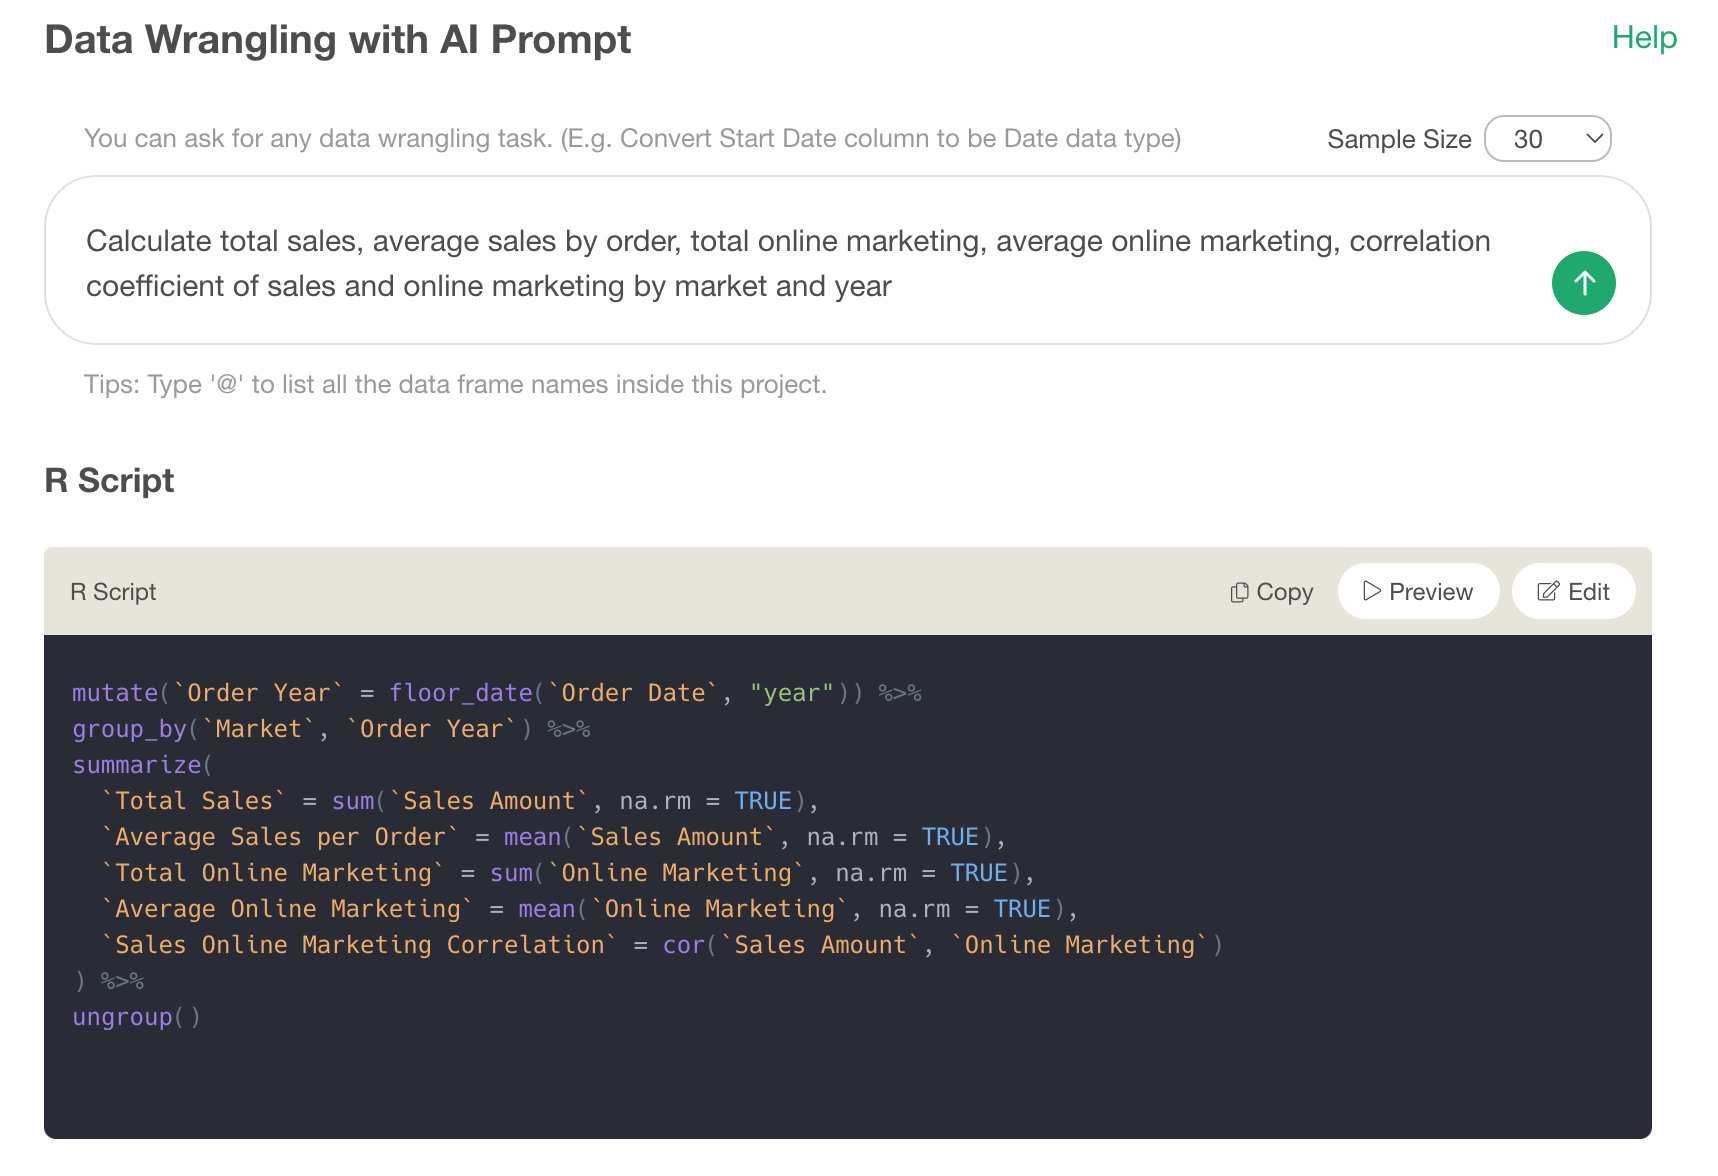
We are entering a new phase of data science.
You don’t write most of the code anymore, but AI does.
At first glance, this feels like a liberation. For years, learning data science meant learning how to code in Python, R, SQL, etc. Now, you can simply describe what you want, and the code gets generated for you.
This makes you wonder…
If AI can generate the code, do we still need to learn programming like R or Python at all for data science?
Well, it depends…
The Real Problem: Answers without Trust
Building Prediction Models vs. Data Analysis
In many areas of machine learning we can evaluate our results against something concrete. There is a ground truth. A label.
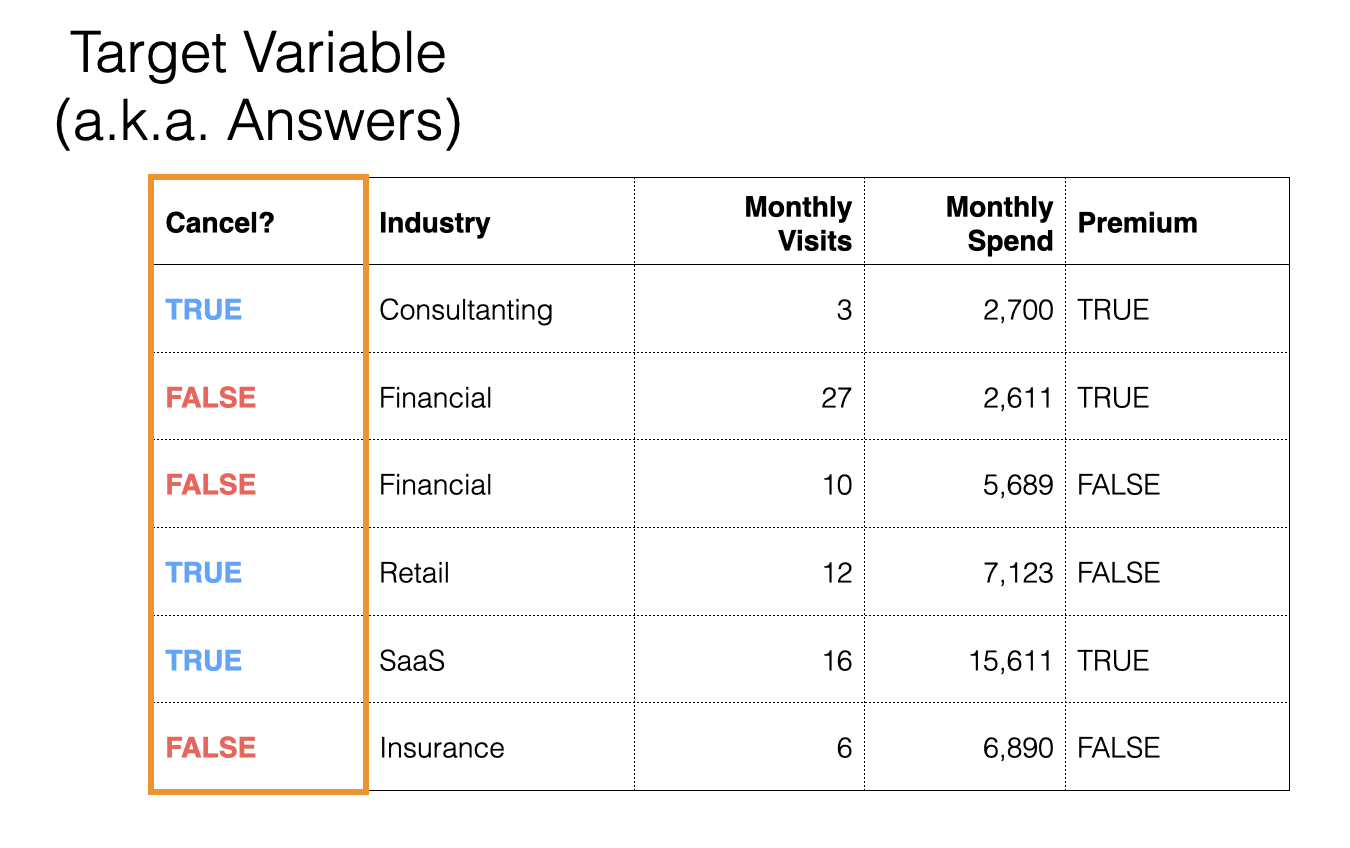
And we can evaluate how well we are doing with a set of well-defined metrics.
For this type of data science, you may never have to look at the underlying code that builds prediction models, so what’s the point of learning how to code? You may ask.
However, when it comes to data analysis side of data science things are very different.
Because, there is no clear pre-defined answer that we can evaluate against at the end.
You are not verifying result against a particular answer, instead you are building an answer. You are exploring data in order to understand something that was previously unknown.
And this makes a difference between generating code for data analysis side of data science and for building prediction models side of data science.
In fact, the real difficulty in data analysis has always been how you build the answers you can trust, not how to write code.
In order to trust the result, you have to have trust in the process that produced the result. You have to be confident that each data transformation such as filter, calculations, aggregation, combine with other data, cleaning text data, etc. is doing exactly what you intended.
Not approximately.
“Close enough” is not enough in data analysis or building metrics or KPIs, it has to be ‘Exact and Accurate’ because people (or even agents!) will make decisions based on the result.
Readability, the Most Important Part of Programming Language
This leads to an uncomfortable but unavoidable truth:
If you cannot read the code, you cannot trust the result.
This is where Readability becomes the most critical feature when you choose programming language for data analysis.
In the context of AI generated code, people often talk about the accuracy of the code, how fast the performance, what is the cost, which AI model to use, etc.
But in the context of data analysis, none of these are as important as Readability.
From Readability to Trust
Before making further discussion, I want to make it clear.
When I say Readability, it is not just about aesthetics or personal preference. It is not about whether code looks “clean” or “elegant.”
It is about whether you can understand what the code is actually doing.
When AI generates code, it is easy to assume that the result is correct. But small details matter. A slightly different grouping, an unintended filter, a silent drop of missing values, any of these can change the outcome in meaningful ways.
If the code is readable, you can pause and inspect it. You can follow the transformation step by step and confirm that it aligns with your intention. The code becomes something you can reason about.
Here’s an example of R code that provides high readability.
sales %>%
   filter(year >= 2020) %>%
   group_by(region) %>%
   summarise(total_sales = sum(sales))
It can be read as:
“Filters data for 2020 or later, and calculate total sales for each group of region.”
It’s readable, and you can understand what it’s trying to do.
If it is not readable, you are left with a different experience. You are not verifying the result, you are just trusting it faithfully. And in data analysis, blind trust is not a viable strategy.
Trust, then, is not something AI gives you.
It is something you build through readability.
From Readability to Reproducibility
But this is only the beginning.
In a business context, data analysis rarely happens only once. Data changes. Questions evolve. The same analysis needs to be run again next week, next month, or with slightly different conditions.
At that point, the question becomes:
“Can you reuse what you already did before?”
If you understand the code, the answer is simple. You run it again. And if needed, you adjust a condition, extend a calculation, etc. The original logic in data transformation and analysis remains intact, and the analysis evolves naturally over time.
If you don’t, it breaks.
You go back to AI. You describe the task again. The AI generates something similar, but may not be identical. Small differences creep in. Over time, you accumulate multiple versions of “the same” analysis that are, in fact, not quite the same.
This is the problem when you don’t have reproducible data analysis pipeline. And if you can’t reproduce you’ll lose trust quickly.
Again, the question is not whether you or AI can write, but it is whether the code, either generated by AI or written by you, is readable enough to be reused with confidence.
From Readability to Interactivity
There is one more dimension, and it is perhaps the most subtle.
Data analysis is not a linear process. It is not a sequence of predefined steps. It is a iterative process, a back-and-forth between you and the data, as if you are having a conversation with data.
You might begin with something simple:
“Show me sales by year.”
But almost immediately, your thinking moves forward.
-> What about monthly trends?
-> What about regional differences?
-> What about repeat customers?
-> Is there a correlation with marketing spend?
Each question generates an answer, which generates a new question, which generates an answer and so on. It’s an iterative process and the center of the process is you as a curious and creative being.
And you want this process to be fast, as fast as the speed of thought.
But when every step requires writing a prompt, waiting for AI to respond, reading the generated code, and then inspecting whether the result is correct, that flow is interrupted. The conversation slows down.
You are no longer exploring, you are coordinating with a tool.
However, something different happens when the code is readable.
You stop relying on prompts for every step. Instead, you begin to adjust the code directly. A grouping changes. A filter is added. A calculation is modified. The feedback loop tightens.
Now, the pace of analysis starts to match the pace of your thinking.
That is what true exploratory data analysis feels like.
It’s interactive and iterative.
The Shift We Often Miss
It is tempting to think that AI reduces the importance of programming.
In reality, it does the opposite.
It shifts the role of programming from writing code to understanding code, at least in a context of data analysis.
And once that shift happens, the most important property of programming language is no longer what it can do.
It is how easily you can read what it does.
Because that is what determines whether you can:
- trust the result
- reproduce the process
- and interact with the data in a meaningful way
And all of that begins in the same place.
Readability.
3 Technical Foundations of R That Enables Readability
If readability is the key to trust, reproducibility, and interactivity, then the next question is:
Which data science language provides high readability?
And the short answer answer is R.
R provides by far the most readable code. When I say R, I don’t necessary mean the base R, but R with ‘tidyverse’, which is a set of packages that most of the modern R practitioners use.
R’s tidyverse code resembles the description of the data operation in English as we have seen above.
sales %>%
   filter(year >= 2020) %>%
   group_by(region) %>%
   summarise(total_sales = sum(sales))
But, the tidyverse didn’t become highly readable by itself. It was R’s unique foundation that enables it.
Clause Wilke has articulated this so well in his blog post when he talks about why R is better than Python.
And among many reasons listed in the post, I think the following 3 characteristics of R are especially important for enabling R to be highly readable.
- Separation of Logic vs Logistics
- Built-in Vectorization
- Support for Non-Standard Evaluation (NSE)
These three work together to determine whether code feels like a clear expression of thought or a set of instructions for a machine.
In order to highlight these unique features, as Clause does in his blog post, I’m going to compare R against Python. Python is often used by most of the AI models when you ask data science / analysis related questions without specifying your preference of language.
1. Separation of Logic vs Logistics
Every piece of data analysis code contains two layers:
- Logic → What you want to do
- Logistics → How the computer executes it
For example:
“Calculate total sales by region for 2020 and after”
This is logic.
But implementing it may involve:
- loops
- indexing
- temporary variables
- restructuring outputs
This is logistics.
Example with R (Tidyverse)
Now, here is how you write in order to achieve the above with R (tidyverse).
sales %>%
   filter(year >= 2020) %>%
   group_by(region) %>%
   summarise(total_sales = sum(sales))
This is almost a direct translation of the question:
- filter year >= 2020
- group by region
- summarize total sales
You see only the logic, almost no visible logistics
Example with Python (Panda)
Now, here is an example code with Python with Panda library to do the same.
sales[sales['year'] >= 2020] \
    .groupby('region') \
    .agg(total_sales=('sales', 'sum')) \
    .reset_index()
Still readable, but notice the logistics creeping in:
sales['year']→ how to access columnagg(...)→ syntax detail('sales', 'sum')→ implementation detail.reset_index()→ structural fix
These are not part of the question. They are part of the machinery.
If AI decided to write Python code without the panda library, this is how it would look like. You can see the true nature of Python:
result = {}

for row in sales:
    if row['year'] >= 2020:
       region = row['region']
       if region not in result:
           result[region] = 0
       result[region] += row['sales']
Now we are fully in logistics mode:
- Manual loop
- Dictionary initialization
- Key checks
- Accumulation logic
This code does the same as the above R example, but it forces you to think like a machine.
Why This Difference Exists
This difference is not accidental. It comes from the design philosophy of the languages.
R (tidyverse) is designed for expressing intent. It uses data-centric grammar (verbs like filter, mutate, summarize, etc.) And this is only possible because the following features of R, which I’m going to talk about in the next sections.
- Built around vectorized operations
- Supports non-standard evaluation (NSE)
On the other hand, Python is designed for general-purpose
programming. It’s built around objects and structures,
and it requires explicit references like (df['column']).
It lacks native data-manipulation grammar. And even with a library like pandas, Python still carries its general-purpose DNA.
When logistics dominates,
- Code becomes harder to read
- Verification becomes harder
- Modification becomes slower
In R code, logic dominates. And this makes R code closer to human thinking.
2. Built-in Vectorization
Now let’s go one level deeper.
Even if you separate logic from logistics, you still need a way to apply that logic to data.
This is where vectorization comes in.
With vectorization, you can apply an operation to an entire column at once, instead of looping row by row.
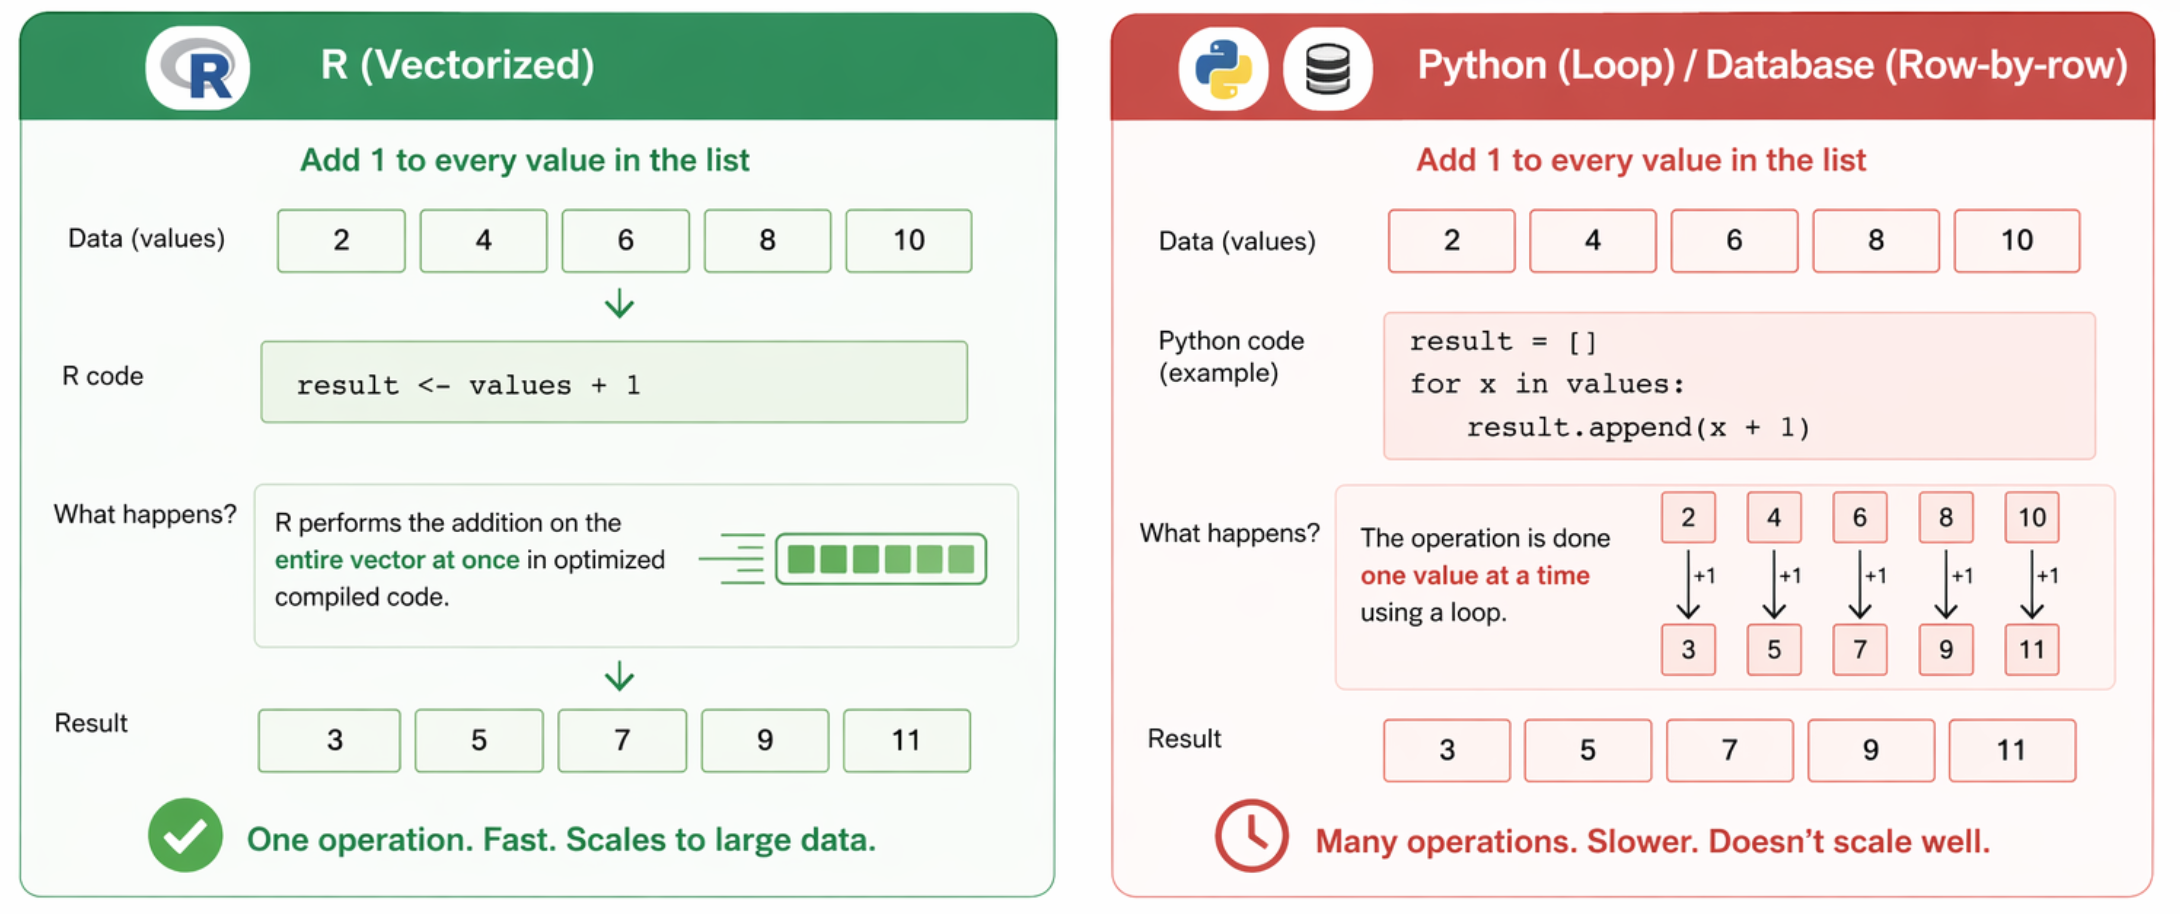
Let’s say you want to make a simple calculation like “multiple sales by 1.1”.
With R, you can write something like this.
sales * 1.1This applies to all values in the sales column (or variable).
No loop. No special function. Just the logic.
But in Python, you must iterate explicitly.
[s * 1.1 for s in sales]With the pandas or the NumPy library it could be close to R.
df['sales'] * 1.1In Python, vectorization is not part of the language itself unlike R. Instead, it is outsourced to libraries. Therefore, you need to deal with the difference among the libraries:
- Python lists → not vectorized
- NumPy arrays → vectorized
- pandas Series → vectorized (differently)
- Polars Series → vectorized (again differently)
Each has:
- different APIs
- different behaviors
- different edge cases
So you end up writing with the numpy package:
import numpy as np

sales = np.array(sales)
sales * 1.1
Or, with the panda package:
pd.Series(sales) * 1.1And this gets worse when you want to calculate conditionally.
Let’s say if you want to calculate something like this.
“If sales > 100, apply 10% discount”
In the case of R, it’s pretty simple.
ifelse(sales > 100, sales * 0.9, sales)You have the following three.
- condition
- calculation
- fallback
But in the case of Python, it becomes convoluted.
[s * 0.9 if s > 100 else s for s in sales]Now:
- explicit iteration
- inline conditional logic
- more cognitive load
Even with pandas package,
df['sales'] = np.where(df['sales'] > 100, df['sales'] * 0.9, df['sales'])It’s better, but still:
- referencing columns repeatedly
- using external function (
np.where) - mixing libraries (pandas + NumPy)
Why this matters
Vectorization is not just about performance. It’s about thinking at the right level of abstraction.
When vectorization is built into the language:
- You think in columns and transformations
When it is not:
- You fall back to rows and loops
3. Non-Standard Evaluation (NSE)
Now we reach the most important layer.
Even if you can think in logic and can operate on vectors, you still need a way to express your idea naturally.
This is where NSE (Non-Standard Evaluation) comes in.
What is Non-Standard Evaluation?
NSE (Non-Standard Evaluation) means that you can write code that looks like you are directly operating on the data, even though the data lives inside a data frame.
In simpler terms, you can refer to columns as if they were normal variables.
R has NSE support, so you can specify the column (variable) names in functions like this.
df %>%
  mutate(profit = sales - cost)
You can read this code literary as:
- profit equals sales minus cost
No quotes, no indexing, and no function around the column name. You simply type column names as if you write in a report.
On the other hand, Python doesn’t have NSE, hence the column (variable) needs to be specified as below.
df['profit'] = df['sales'] - df['cost']Notice that
- Columns must be accessed as strings (
'sales') - Repeated
df[...]
This may seem small, but it becomes worse as we expand.
Example 1: Grouping and Summarizing
Let’s say you want to:
“Group by region, calculate average sales”
In R, you will write like the below.
df %>%
  group_by(region) %>%
  summarise(avg_sales = mean(sales))
This can be easily read as ‘group by region, calculate average sales’.
But with Python, you will need to write like this.
df.groupby('region')['sales'].mean().reset_index(name='avg_sales')'region','sales'→ string references- chaining syntax tied to structure
.reset_index()→ logistics
This is when non-programmers start losing it.
And it gets even worse.
Example 2: Sorting based on Calculation
Let’s push further. If you want to do something like:
“Sort by cosine of sales”
With R, it’s pretty simple.
df %>%
  arrange(cos(sales))
With Python, not so much.
import numpy as np

df.assign(
    cos_sales=lambda d: np.cos(d['sales'])
).sort_values('cos_sales') \
 .drop(columns=['cos_sales'])
Now we see:
- temporary column
- lambda function
- repeated references
- cleanup step
We’re not comparing the capability between R and Python. Both codes can do the same job. But which one would you be more comfortable when you are accountable for the produced result?
NSE turns code into a language for expressing ideas, rather than constructing the computational instruction.
Bringing It All Together
These three principles are not independent. They reinforce each other.
When all three are present,
- You express logic, not logistics
- You operate on data as a whole
- You write expressions, not instructions
The result is the code that reads like the question you are asking.
The Shift in the AI Era
In the past, programming was about writing code. And because humans wrote that code, readability mattered, primarily as a matter of maintainability and collaboration.
But today, we live in a different time.
AI writes a significant portion of the code we use, and that changes the role of the human entirely.
You are no longer the author or even the maintainer of the code. You are the reviewer of it.
You didn’t write it. You didn’t think through each line as it was constructed. And yet, you are responsible for deciding whether the result produced by the code is correct.
That responsibility cannot be delegated to AI or others.
And this is where the hierarchy of importance flips.
Readability is no longer a “nice-to-have.” It becomes the foundation upon which everything else depends.
Because only when code is readable can you:
- verify its correctness
- trust the result
- reuse the logic
- and modify it to satisfy ever evolving questions you have.
Reliability, reproducibility, and interactivity are not separate concerns.
They are all downstream of one thing.
That’s Readability.
Pick the Language That Gives You Readability
If your goal is to work effectively with AI-generated code, you need a language where:
- the code reflects the logic directly
- transformations are easy to follow
- small changes can be made without friction
This is where R, especially with the tidyverse, stands out.
Not because it can do something others cannot.
But because it expresses ideas in a way that is intuitively understandable.
When AI generates R code, what you see is not machinery, you see intent.
And that makes all the difference.
Why This Matters for Exploratory
By the way, this perspective is not something we arrived at recently.
It is, in fact, the original reason we built Exploratory in the first place.
About 10 years ago, when we started Exploratory, we made a deliberate decision: build UI on top of R and the tidyverse.
At the time, this was not the most obvious choice to many. But we believed something that, in hindsight, has only become more true over time.
Data analysis is not just about capability.
It is about how easily humans can understand and work with that capability.
We saw that the R & dplyr (a part of tidyverse) offered something unique.
Not just a set of powerful functions, but a way of expressing data transformations that was readable, consistent, and aligned with how we think. That readability, combined with flexibility, made it ideal for exploratory data analysis.
So we built an UI experience on top of it.
The goal was simple: to make the power of R accessible to non-technical users without a need of writing code.
That was the beginning of Exploratory.
What is the bottleneck for data analysis today?
10 years later, things have changed dramatically.
It is now 2026, and we are deep in the era of AI and LLM (large language models). Writing code is no longer the hard part. AI can write R, Python, SQL - almost instantly and entirely.
And this begs a question.
If writing code is no longer the bottleneck, then what is?
We started asking our customers,
What is the bottleneck for data analysis today in the era of AI?
And the answers were surprisingly consistent.
The bottlenecks were:
Reliability and Reproducibility.
This brings us back to the core idea of this post.
If reliability and reproducibility are the problems, then how can we solve?
And the answer, as we’ve seen, is readability that is supported by the right interface - AI prompt and UI.
This is where Exploratory fits in, especially in the AI era.
Data Analysis in Exploratory
In Exploratory, you can type in how you want to transform and prepare data in the prompt UI, then AI generates R (tidyverse) code. Not as something hidden behind the scenes, but as something you can see, read, and understand.
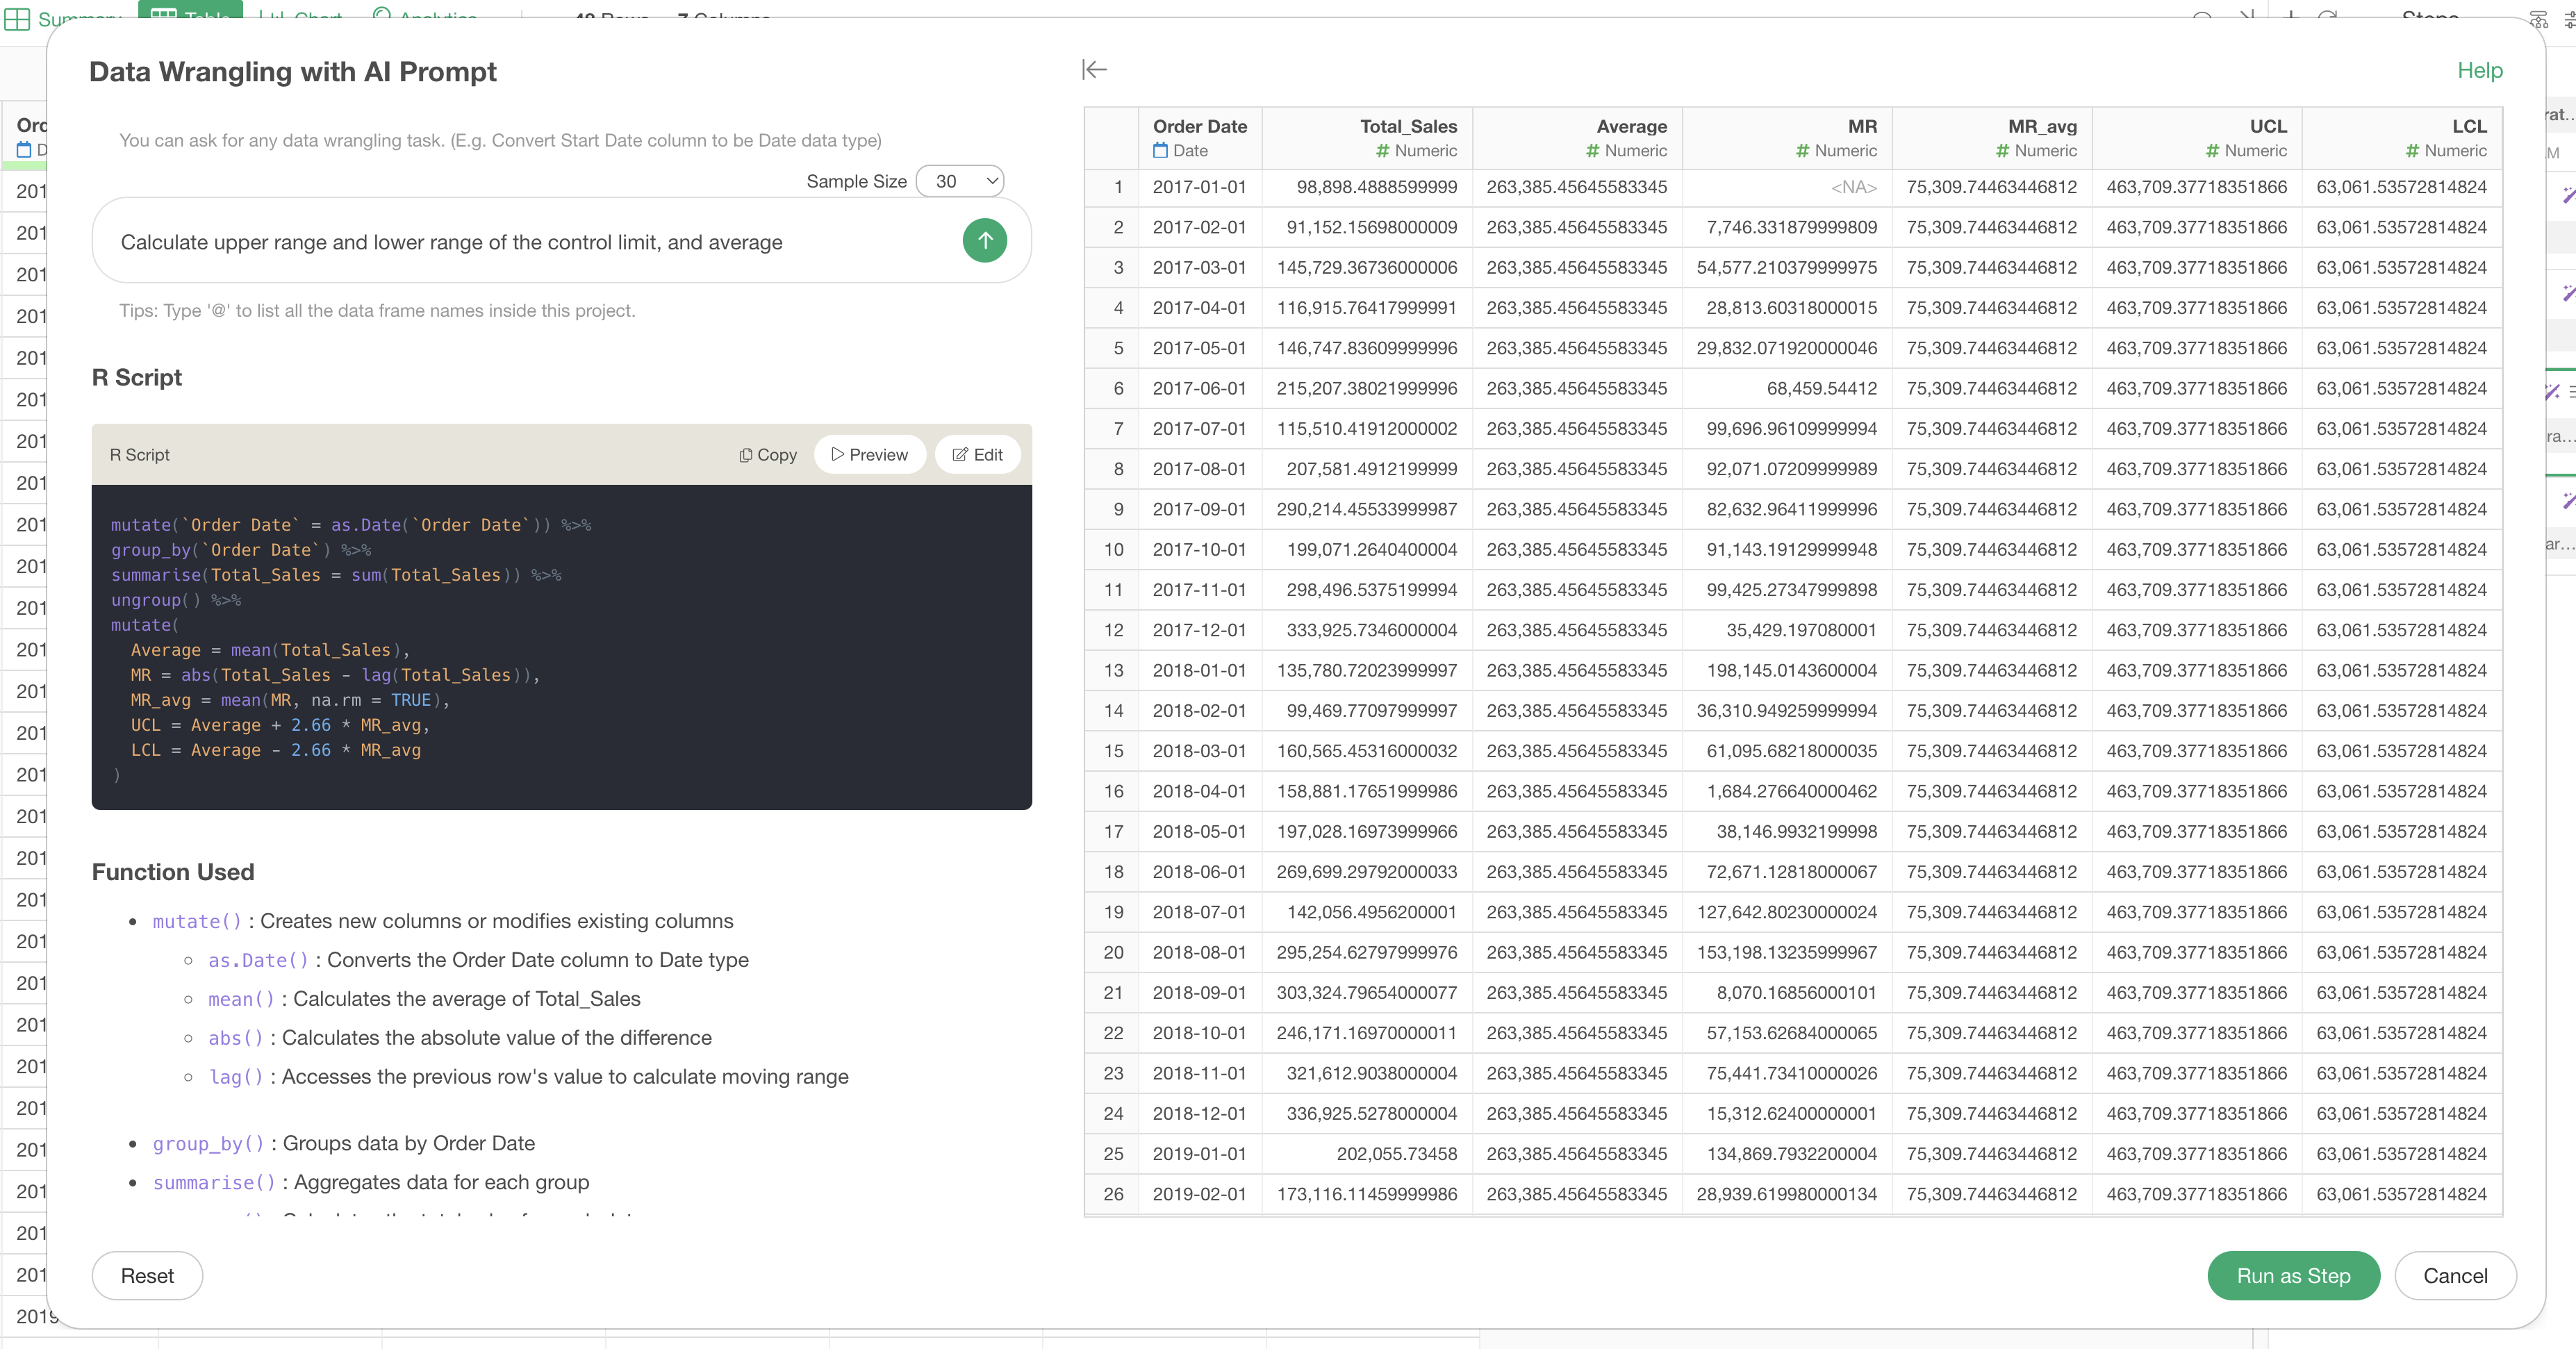
You can read the code with a help of the code description to see what it does and what you can expect from it.
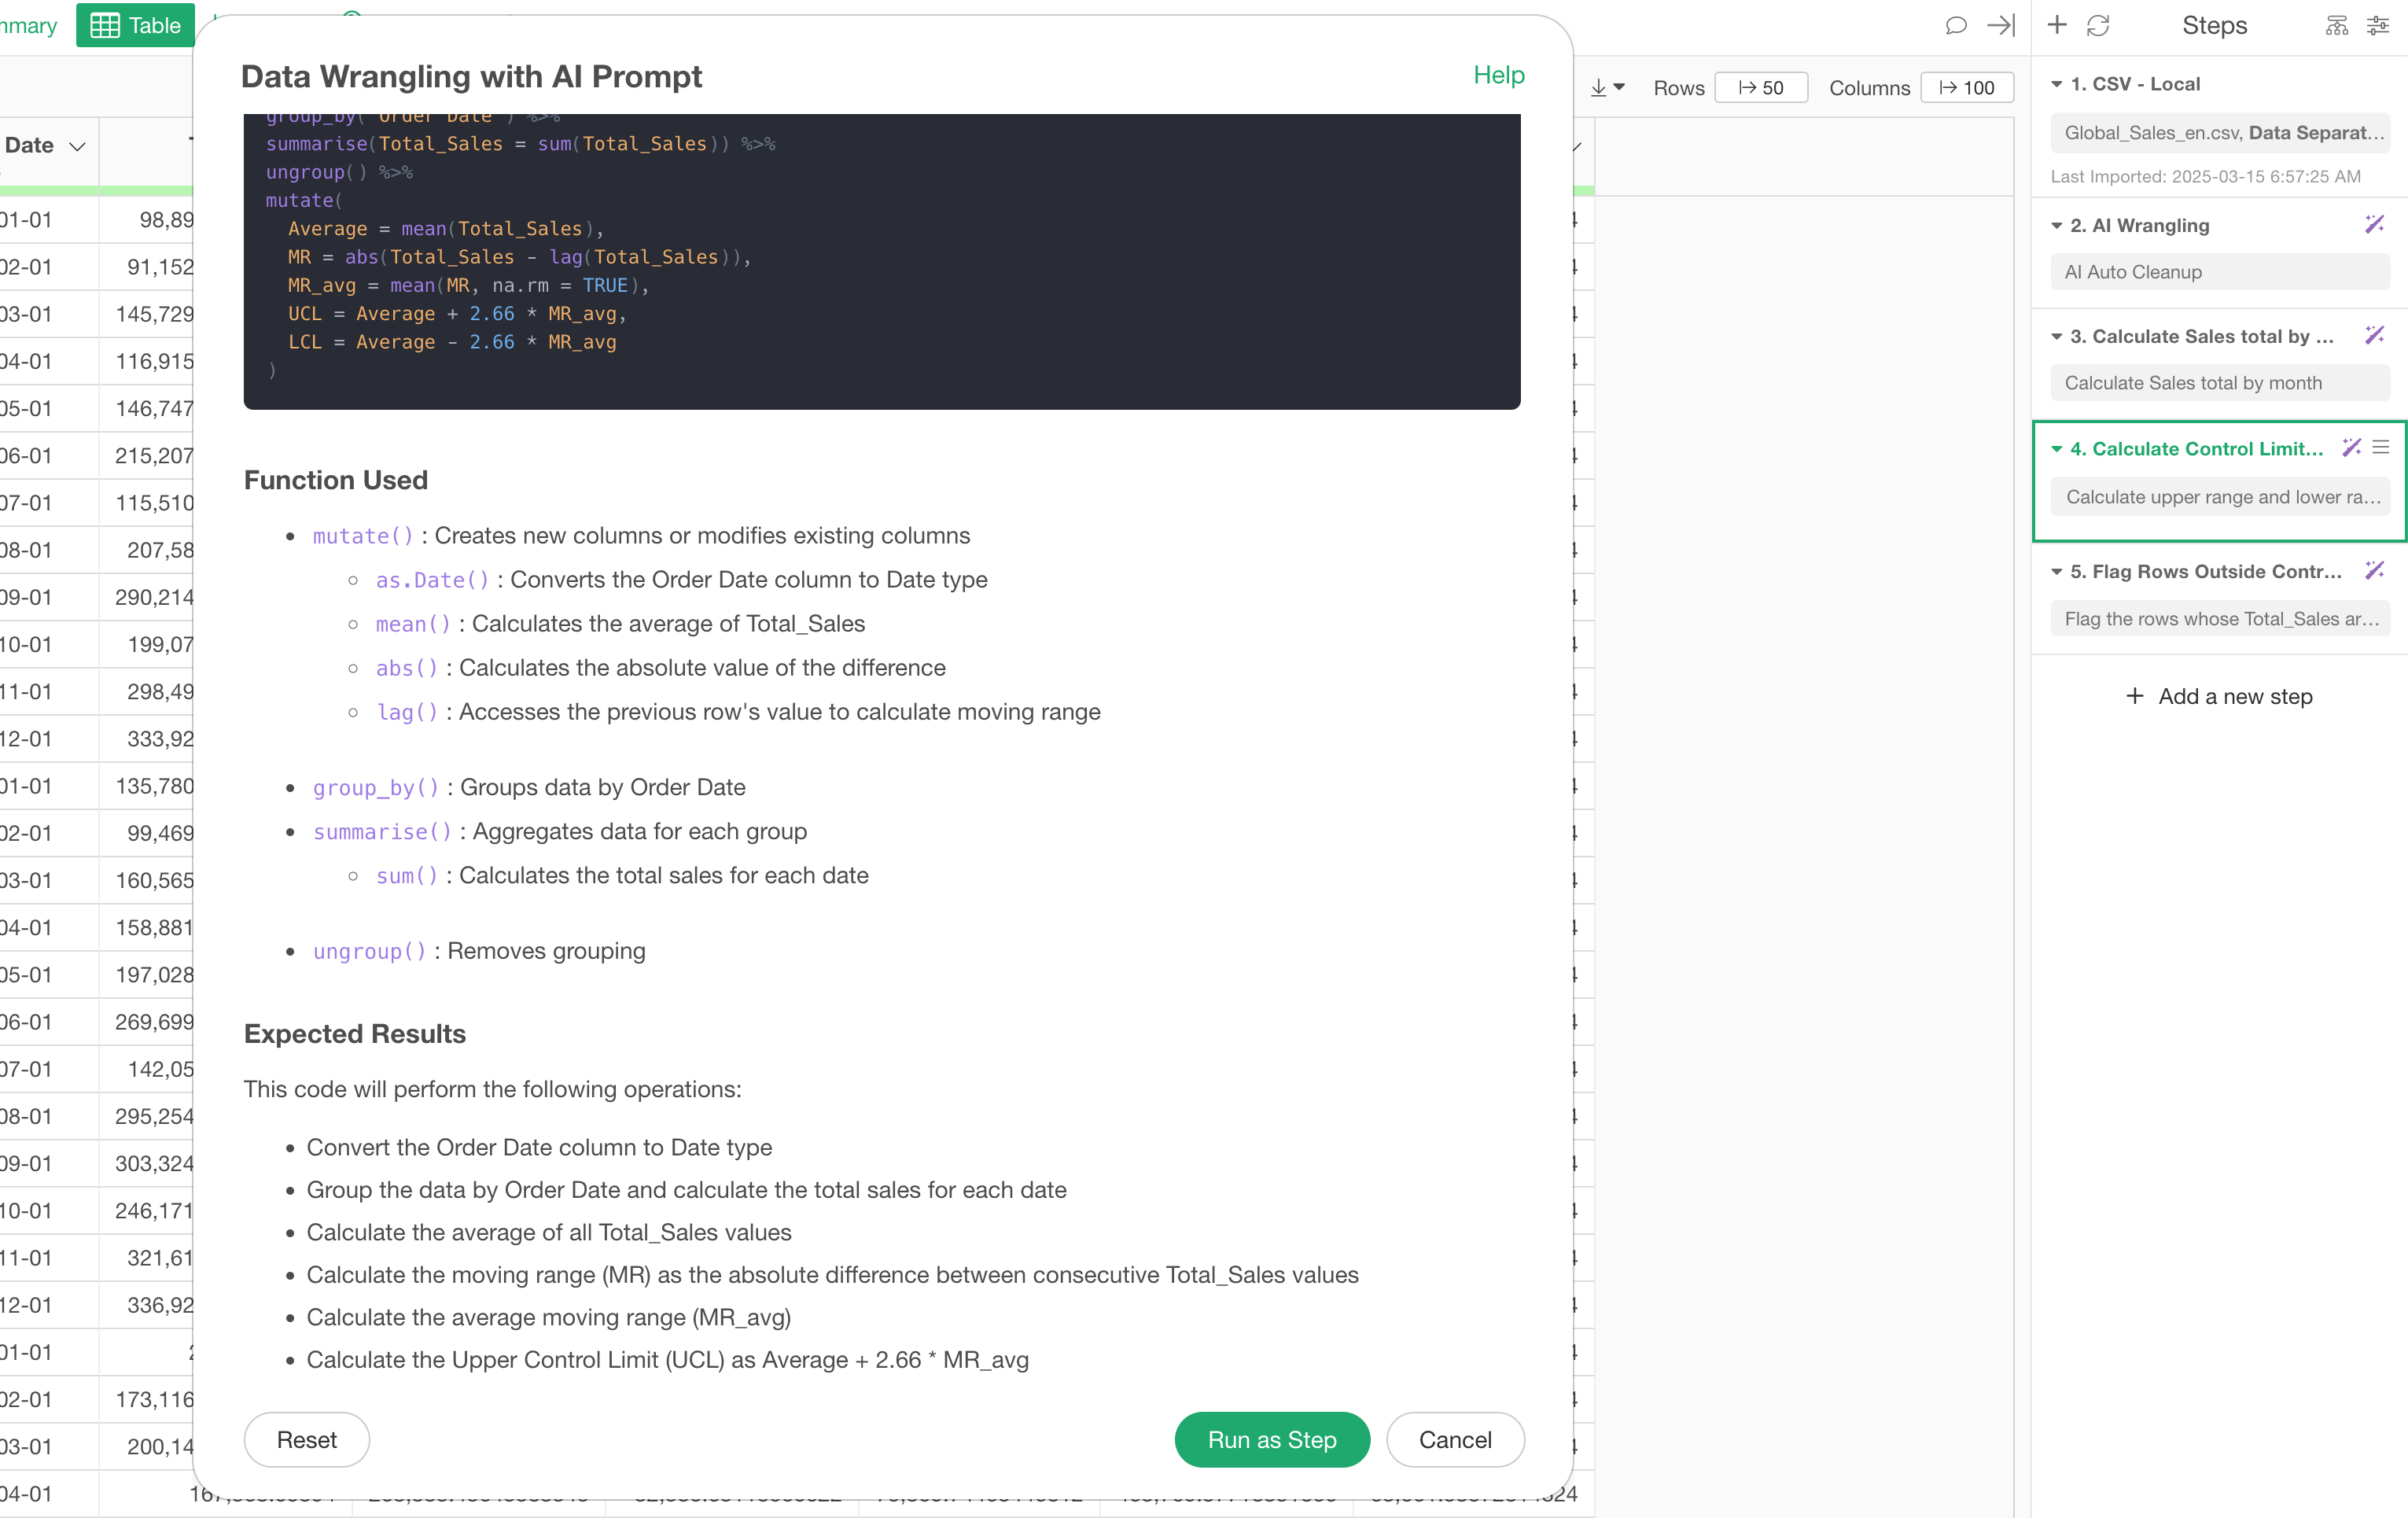
But it doesn’t disappear into somewhere it’s hard to find like Excel where the calculations and transformations are spread across a bunch of cells.
It becomes part of a visible, inspectable data wrangling step.
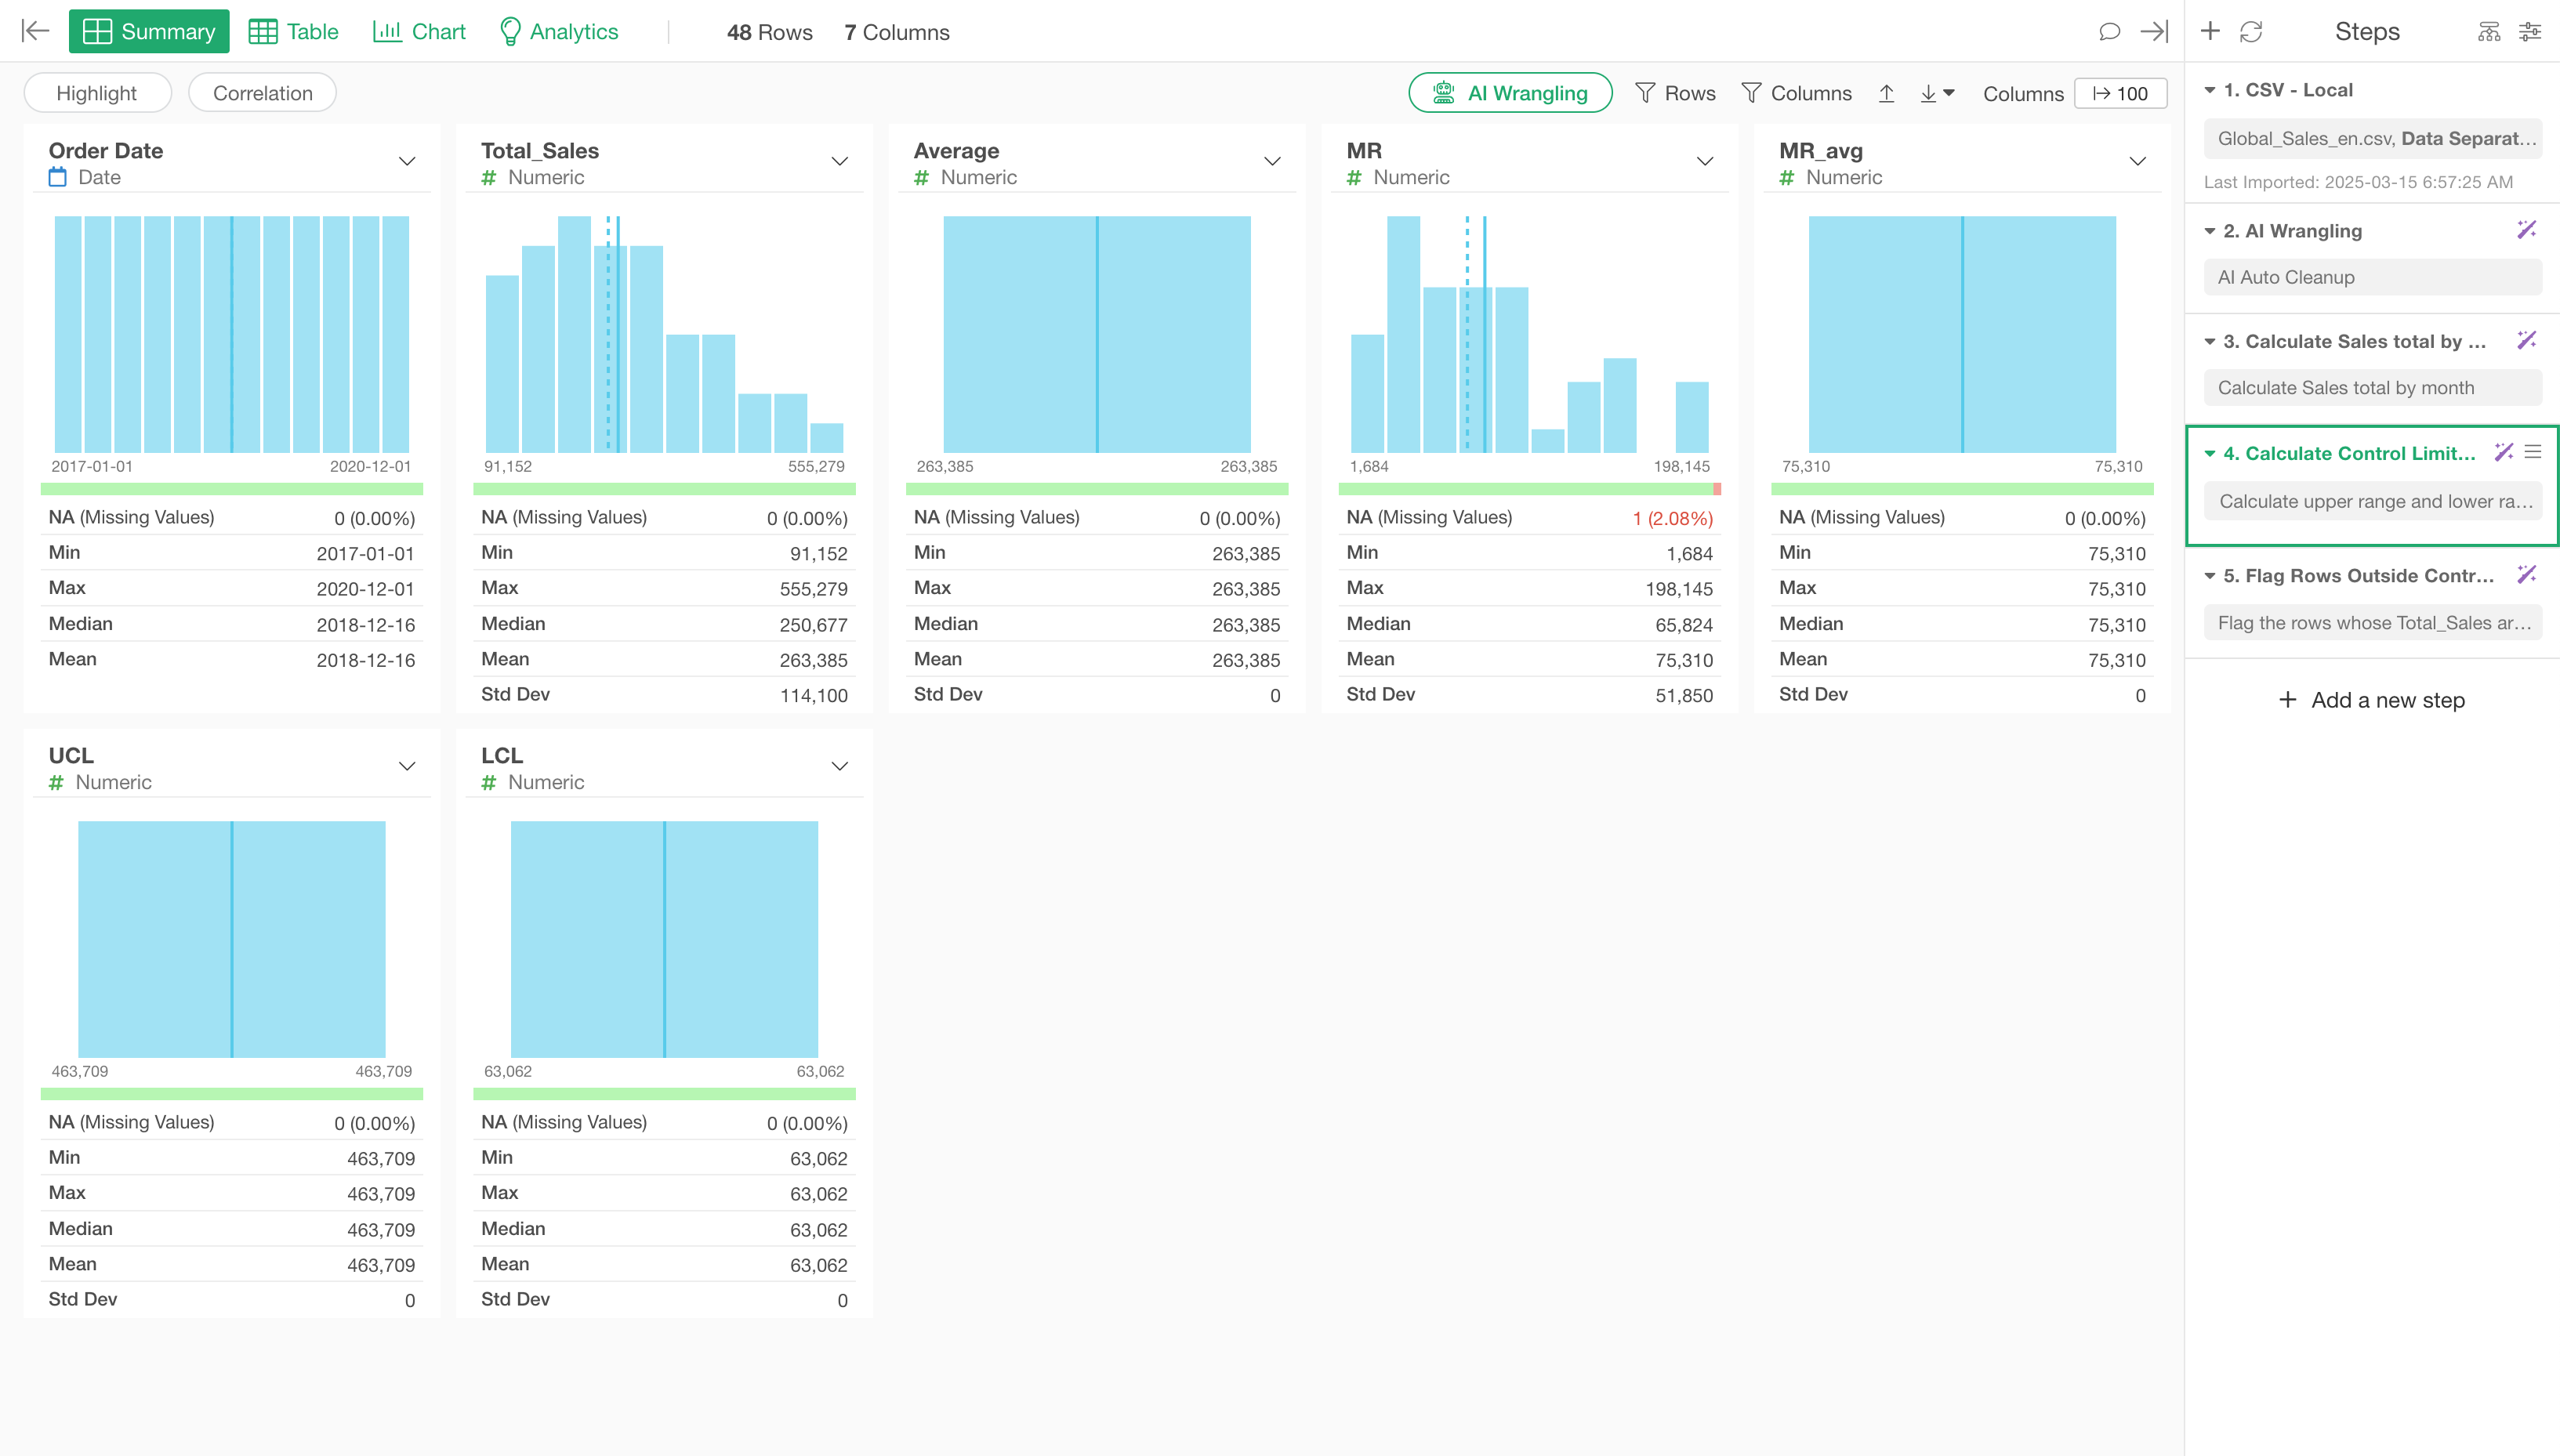
Each step is preserved as part of a pipeline - a sequence of data transformations that you can revisit, modify (such as changing the data source files or underlying SQL queries, updating calculations, changing the data filter conditions, etc.), and rerun at any time.
You can see the updated data visualized by Summary view where each column shows its summary information with automatically generated chart and metrics.
Or, simply use Chart view where you can visualize the data with various chart types and chart features with point-and-click.
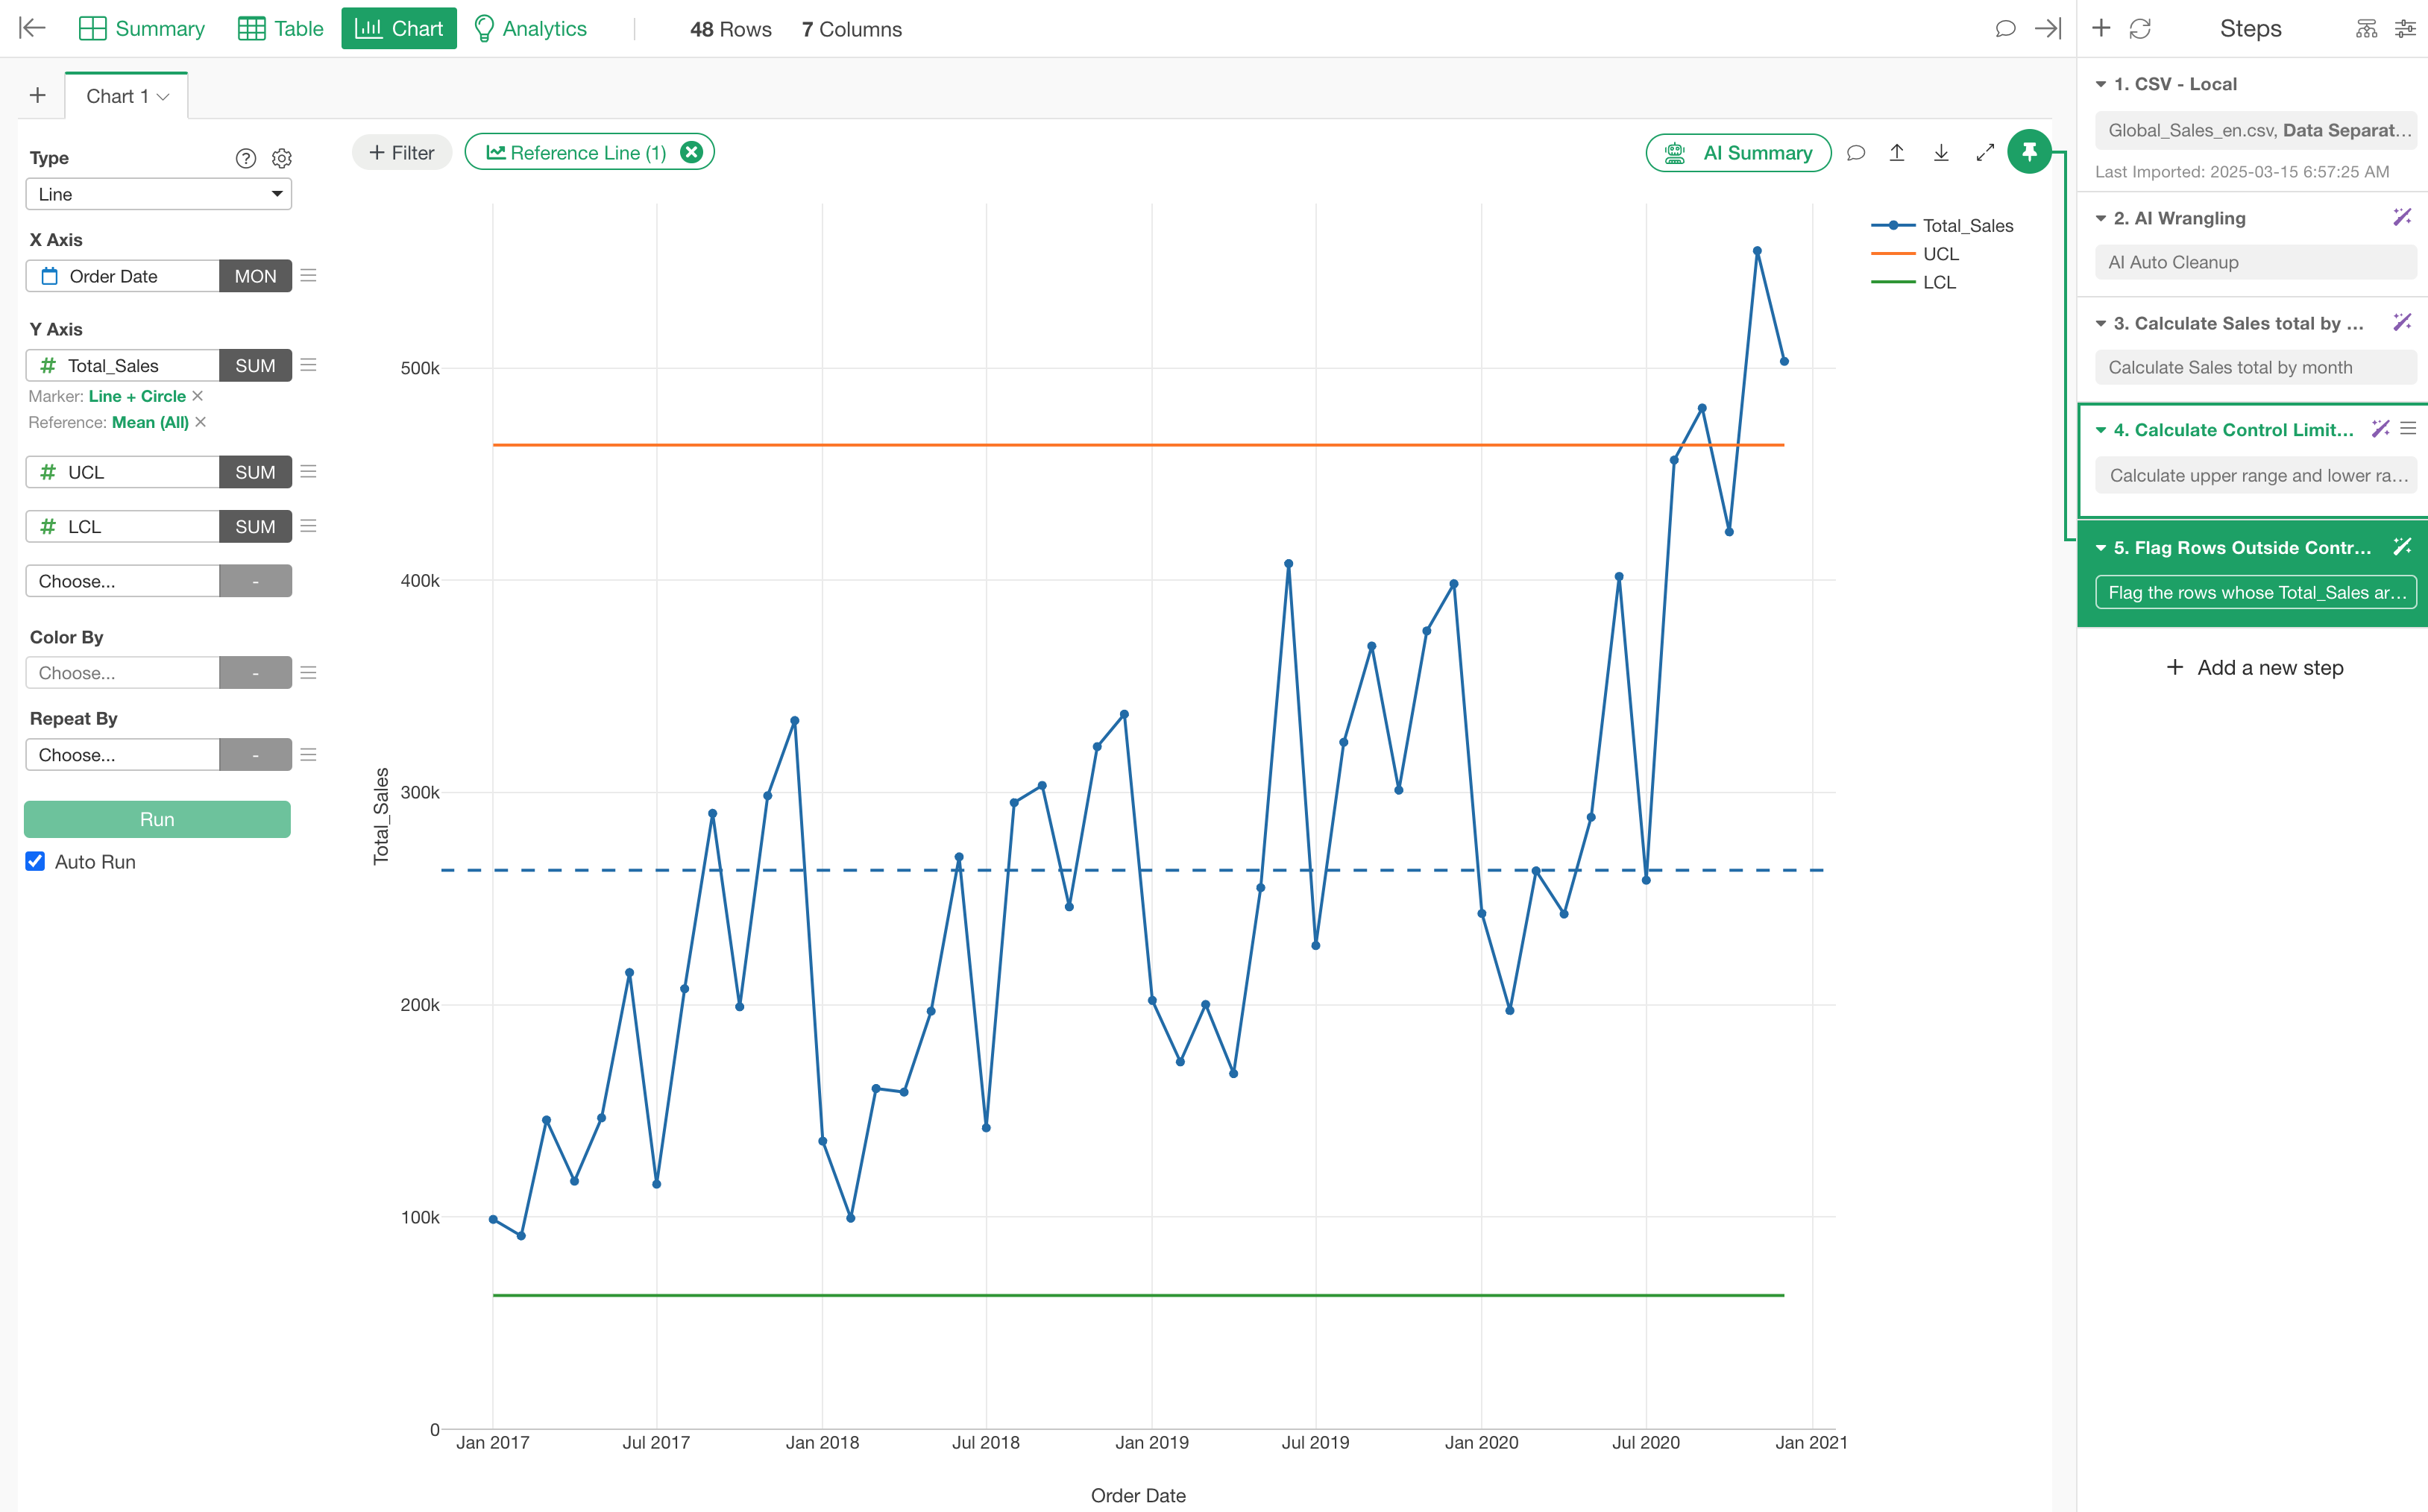
This makes a powerful data exploratory experience, which is highly visual, iterative, and interactive.
Over time, this changes how you work.
You are no longer repeatedly asking AI to regenerate the same logic. You are refining and evolving an analysis that you understand.
When new data arrives, you don’t start over. You update the source step and rerun the process.
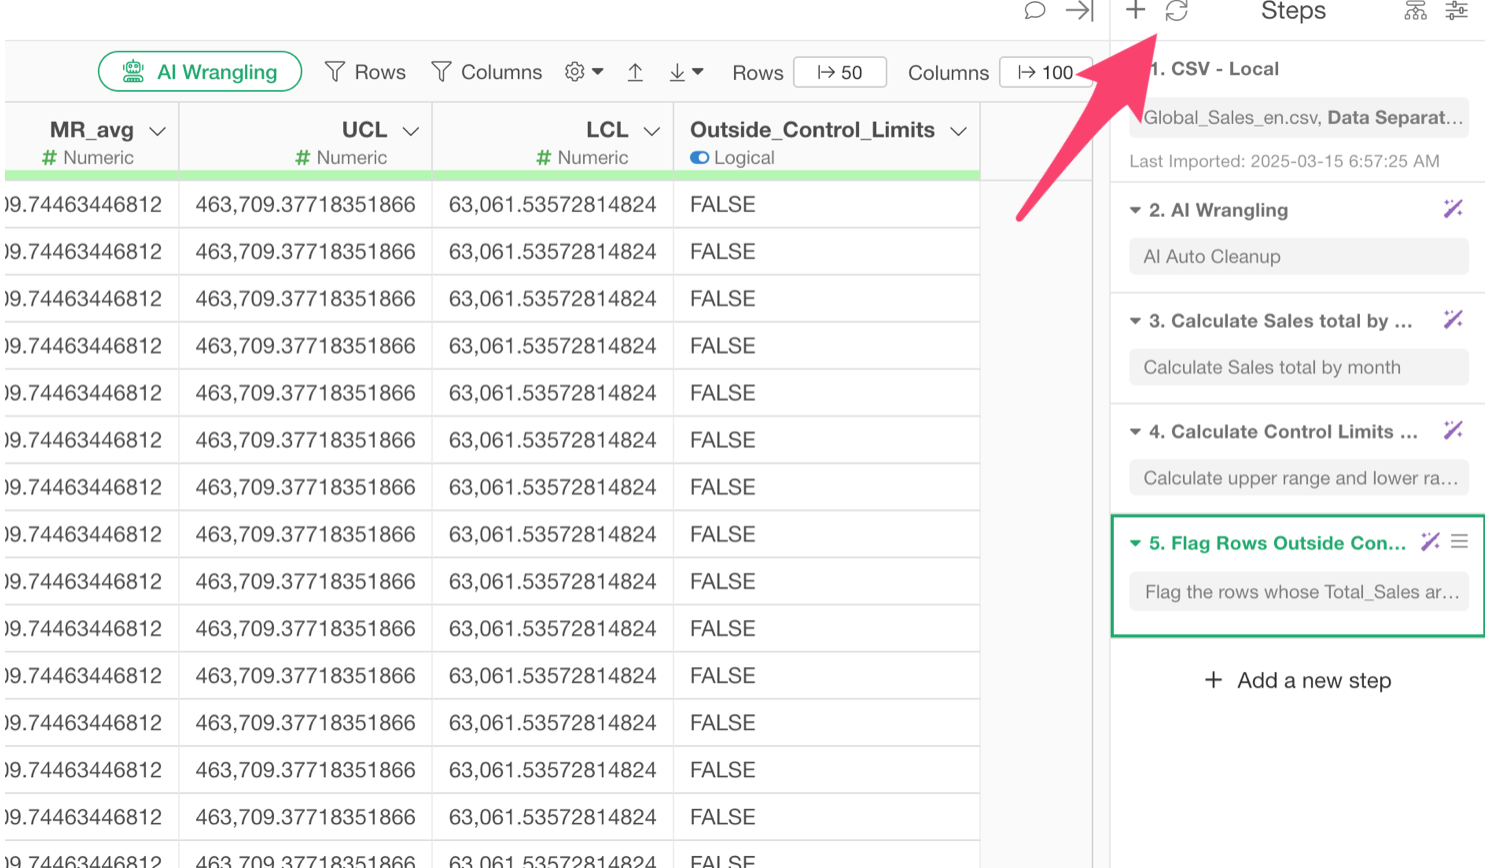
When a new question emerges, you don’t need to start from scratch. You add a new step and continue the flow.
At this point, your analysis becomes:
- Reliable, because you can verify every step
- Reproducible, because the process is preserved
- Interactive, because you can move at the speed of your thinking
And this is not simply because AI is generating code.
It is because that code is readable, and because the environment is designed to support that readability.
Final Thought
If there is one idea to take away from all of this, it is this:
The biggest shift in the AI era is not who writes the code. It is who is responsible for understanding the code AI generates in the world of Data Analysis.
In the past, you wrote the code, so you naturally understood it.
Today, AI writes the code.
Which means understanding no longer comes for free.
It becomes something you must actively regain.
And the only way to do that is through readability.
When code is generated automatically, the value no longer lies in producing it.
The value lies in being able to read it instantly, verify it confidently, and adapt it flexibly.
That is why programming itself hasn’t become less important.
It has simply changed its role.
From:
writing code
To:
understanding and validating code
Therefore, in this AI era, the choice of language is not about capability alone, but it’s about readability.
It is about whether you can understand what has been generated quickly.
Because that is what helps you trust the result.
That is what makes it reusable.
That is what makes it interactive.
And that is why R, especially tidyverse, feels increasingly aligned with the future of data science.
Try Exploratory!
If this idea resonates with you, that in the AI era, the ability to read and understand code matters more than ever, then the best way to experience it is to try it yourself.
In Exploratory, you can describe how you want to transform your data, and AI will generate readable R (tidyverse) code for you. Not as a black box, but as something you can inspect, understand, and build upon.
You’ll quickly notice the difference.
Instead of repeatedly asking AI to regenerate answers, you begin to work with the analysis itself, verifying it, refining it, and evolving it over time.
👉 Download Exploratory
https://exploratory.io/download
If you don’t have an account yet, you can sign up here and start a 30-day free trial: https://exploratory.io/
If your trial has expired but you’d like to try the latest AI features, simply launch the newest version and use the Extend Trial option.
If you have any questions or feedback, feel free to reach out directly: kan@exploratory.io
I’d love to hear how you’re using Exploratory to better understand your data.
Kan Nishida
CEO, Exploratory