The 3 Rs of Trustworthy Analytics in the Age of AI
AI is making data analysis dramatically easier.
Give an AI tool a dataset, and it can calculate KPIs, generate charts, identify patterns, and even write a polished report in minutes.
That is a major step forward.
Tasks that once required specialized skills and years of experience are becoming accessible to far more people.
You can upload a dataset and ask:
What are the most important metrics here?
Show me the key trends in our conversion.
Create a few charts that can show the trend and outliers well.
Summarize what’s causing the trend.
And within seconds, you may have something that looks remarkably like a finished analysis.
But that creates a new problem:
Can you trust it?
A KPI can be calculated instantly.
A chart can look convincing.
A report can sound authoritative.
But if the underlying data is wrong or a logic in calculating the numbers is wrong, if the data was prepared incorrectly, or if an important assumption was overlooked, the final result can still be wrong.
And as AI makes it easier to generate data analysis faster and a lot more, this question of ‘trust’ becomes more important, not less.
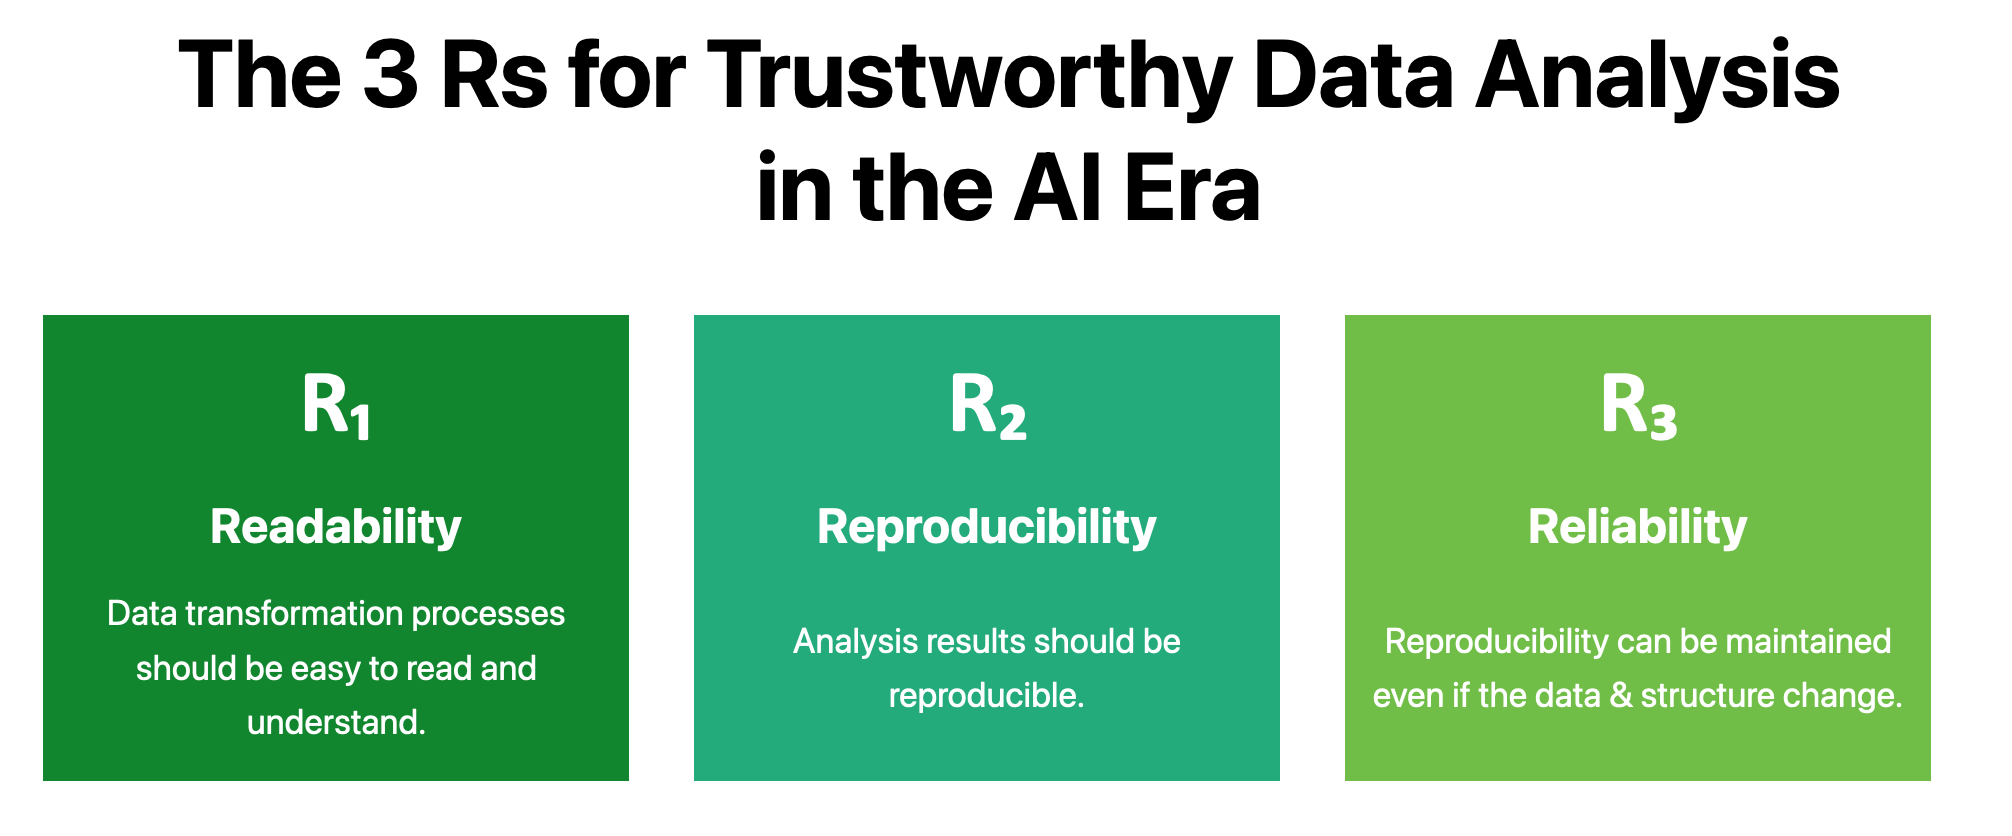
To build analytics we can actually trust in the age of AI, we need to pay attention to three things:
- Readability - Can we understand how the result was produced?
- Reproducibility - Can we run the same analysis again?
- Reliability - Can we keep that analysis working as the data changes?
These are what I call “3 Rs of trustworthy analytics.”
And they have been our major focus for Exploratory.
Garbage In, Garbage Out Still Applies
AI has changed a lot about analytics.
But, it hasn’t changed one of its oldest saying:
Garbage In, Garbage Out.
If the data going into an analysis is wrong, the analysis coming out of it will be wrong as well.
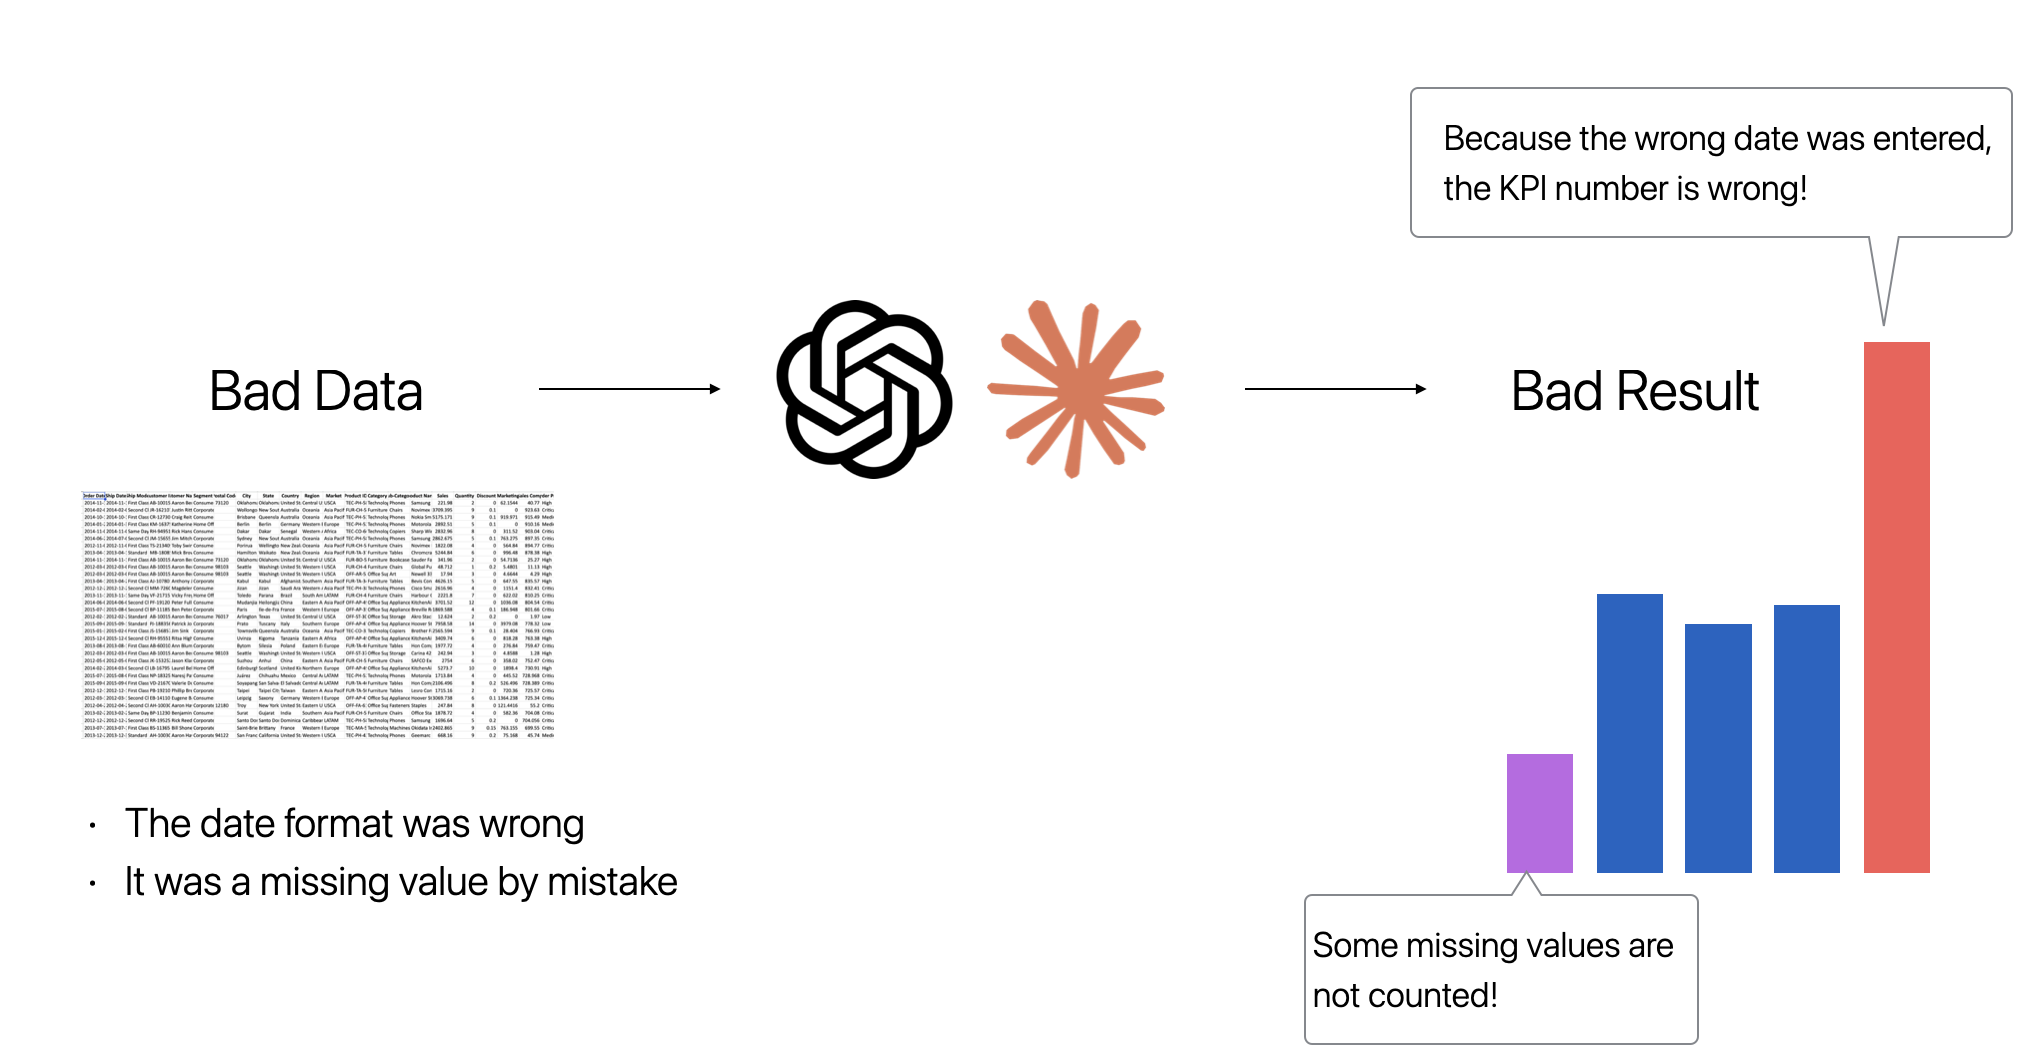
Suppose a sales dataset contains incorrect transaction amounts. Revenue and growth metrics calculated from that data will be wrong.
Suppose a customer ID format changes halfway through a dataset. Joins and customer-level aggregations may no longer behave as expected.
Suppose a date column is accidentally imported as text. Monthly aggregation and time-series analysis can break or, worse, silently produce misleading results.
AI does not make these problems disappear.
In fact, AI can sometimes make them harder to notice because it is so good at producing polished output from imperfect inputs.
A cool looking chart is not an evidence that the data behind it is correct.
A well-written executive summary is not an evidence that the calculations behind it are valid.
So in the AI era, it is no longer enough to look only at the final output.
We also need to understand how that output was produced.
An Old Problem in a New Era
The problem of trust in analytics did not begin with AI.
Anyone who has inherited a complicated Excel workbook has probably asked questions like these:
Where did this number come from?
What exactly is this formula doing?
Why does this total look different from last month’s?
How do I recreate this report with the latest data?
Spreadsheets are incredibly useful, but analytical logic can easily become scattered across hundreds of cells, formulas, worksheets, manually entered values, and copy-and-paste operations.
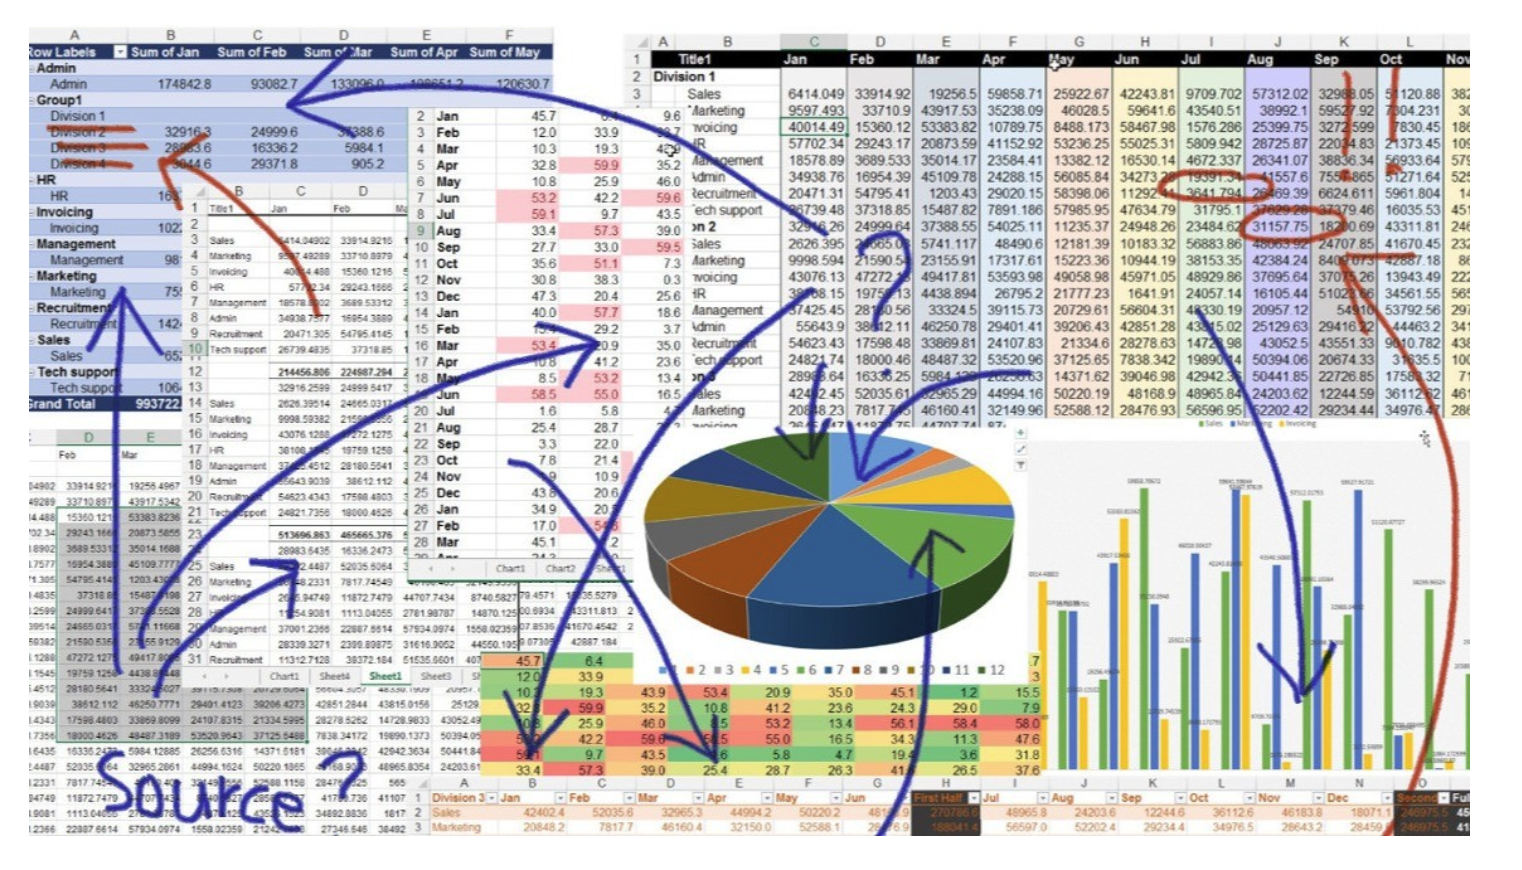
Eventually, the final number may be visible while the process that produced it is not.
That is a Readability problem.
And once the process becomes difficult to understand, another problem follows.
Imagine that the same report needs to be produced next month.
Or that the same analysis needs to be applied to a new group of customers.
Or that someone else on the team needs to reproduce what you did.
If the steps that produced the original result were never clearly captured, the analysis often has to be reconstructed from scratch.
That is a Reproducibility problem.
Code Improved Reproducibility. But Code Alone Wasn’t Enough.
One of the reasons R, Python, SQL, and other code-based tools became so important in analytics was that they offered a better way to capture analytical logic.
Instead of manually modifying cells, you could write down the steps:
- Import the data.
- Filter the rows.
- Join two datasets.
- Calculate a new variable.
- Aggregate the results.
- Create a chart.
Those instructions could then be reviewed, shared, versioned, and executed again.
This was a major improvement in reproducibility.
For example, in a case of R, its tidyverse and dplyr packages, in particular, helped make data-wrangling code much easier to follow by expressing transformations as a sequence of relatively readable steps.
But code does not solve everything.
As projects grow, code can become complicated. Logic gets spread across scripts and notebooks. It becomes difficult to know which code produced which chart or which version of a dataset is feeding a particular report.
And while code may be perfectly readable to the person who wrote it, it is not necessarily readable to an analyst, manager, subject-matter expert, or business stakeholder who does not write code every day.
Yes, code did dramatically improved reproducibility.
But, it came with a burden of readability problem, even with AI’s help.
The Original Idea Behind Exploratory
This was one of the ideas behind Exploratory from the beginning:
Combine the reproducibility of R with the accessibility of a visual interface.
When you transform data through the Exploratory UI, the underlying work is executed in R.
But instead of disappearing inside a script, each transformation is also recorded as an explicit step in the workflow.
That gives you several things at once:
- the reproducibility of R
- the accessibility of a visual interface
- a step-by-step history of data transformations
- connections between the data pipeline and the charts, dashboards, and reports built from it
The goal has always been to make the analytics workflow easier to understand and easier to reproduce.
AI makes that idea even more important.
When humans had to manually create every transformation and chart, they were naturally closer to the process.
Now AI can generate parts of the workflow for us.
That is incredibly useful.
But it also makes visibility into the workflow more important.
If AI gives you an answer, you should still be able to see how that answer was produced.
If AI creates an analysis, you should still be able to inspect and validate it.
That brings us to the 3 Rs.
The 3 Rs of Trustworthy Analytics
1. Readability: Can You Understand the Process?
Readability means being able to understand what happened to the data.
What data source was used?
Which rows were filtered?
Where were datasets joined?
How was a metric calculated?
Which transformations happened before a chart or KPI was produced?
If you can see those steps, you can inspect the analysis, explain it to someone else, and decide whether you trust the result.
This matters even more when AI is involved.
The question is no longer simply:
“What did the AI produce?”
It is also:
“What did the AI actually do to produce it?”
2. Reproducibility: Can You Run It Again?
A trustworthy analysis should not depend on remembering a long sequence of manual actions.
You should be able to run the workflow again.
That matters when you need to:
- refresh a monthly report
- apply the same analysis to new data
- reproduce an analysis created six months ago
- hand the project to another analyst
- validate someone else’s results
For that to happen, the transformations and analytical steps need to be recorded and executed consistently.
Reproducibility turns an analysis from a one-time exercise into a reusable workflow.
3. Reliability: Will It Keep Working?
Reproducibility alone is not enough.
Real-world data changes.
A column called Order Date becomes
Order_Date.
A date field that used to be imported as a date suddenly arrives as text.
A column gets renamed halfway through a data pipeline, while downstream calculations still reference the old name.
A new data export changes its schema.
The workflow may have been perfectly reproducible yesterday and completely broken today.
That is why we think there is a third R:
Reliability.
Reliability is the ability to keep a reproducible analytics workflow functioning as the data and its surrounding environment change.
It is not enough to create reproducibility.
We need to maintain it.
How Exploratory Strengthens the 3 Rs
In Exploratory v15, we introduced several capabilities designed around these ideas.
Step Diagram: See Where the Numbers Came From
Real analytics projects rarely involve a single table.
You may have:
- customer data
- transaction data
- product data
- campaign data
These datasets are joined, filtered, aggregated, branched, and transformed before they eventually produce a KPI, chart, dashboard, or report.
As the workflow grows, answering a seemingly simple question can become surprisingly difficult:
Where did this number actually come from?
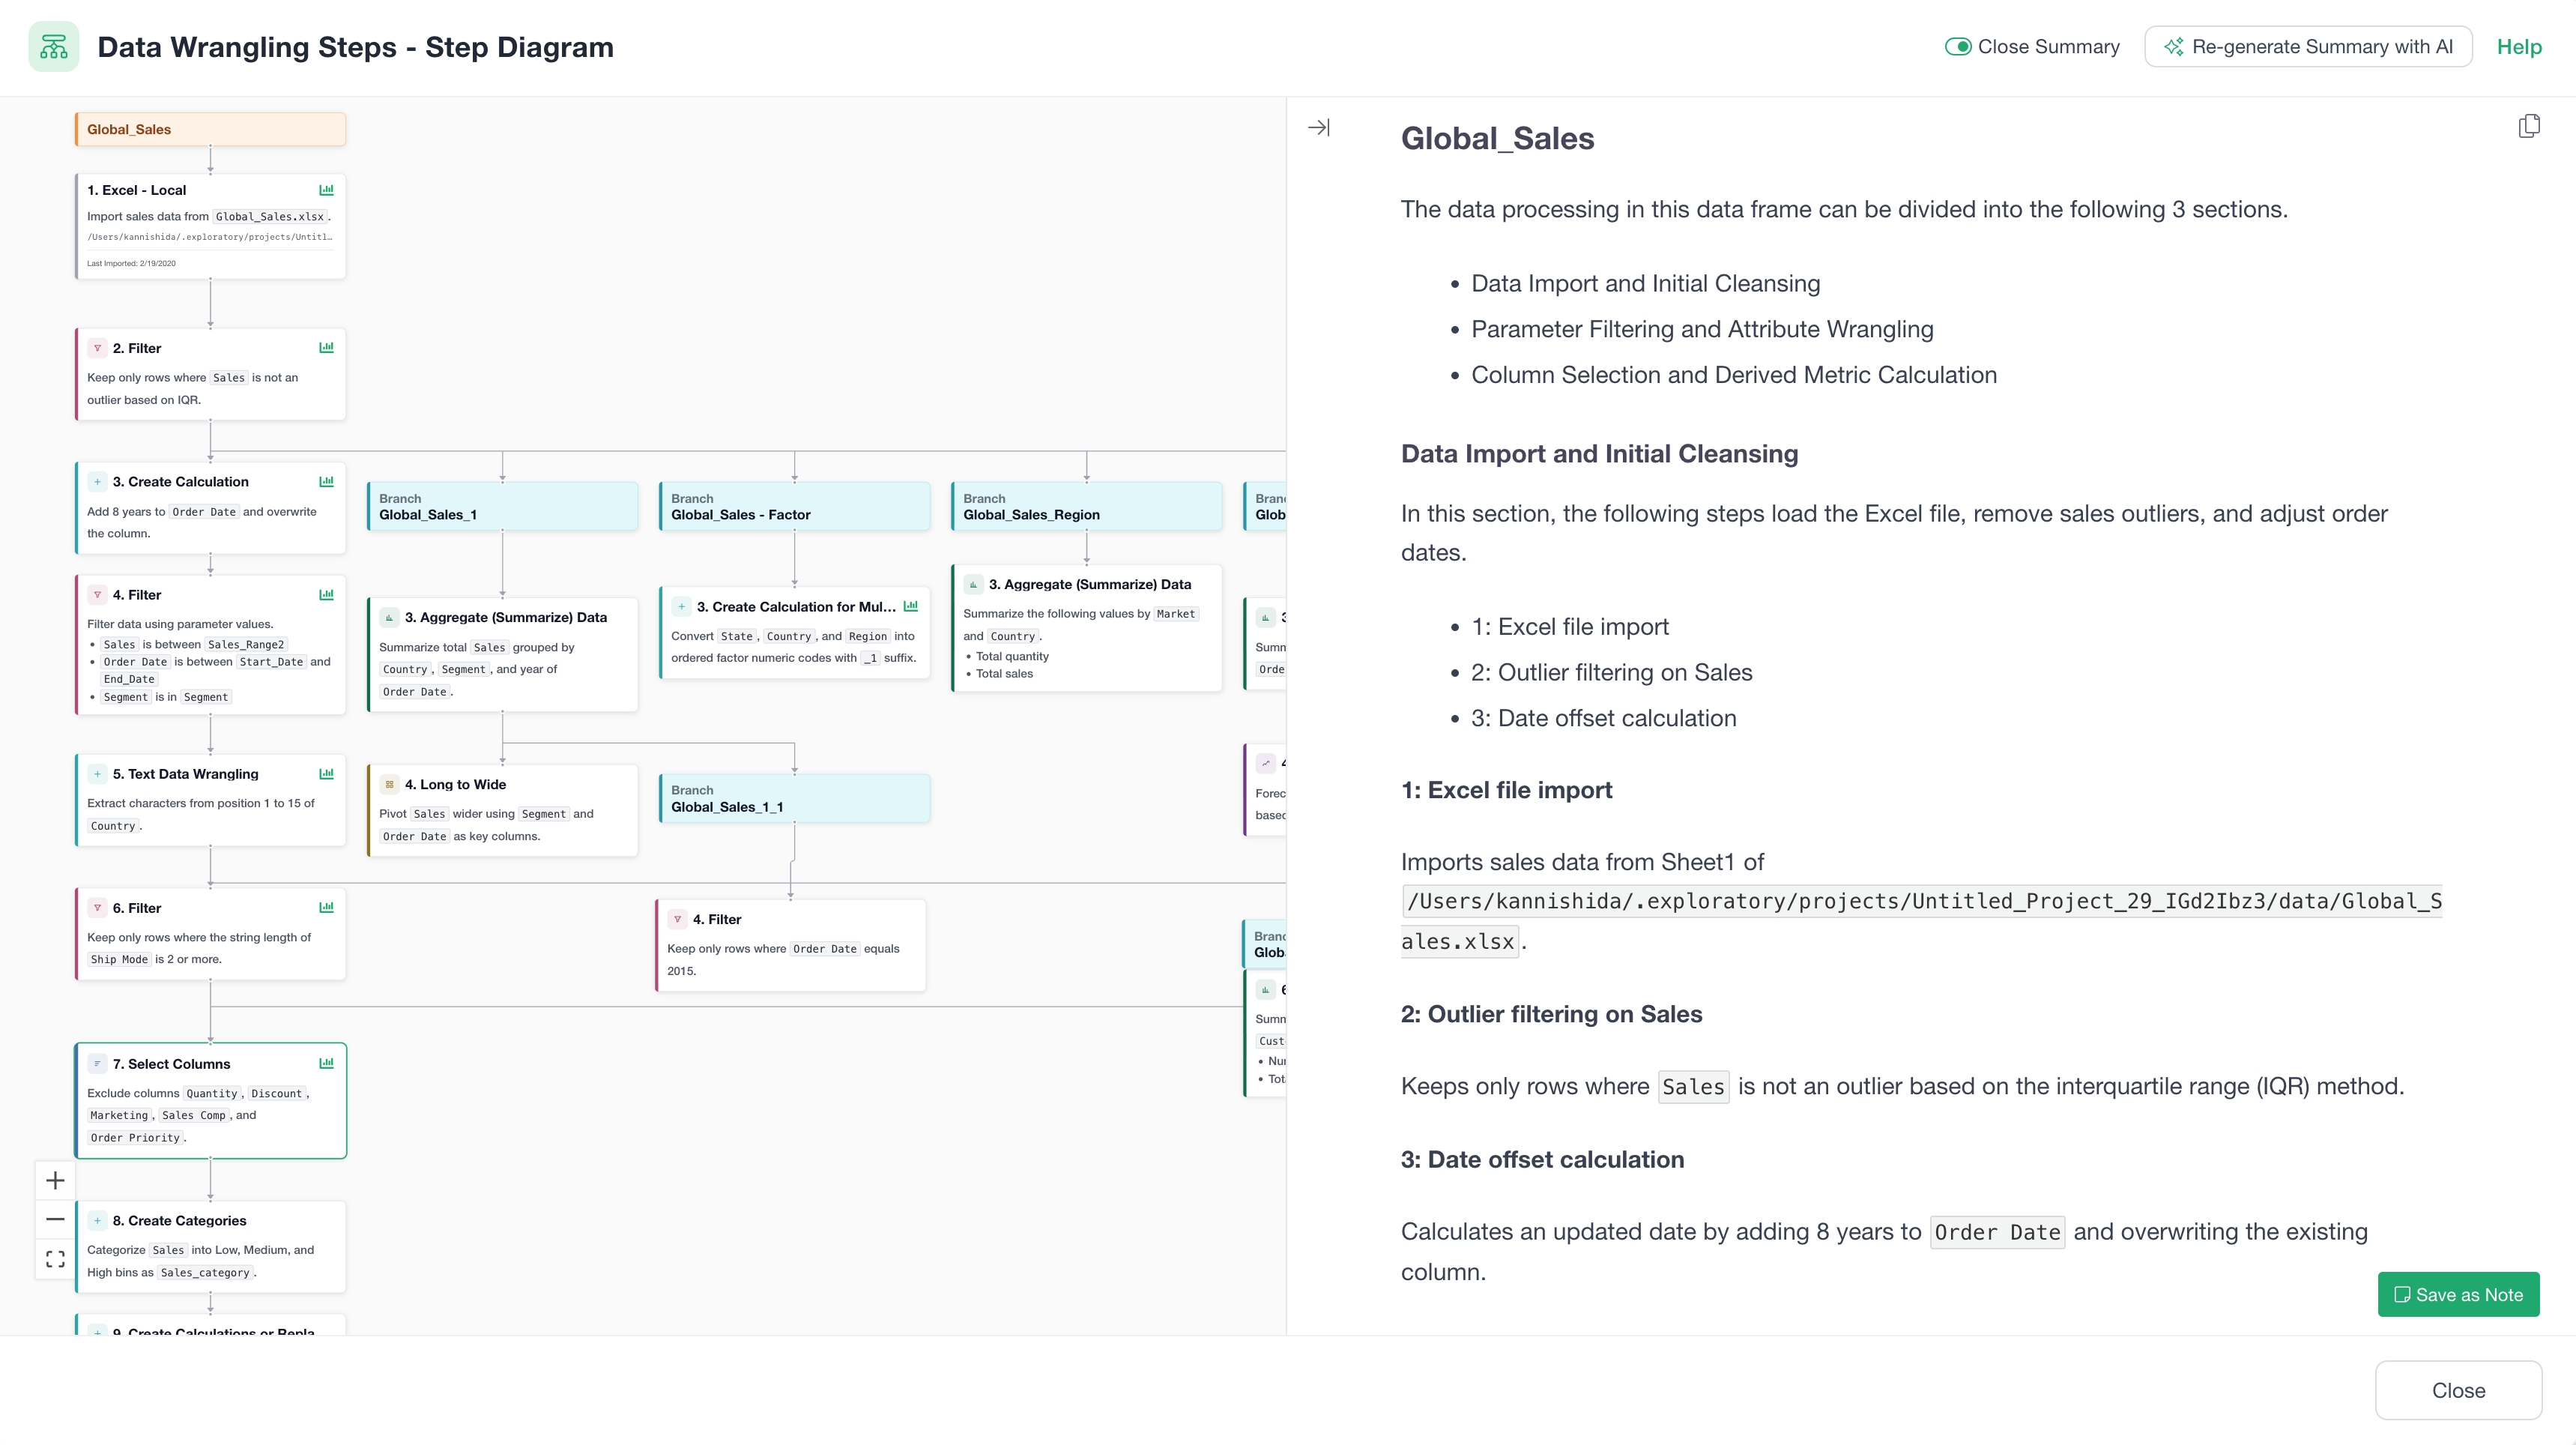
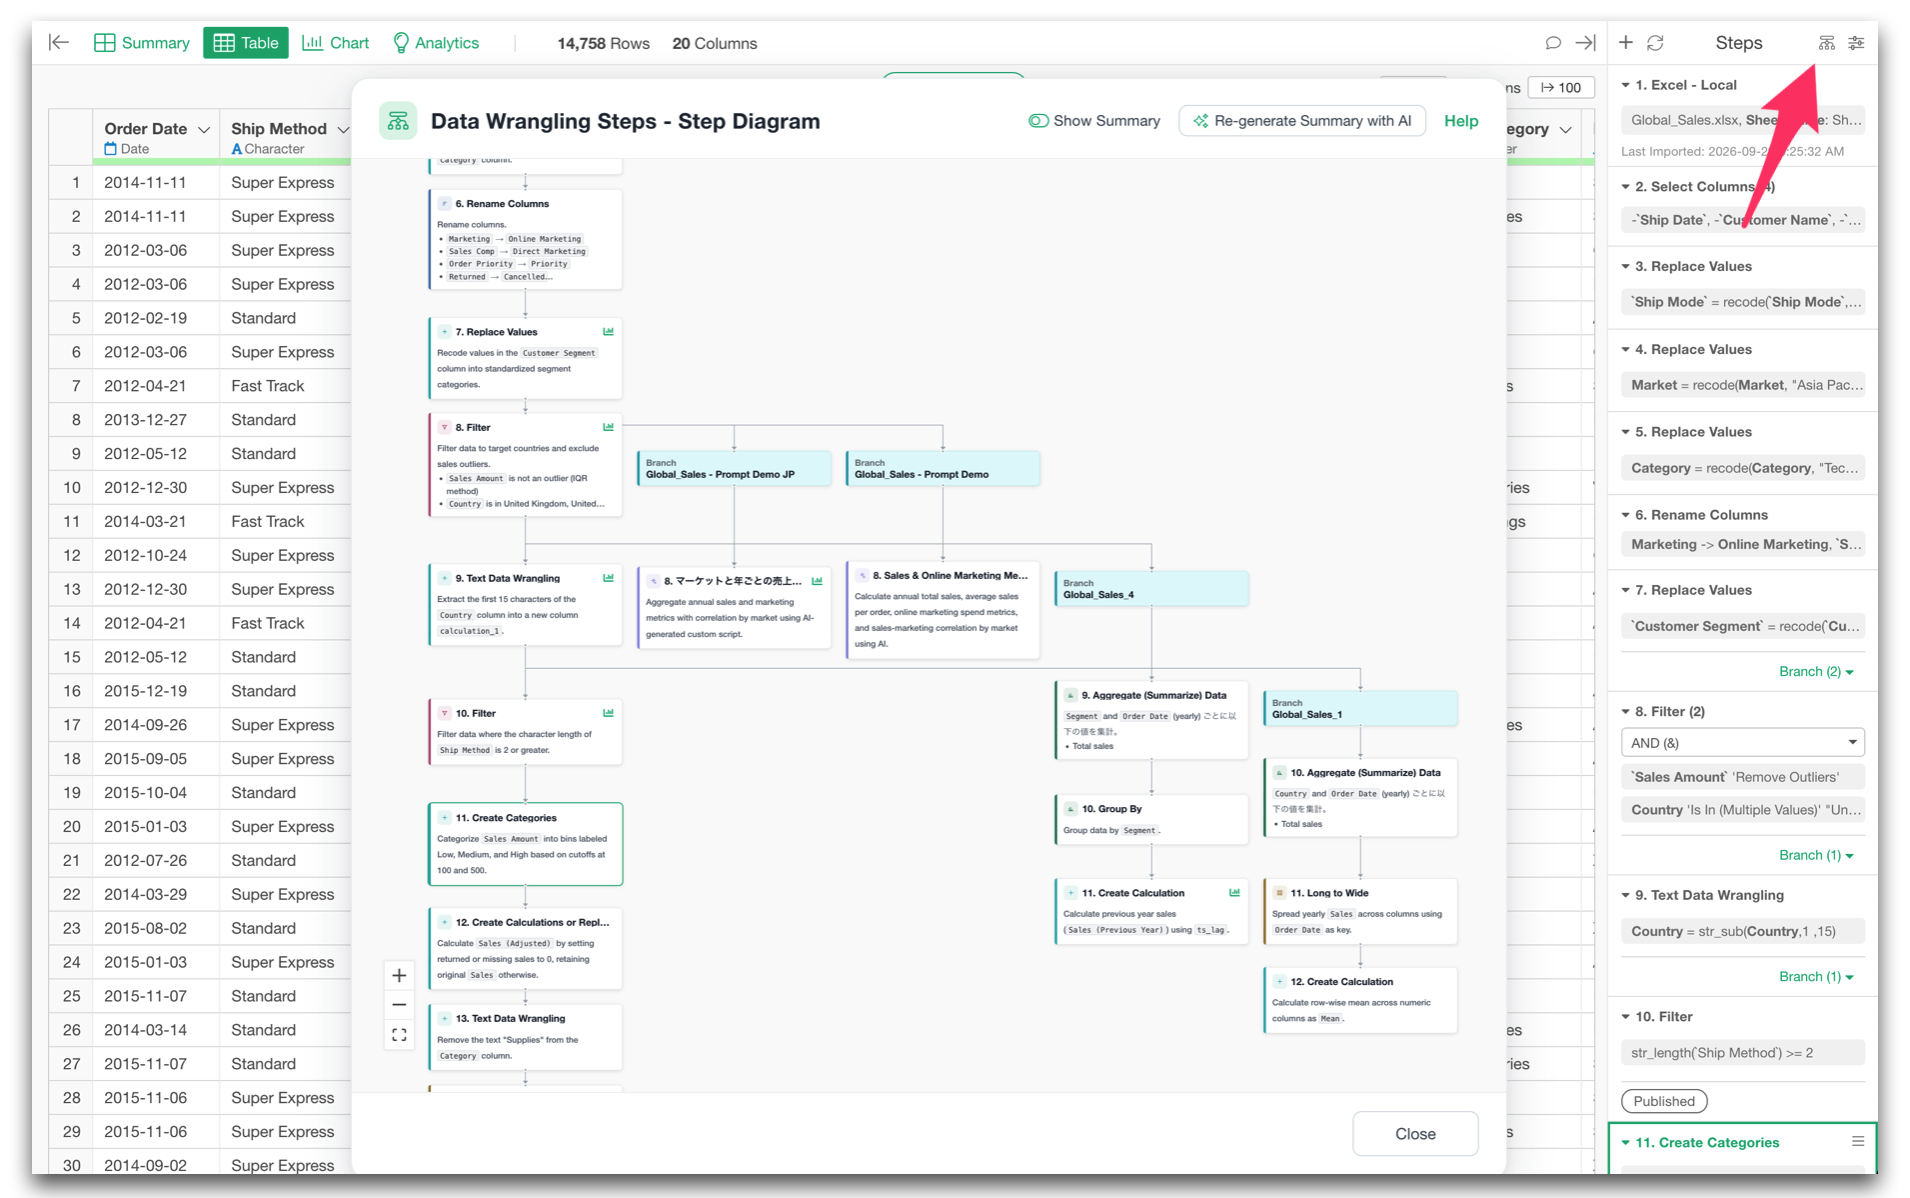
The new Step Diagram in Exploratory v15 lets you see the data-processing workflow visually.
You can trace:
- the original data sources
- where data frames branch
- where datasets are joined
- which transformations are applied
- how the workflow eventually connects to charts and other outputs
You can also open the Step Diagram directly from charts and KPI numbers embedded in dashboards and notes.
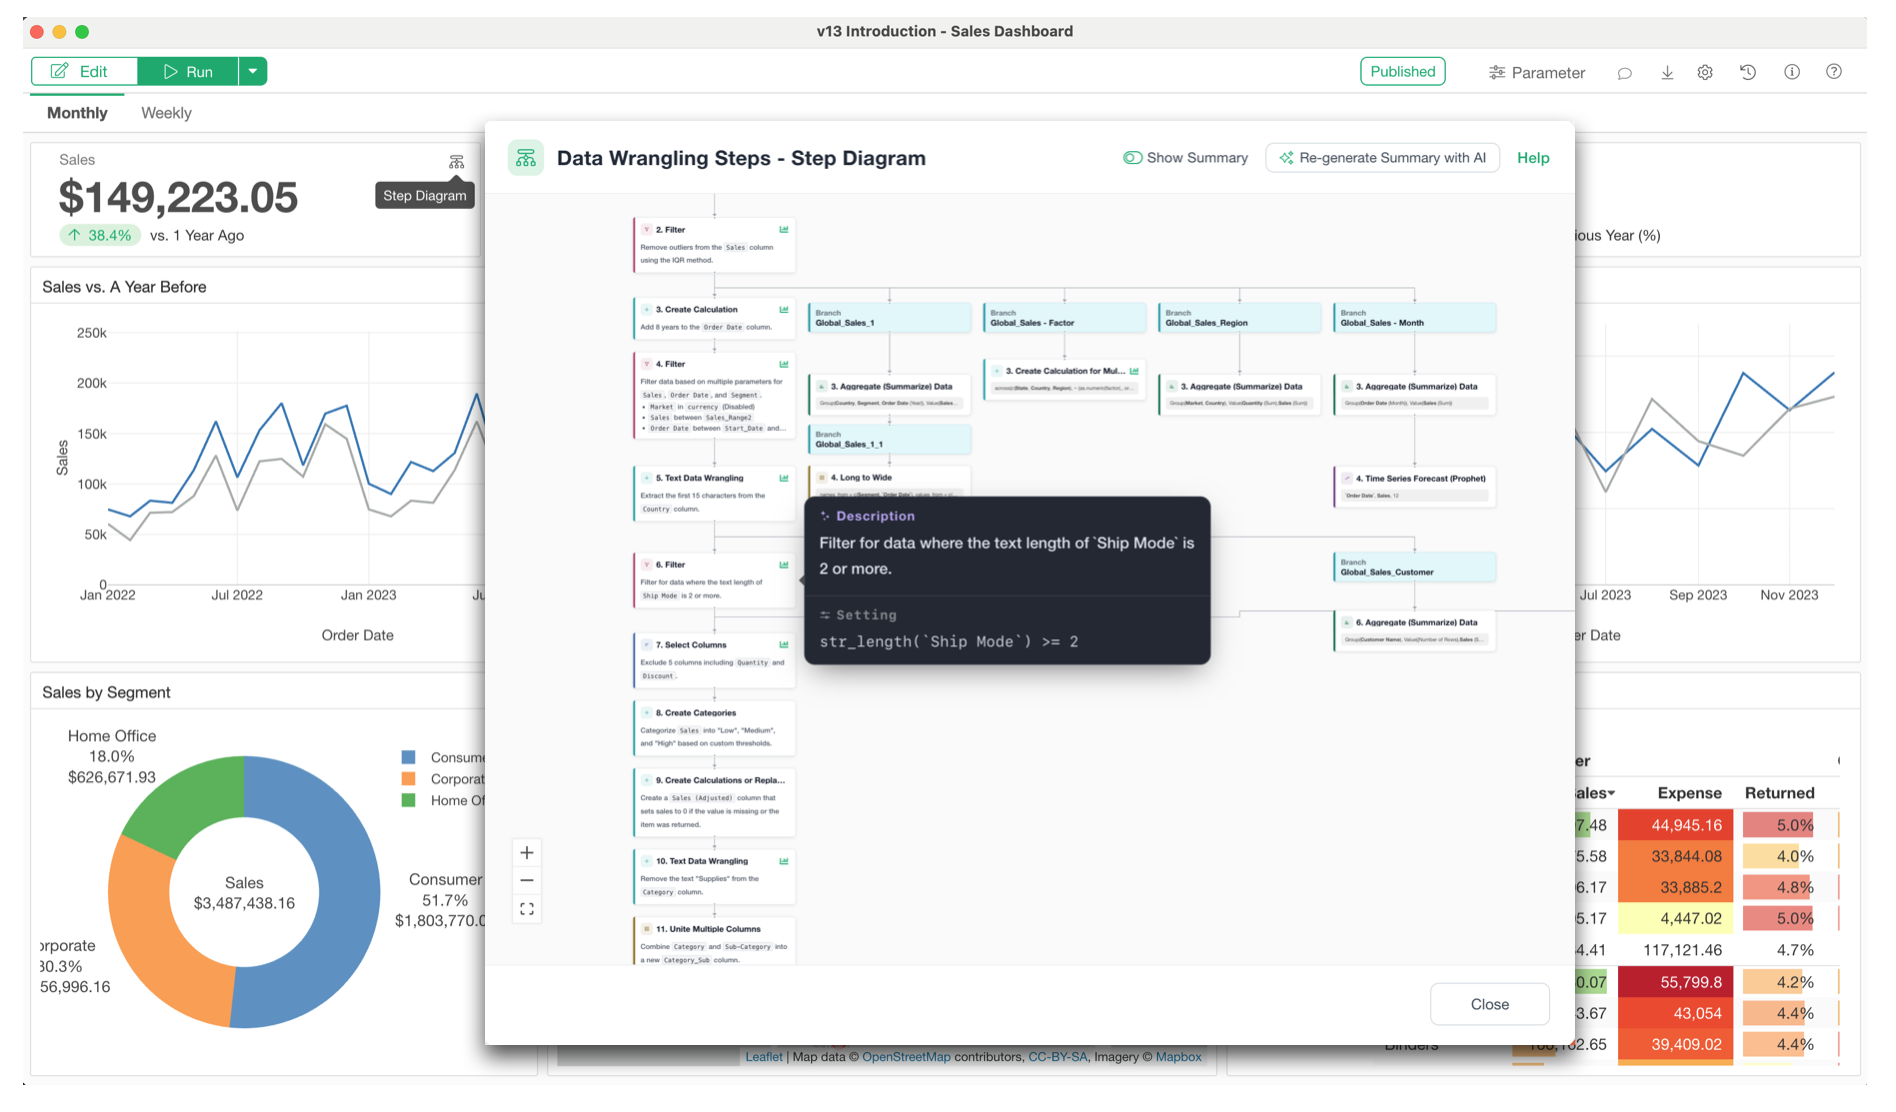
So when someone sees a metric and asks, “How was this calculated?”, the workflow behind it is no longer hidden.
This is Readability in practice.
AI Step Summaries: Explain Data Transformations in Plain English
The transformations behind an analysis can already be inspected through their parameters and underlying R code.
But that is not always the easiest way for everyone to understand them.
Exploratory v15 can use AI to generate a plain-English summary of each data-wrangling step.
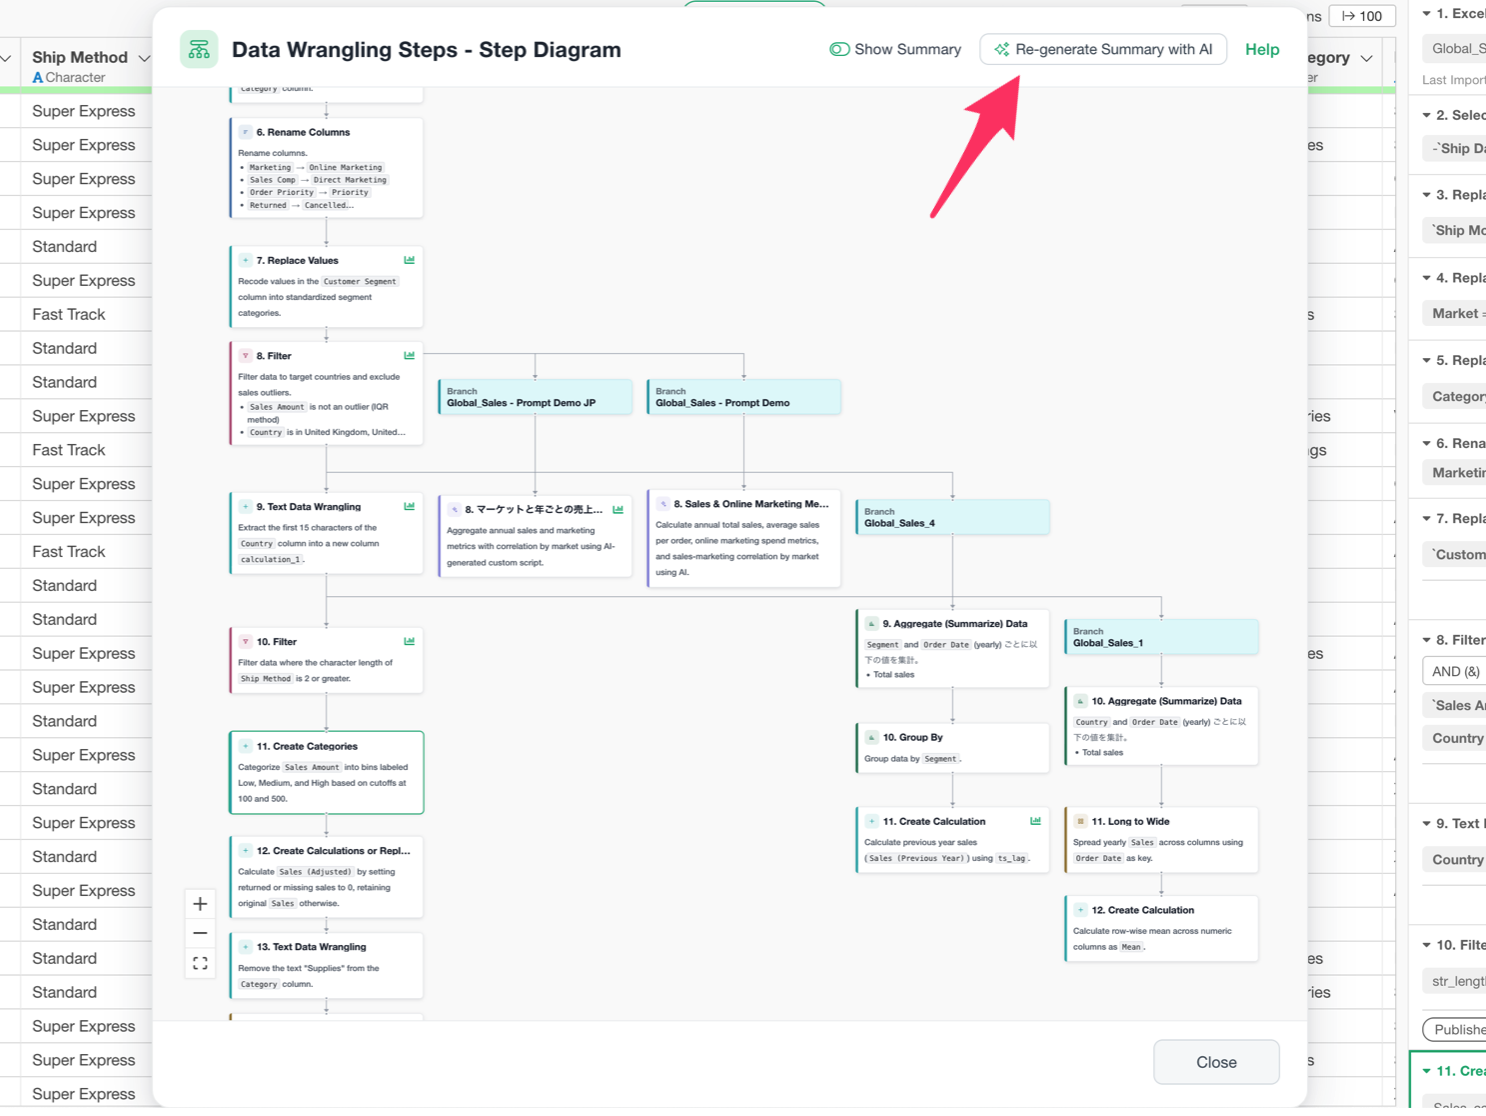
For example:
- Extract the month from the order date.
- Join customer and transaction data using Customer ID.
- Calculate total sales by region.
- Calculate each category’s share of total revenue.
This may sound simple, but it solves an important problem.
The people reviewing an analysis are not always the people who built it.
A business stakeholder may not care about the exact syntax of an R expression. They want to know what the transformation means.
AI-generated step summaries help translate the technical implementation into the language of the analysis.
That makes the workflow easier to review, explain, and share.
Data Wrangling Documentation: Document the Workflow Automatically
Documentation is one of those things everyone agrees is important and almost nobody has enough time to maintain.
This is especially true for data preparation.
The final dashboard may be documented.
The methodology may be documented.
But the dozens of decisions made between the raw data and the finished analysis often live only inside the project-or inside the analyst’s head.
Exploratory v15 can generate documentation for the entire data-wrangling workflow.
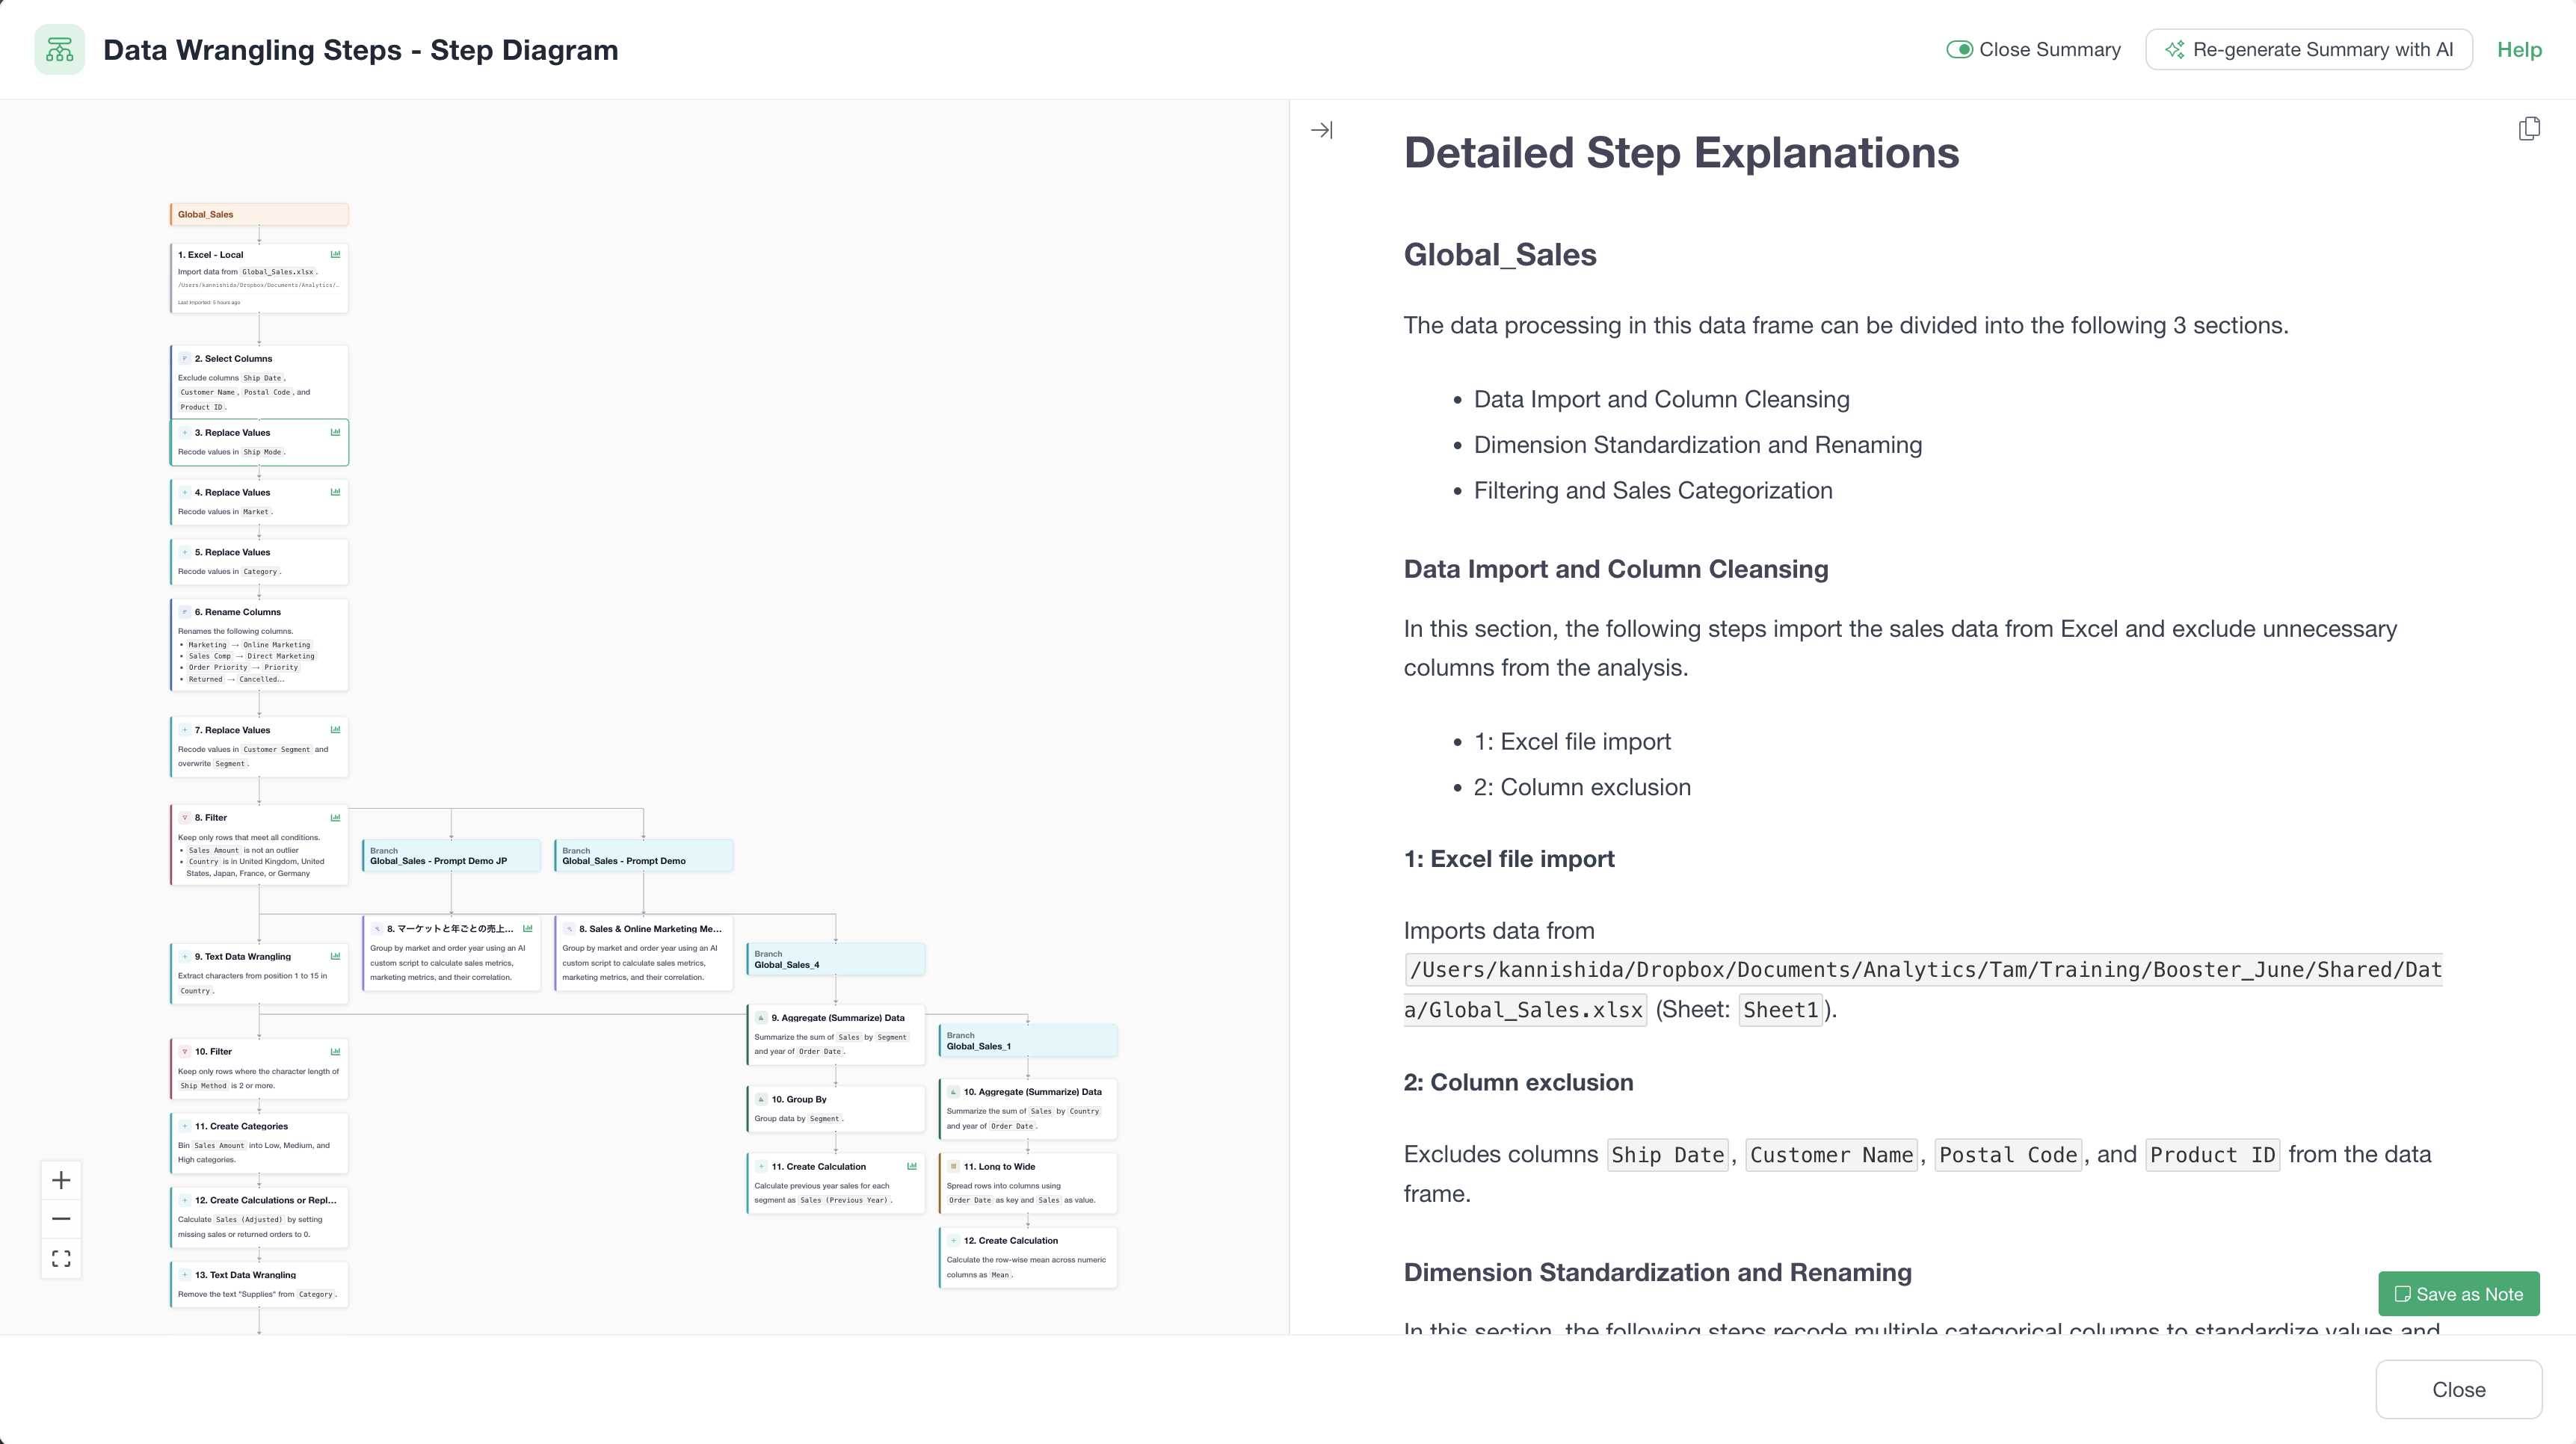
It organizes related transformations into meaningful sections such as:
- importing and cleaning the data
- calculating customer metrics
- joining customer attributes
- preparing the final analytical dataset
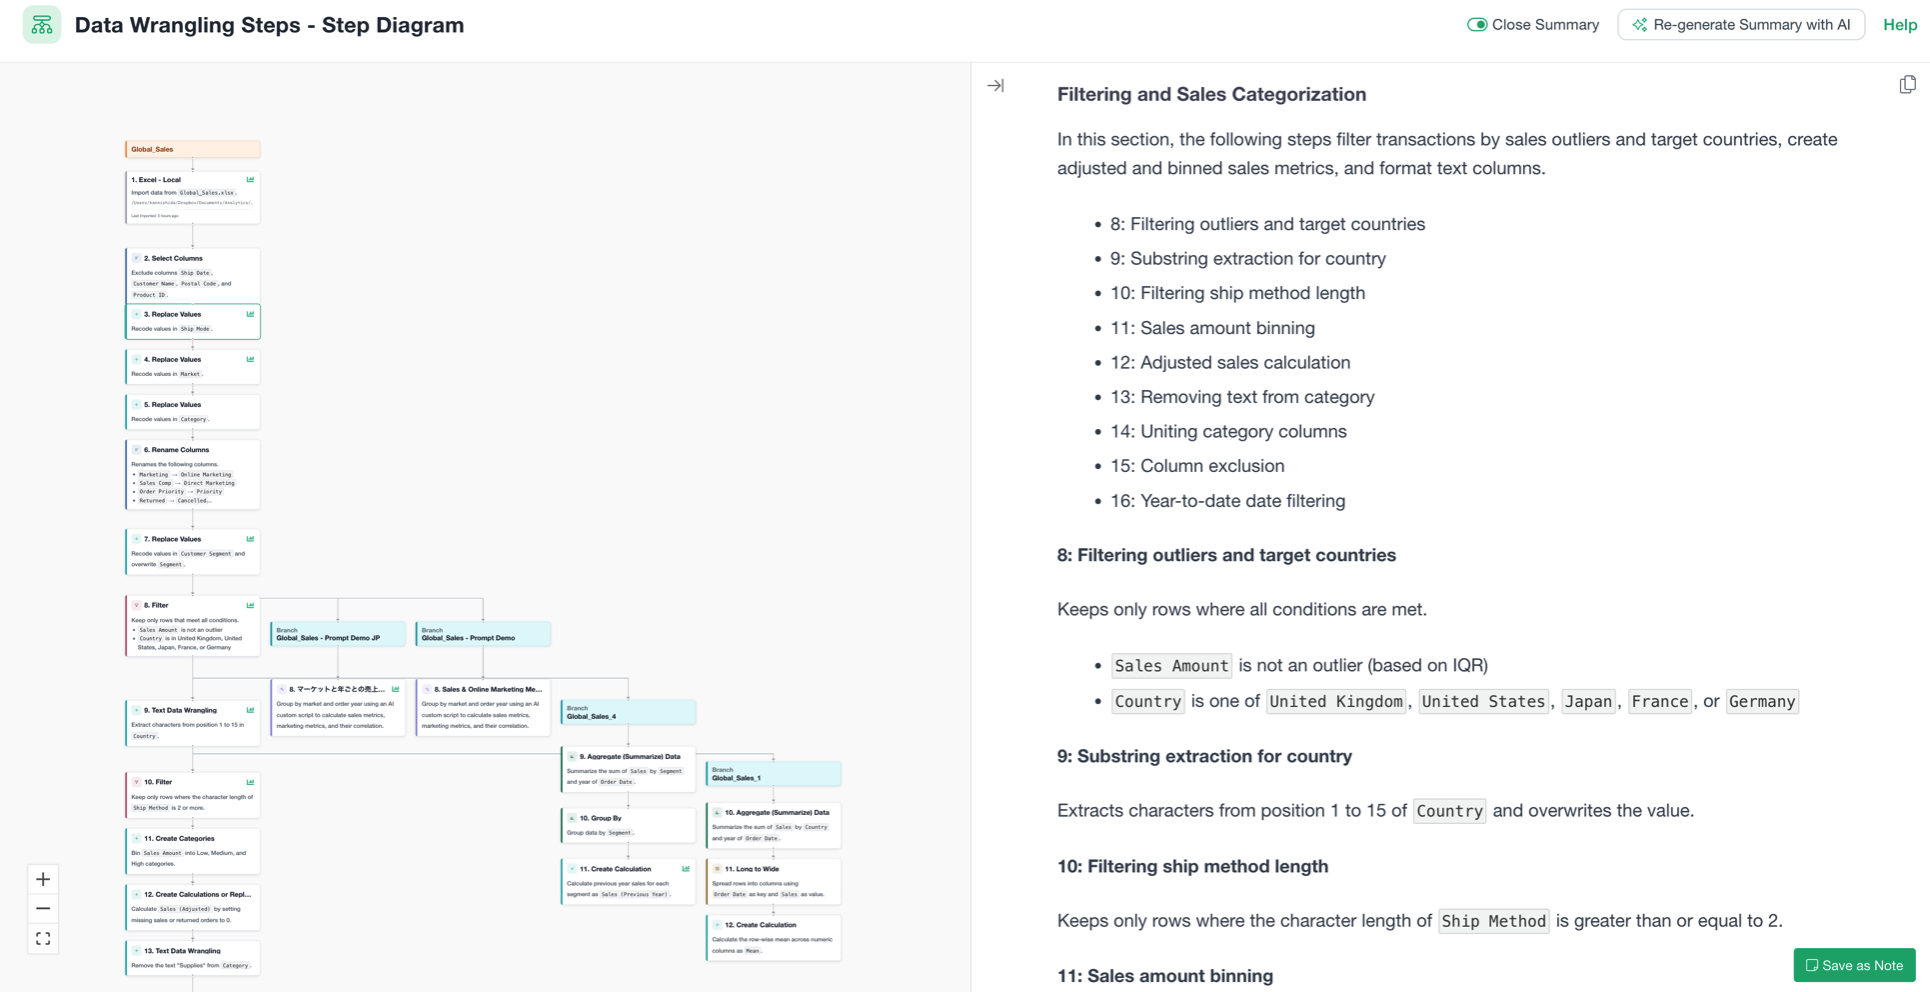
You can then inspect individual steps in more detail.
The generated document can be saved as an Exploratory Note, edited, and shared with others.
This is useful for:
- project handoffs
- peer review
- methodology documentation
- audit and validation
- explaining how reported numbers were produced
Trustworthy analytics needs more than the result.
It also needs the context behind the result.
AI Error Correction: Keeping Reproducible Workflows Reproducible
Creating a reproducible workflow is one challenge.
Keeping it reproducible is another.
Imagine that your workflow expects a column called:
Order Date
But next month’s file contains:
Order_Date
The logic of your analysis has not changed.
The meaning of the data has not changed.
But the workflow breaks.
Or perhaps a date column that previously arrived as a date is now imported as text.
Or you rename a variable earlier in the pipeline, and downstream steps still reference its old name.
These are not unusual edge cases.
They are everyday analytics problems.
Exploratory v15 introduced AI-assisted error correction for data-wrangling workflows.
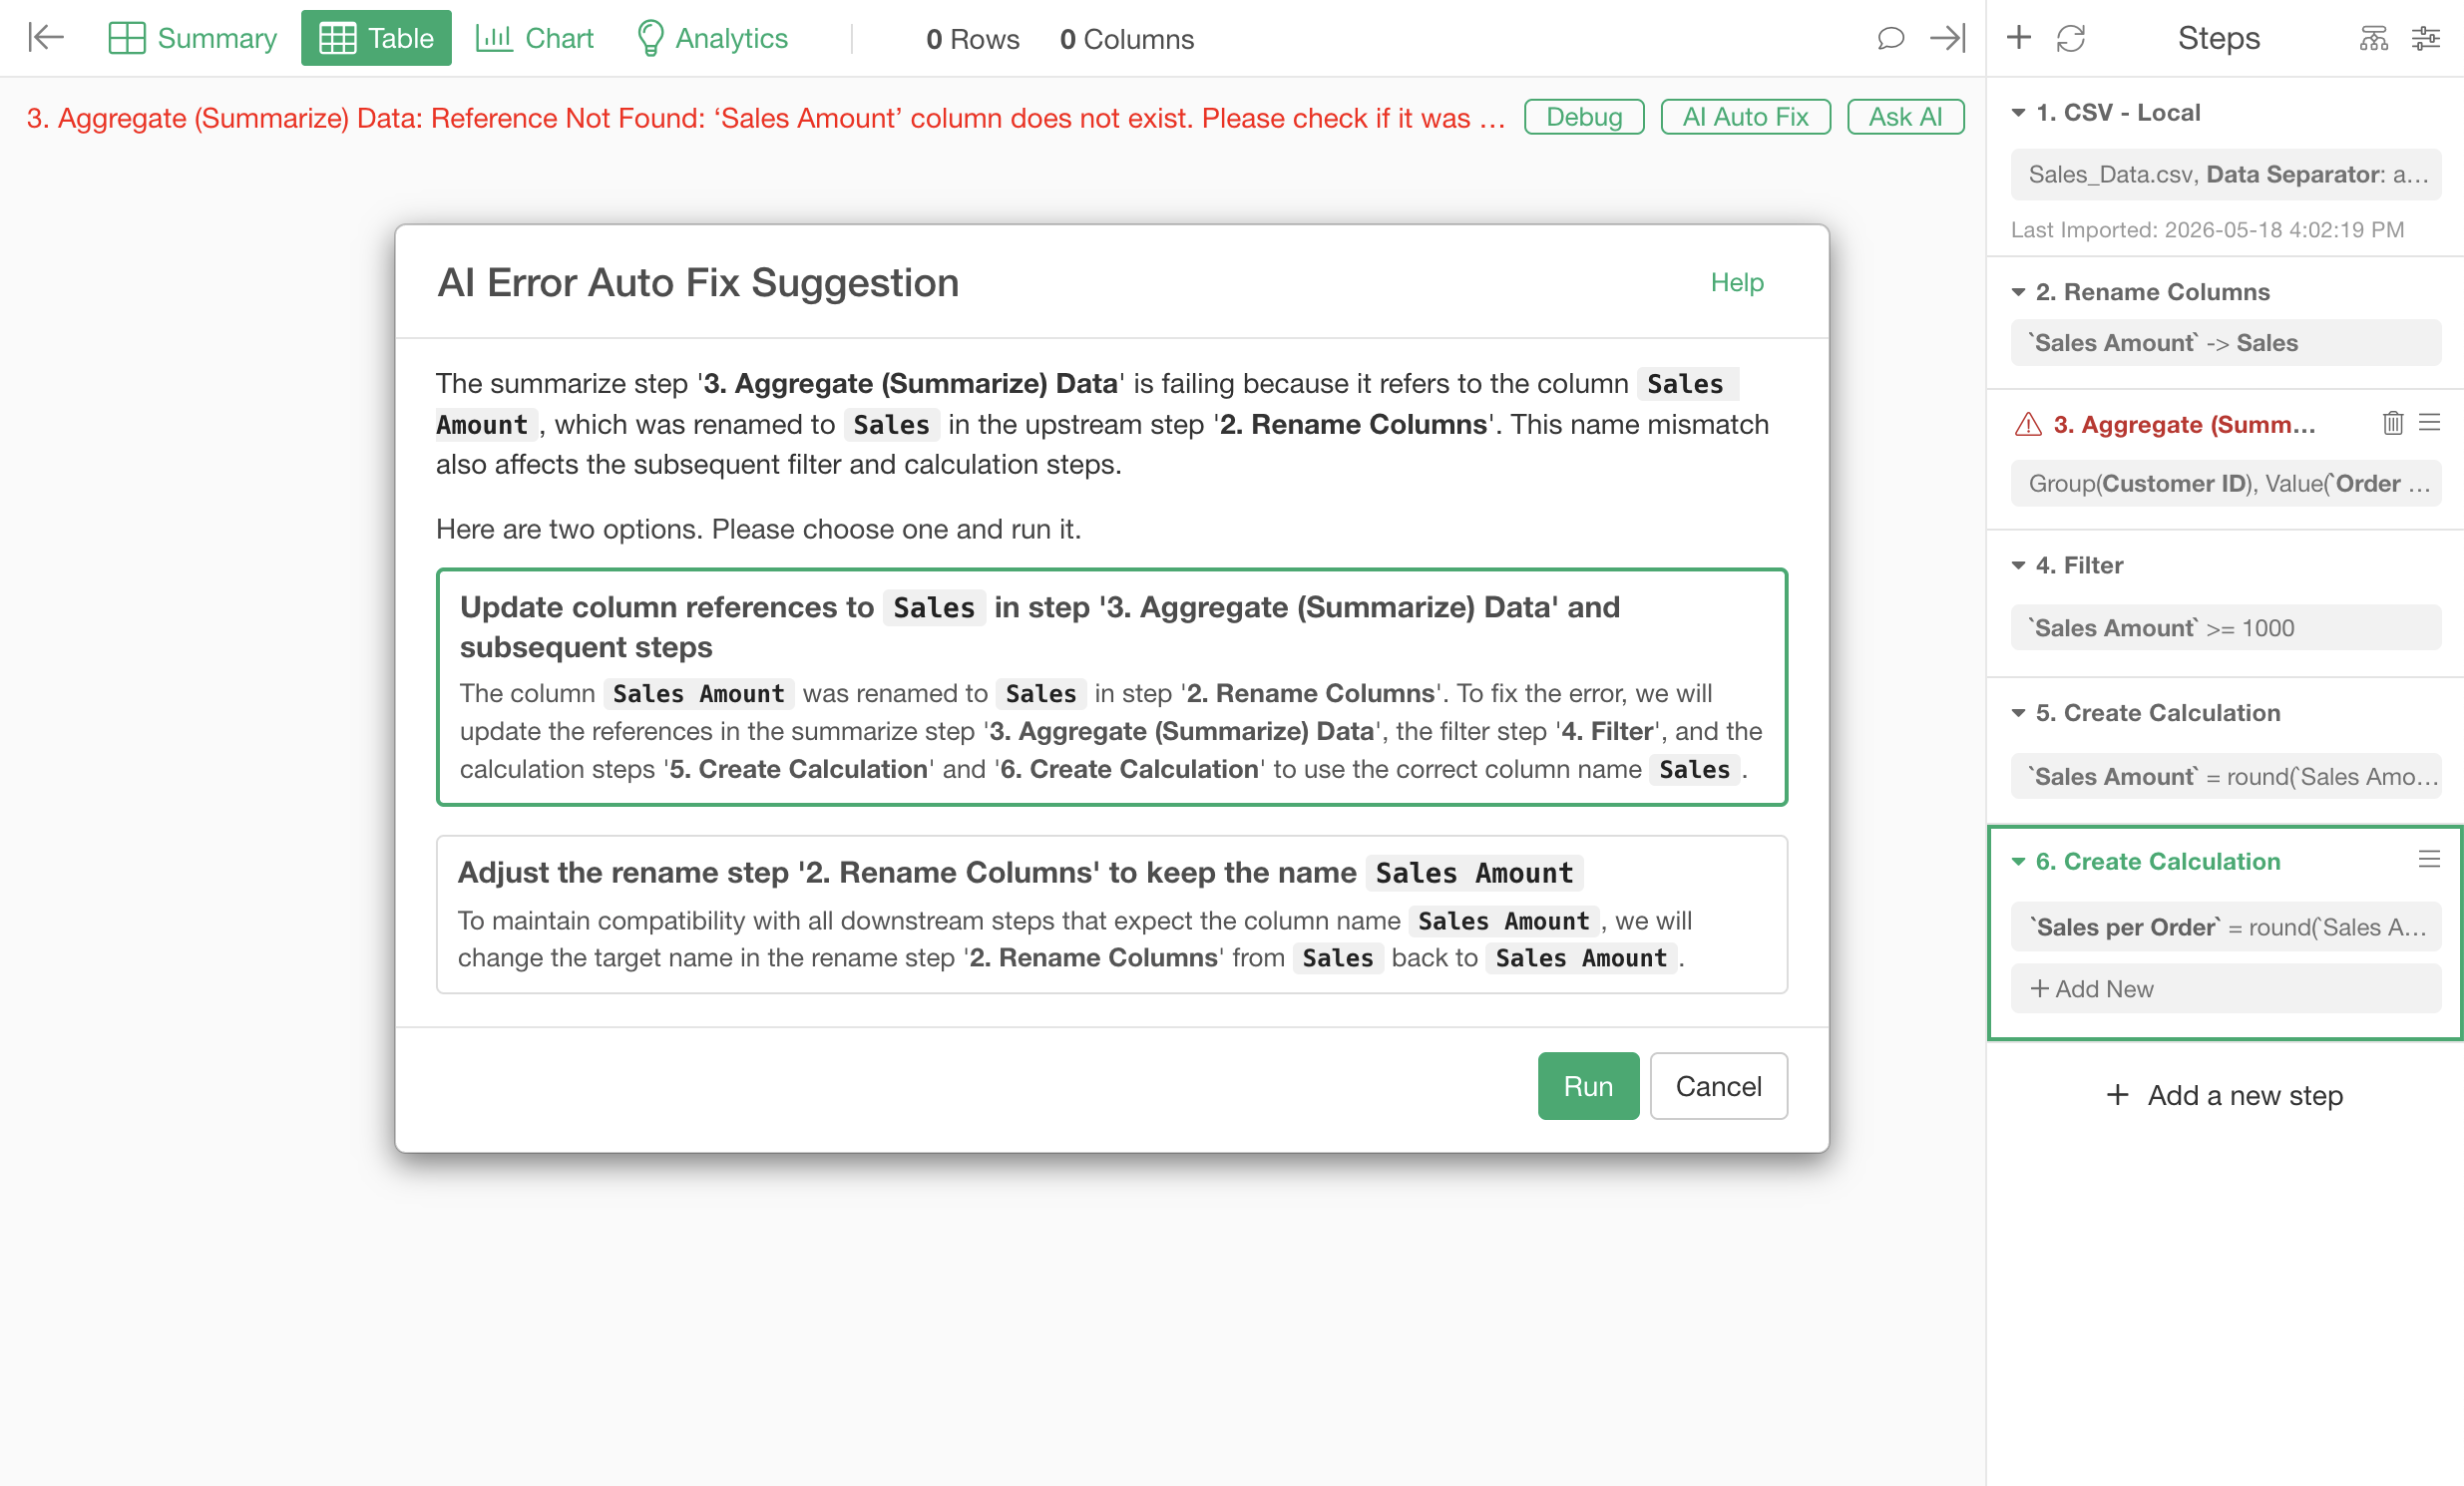
Instead of simply showing an error message, Exploratory can analyze the surrounding workflow and propose a correction that attempts to preserve the original analytical intent.
For example, it may:
- identify a similarly named replacement column
- add a required type conversion
- update downstream references after a column rename
The analyst can then review the proposed change before applying it.
And if the change does not work as intended, version history makes it possible to restore an earlier state.
The point is not to hide errors from analysts.
It is to make workflows more resilient while keeping the analyst in control.
That is what we mean by Reliability.
AI Makes Verification More Important, Not Less
For years, much of analytics tooling has focused on one question:
How can we produce the answer faster?
AI is delivering enormous progress on that front.
But when generating the answer becomes almost effortless, a different question becomes more important:
How do we know the answer is trustworthy?
Can I see which data was used?
Can I understand how it was transformed?
Can I reproduce the calculation?
Can someone else inspect it?
Can I run it again next month?
Will it still work if the input data changes?
These are not secondary concerns.
They are becoming part of the core infrastructure of analytics in the AI era.
Trust Starts With the 3 Rs
AI is going to make analytics faster, more accessible, and more powerful.
That is a good thing.
But trustworthy analytics cannot mean simply accepting whatever an AI system puts in front of us.
The goal is not to remove people from the analytical process.
The goal is to let people spend less time doing repetitive work and more time thinking, questioning, validating, and making better decisions.
For that to happen, our analytics workflows need to be:
Readable.
We should be able to understand how the data became the answer.
Reproducible.
We should be able to run the same analysis again.
Reliable.
We should be able to maintain that reproducibility as the data changes.
These are the 3 Rs of trustworthy analytics in the age of AI.
And they are the foundation we are continuing to build on at Exploratory.
Think Better with Data.
Try Exploratory
Exploratory brings together data preparation, visualization, statistical analysis, and reporting in a reproducible analytics workflow.
With Exploratory, features such as the Step Diagram, AI-generated step summaries, workflow documentation, and AI-assisted error correction make it easier to understand, reproduce, and maintain the analysis behind your results.
Download Exploratory:
https://exploratory.io/download
Start a free trial:
https://exploratory.io/