
Hi there!
It’s Kan from Exploratory. Hope you are doing well.
First, I just wanted to tell you that the early bird discount for our June on-line Data Science Booster training will end tomorrow. If you are interested in learning how to analyze data with various Data Science methods, sign up today!
Now, here’s this week’s update!
What We Are Reading
R 3.5.0 is released - Link
Big changes behind the scenes in R 3.5.0 - Link
There is a new version of R in the house! 🎉
According to David Smith, an R developer advocate at Microsoft:
“Probably the biggest change in R 3.5.0 will be invisible to most users - except by the performance improvements it brings. The ALTREP project has now been rolled into R to use more efficient representations of many vectors, resulting in less memory usage and faster computations in many common situations.”
I’ve heard about this ‘ALTREP’, which is a new way of storing and managing the data inside R to improve the performance. That sounded a lot of works to be done in order to make it backward compatible, which R takes it very serious about. So I expected to see it in a far future. But hey, turned out the future is already here!
“Because R 3.5.0 is a major release, you will need to re-install any R packages you use. (The installr package can help with this.) On my reading of the release notes, there haven’t been any major backwardly-incompatible changes, so your old scripts should continue to work.”
We’re going to upgrade to R 3.5 for the next version of Exploratory, then you will see the performance improvements especially in Analytics areas. Currently, we’re still testing it to make sure everything works just fine. We’ll keep you updated on the progress, so stay tuned! If you want to try an early development build shoot me an email!
What is a Successful Data Analysis? - Link
“How should we measure the success of our data analysis.”
I get this question periodically.
Unlike cost-saving IT projects, which are relatively easy to measure their successes, it’s hard to measure it especially when the organizations are large where it’s hard to measure the impact of anything you do. Roger Peng, a professor at Johns Hopkins Bloomberg School of Public Health, suggests you want to consider something beyond the data analysis itself.
Machine Learning for Product Managers Part II — ML Skills - Link
Machine Learning for Product Managers Part III — Caveats - Link
If you are building products or services, you want to understand the limitations of Machine Learning (ML) before you start, otherwise, you will end up wasting all your money. ML is not what we wish for AI. (“AI - The Revolution Hasn’t Happened Yet”) In these two posts (actually there are three in total), Uzma Barlaskar, a product manager at Facebook, shares great advise on the limitations and the caveats of ML.
Qualitative before Quantitative: How Qualitative Methods Support Better Data Science - Link
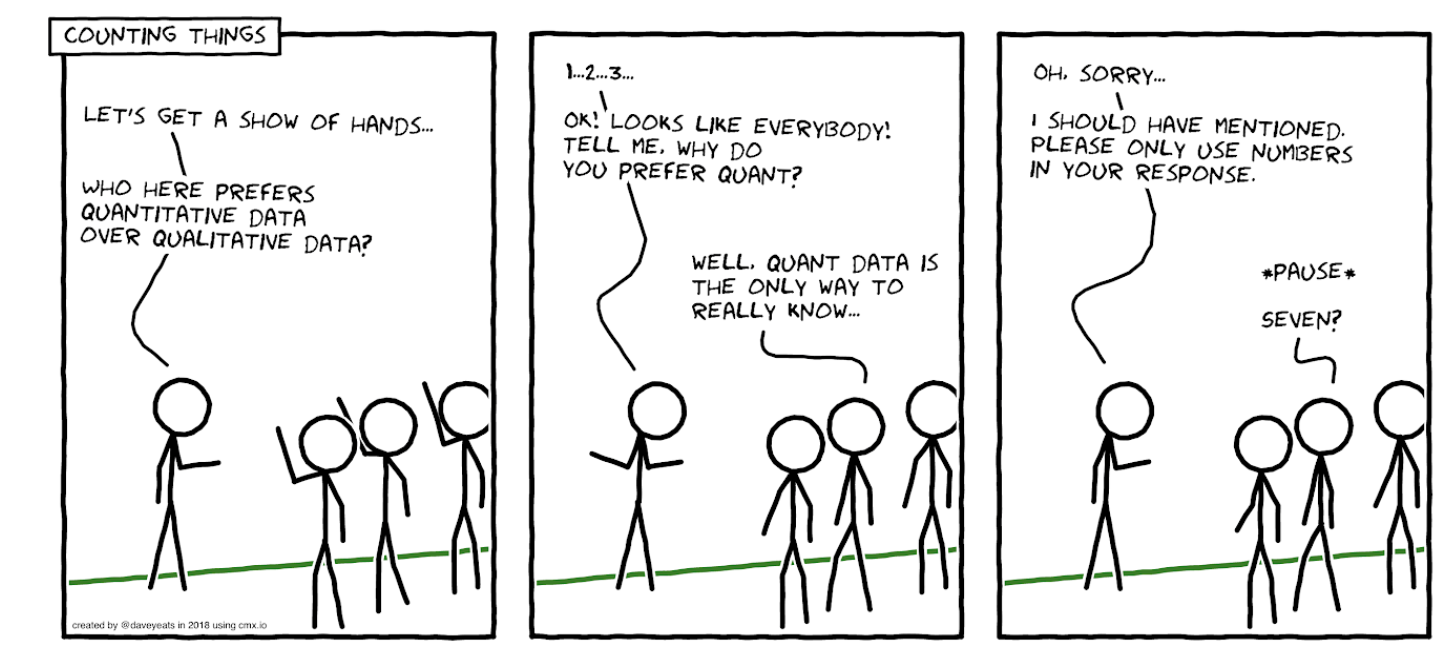
Qualitative research such as one-on-one interview, survey, focus group, observation, etc. tends to be underrated in the world of Data Science where we tend to talk more about prediction quality, not enough about why or causal relationship. But organizations with great data science teams always combine Qualitative and Quantitative analysis. (e.g. “How Netflix’s Customer Obsession Created a Customer Obsession”) In this post, Robyn Rap, a data scientist at Indeed, talks about how they used Qualitative research before building Machine Learning models.
It’s rarely a big deal in R, but I hear about version/package issue from Python devs all the time. - Link
Serious question: I use R, not Python, and while there's the occasional version/package issue in #rstats it's rarely a big deal. But I hear about this from Python devs all the time. What's so different about Python that this is such a thing? https://t.co/g8ddQu2gpt
— David Smith (@revodavid) April 30, 2018
There is a very interesting thread going on at Twitter about Python’s version/package issues.
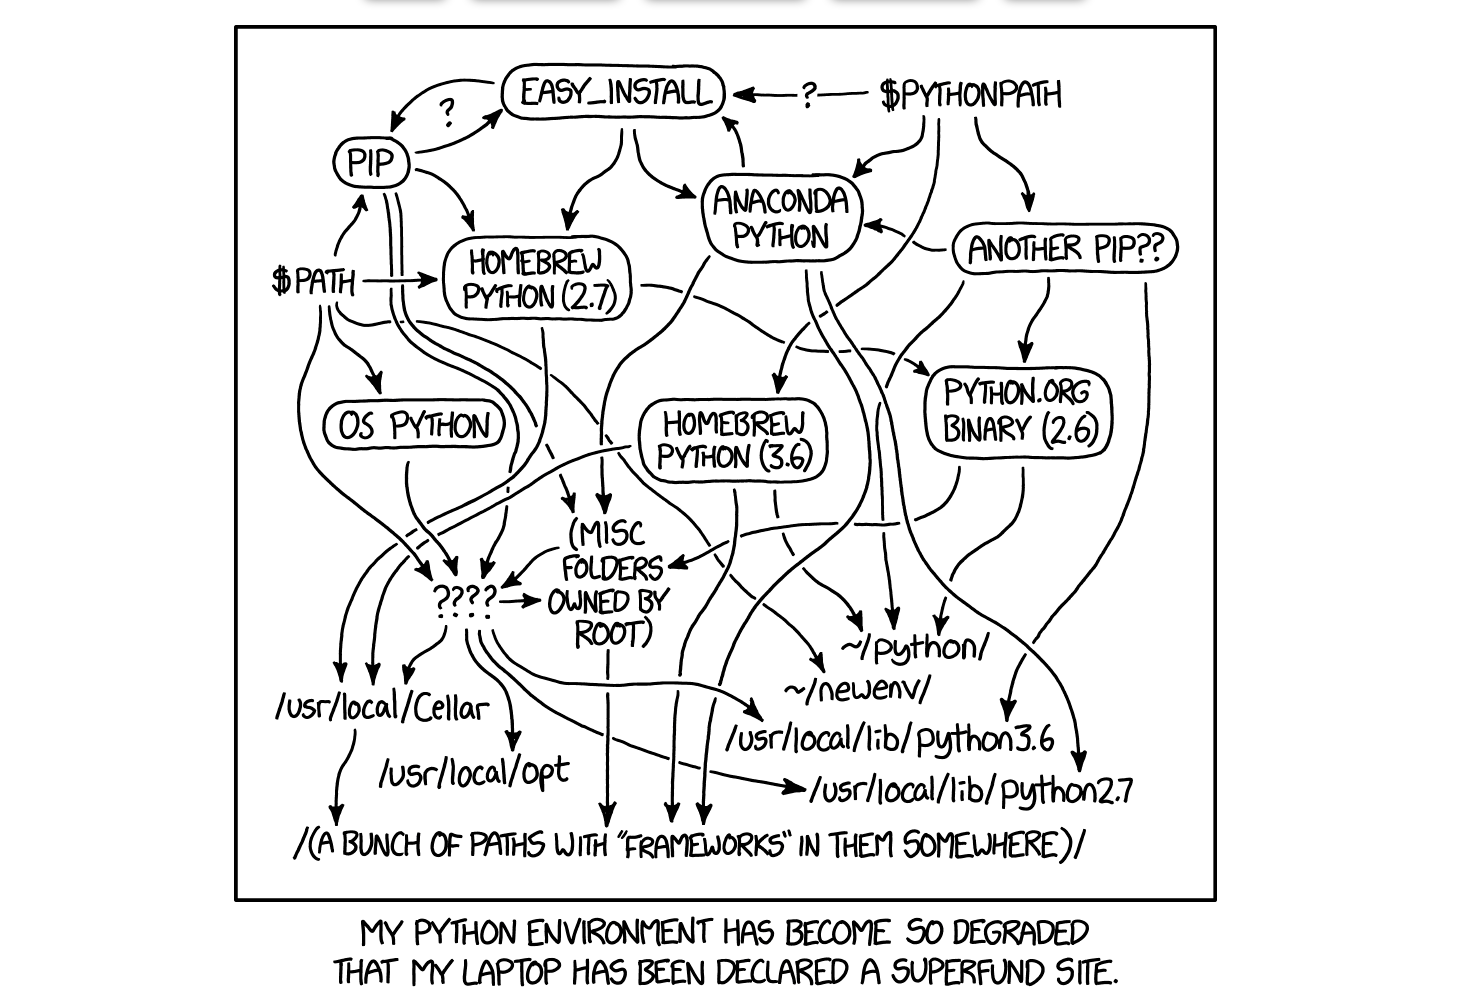
To me, this is not about R vs. Python. Rather, it’s about how lucky we are to have this thing called CRAN (The Comprehensive R Archive Network), which is a repository for R and R packages where you publish your R packages when you build one. We sometimes take it for granted, but because of the system built behind CRAN and the tireless hard work of people behind CRAN, R keeps getting improved with fast and disciplined iterations without breaking the backward compatibility and all the R packages on CRAN just work. This is hard. Big shout out to the amazing R community! 👏👏👏
Others:
Quote of the Week
We’ve had three big ideas at Amazon that we’ve stuck with for 18 years, and they’re the reason we’re successful:
Put the customer first. Invent. And be patient.
- Jeff Bezos, CEO/Amazon
What We Are Writing
We had only one mini post last week… but it’s a useful data wrangling tip! ;)
- Rounding Up Date to Your Own Fiscal Year Period - Link
What We Are Working On
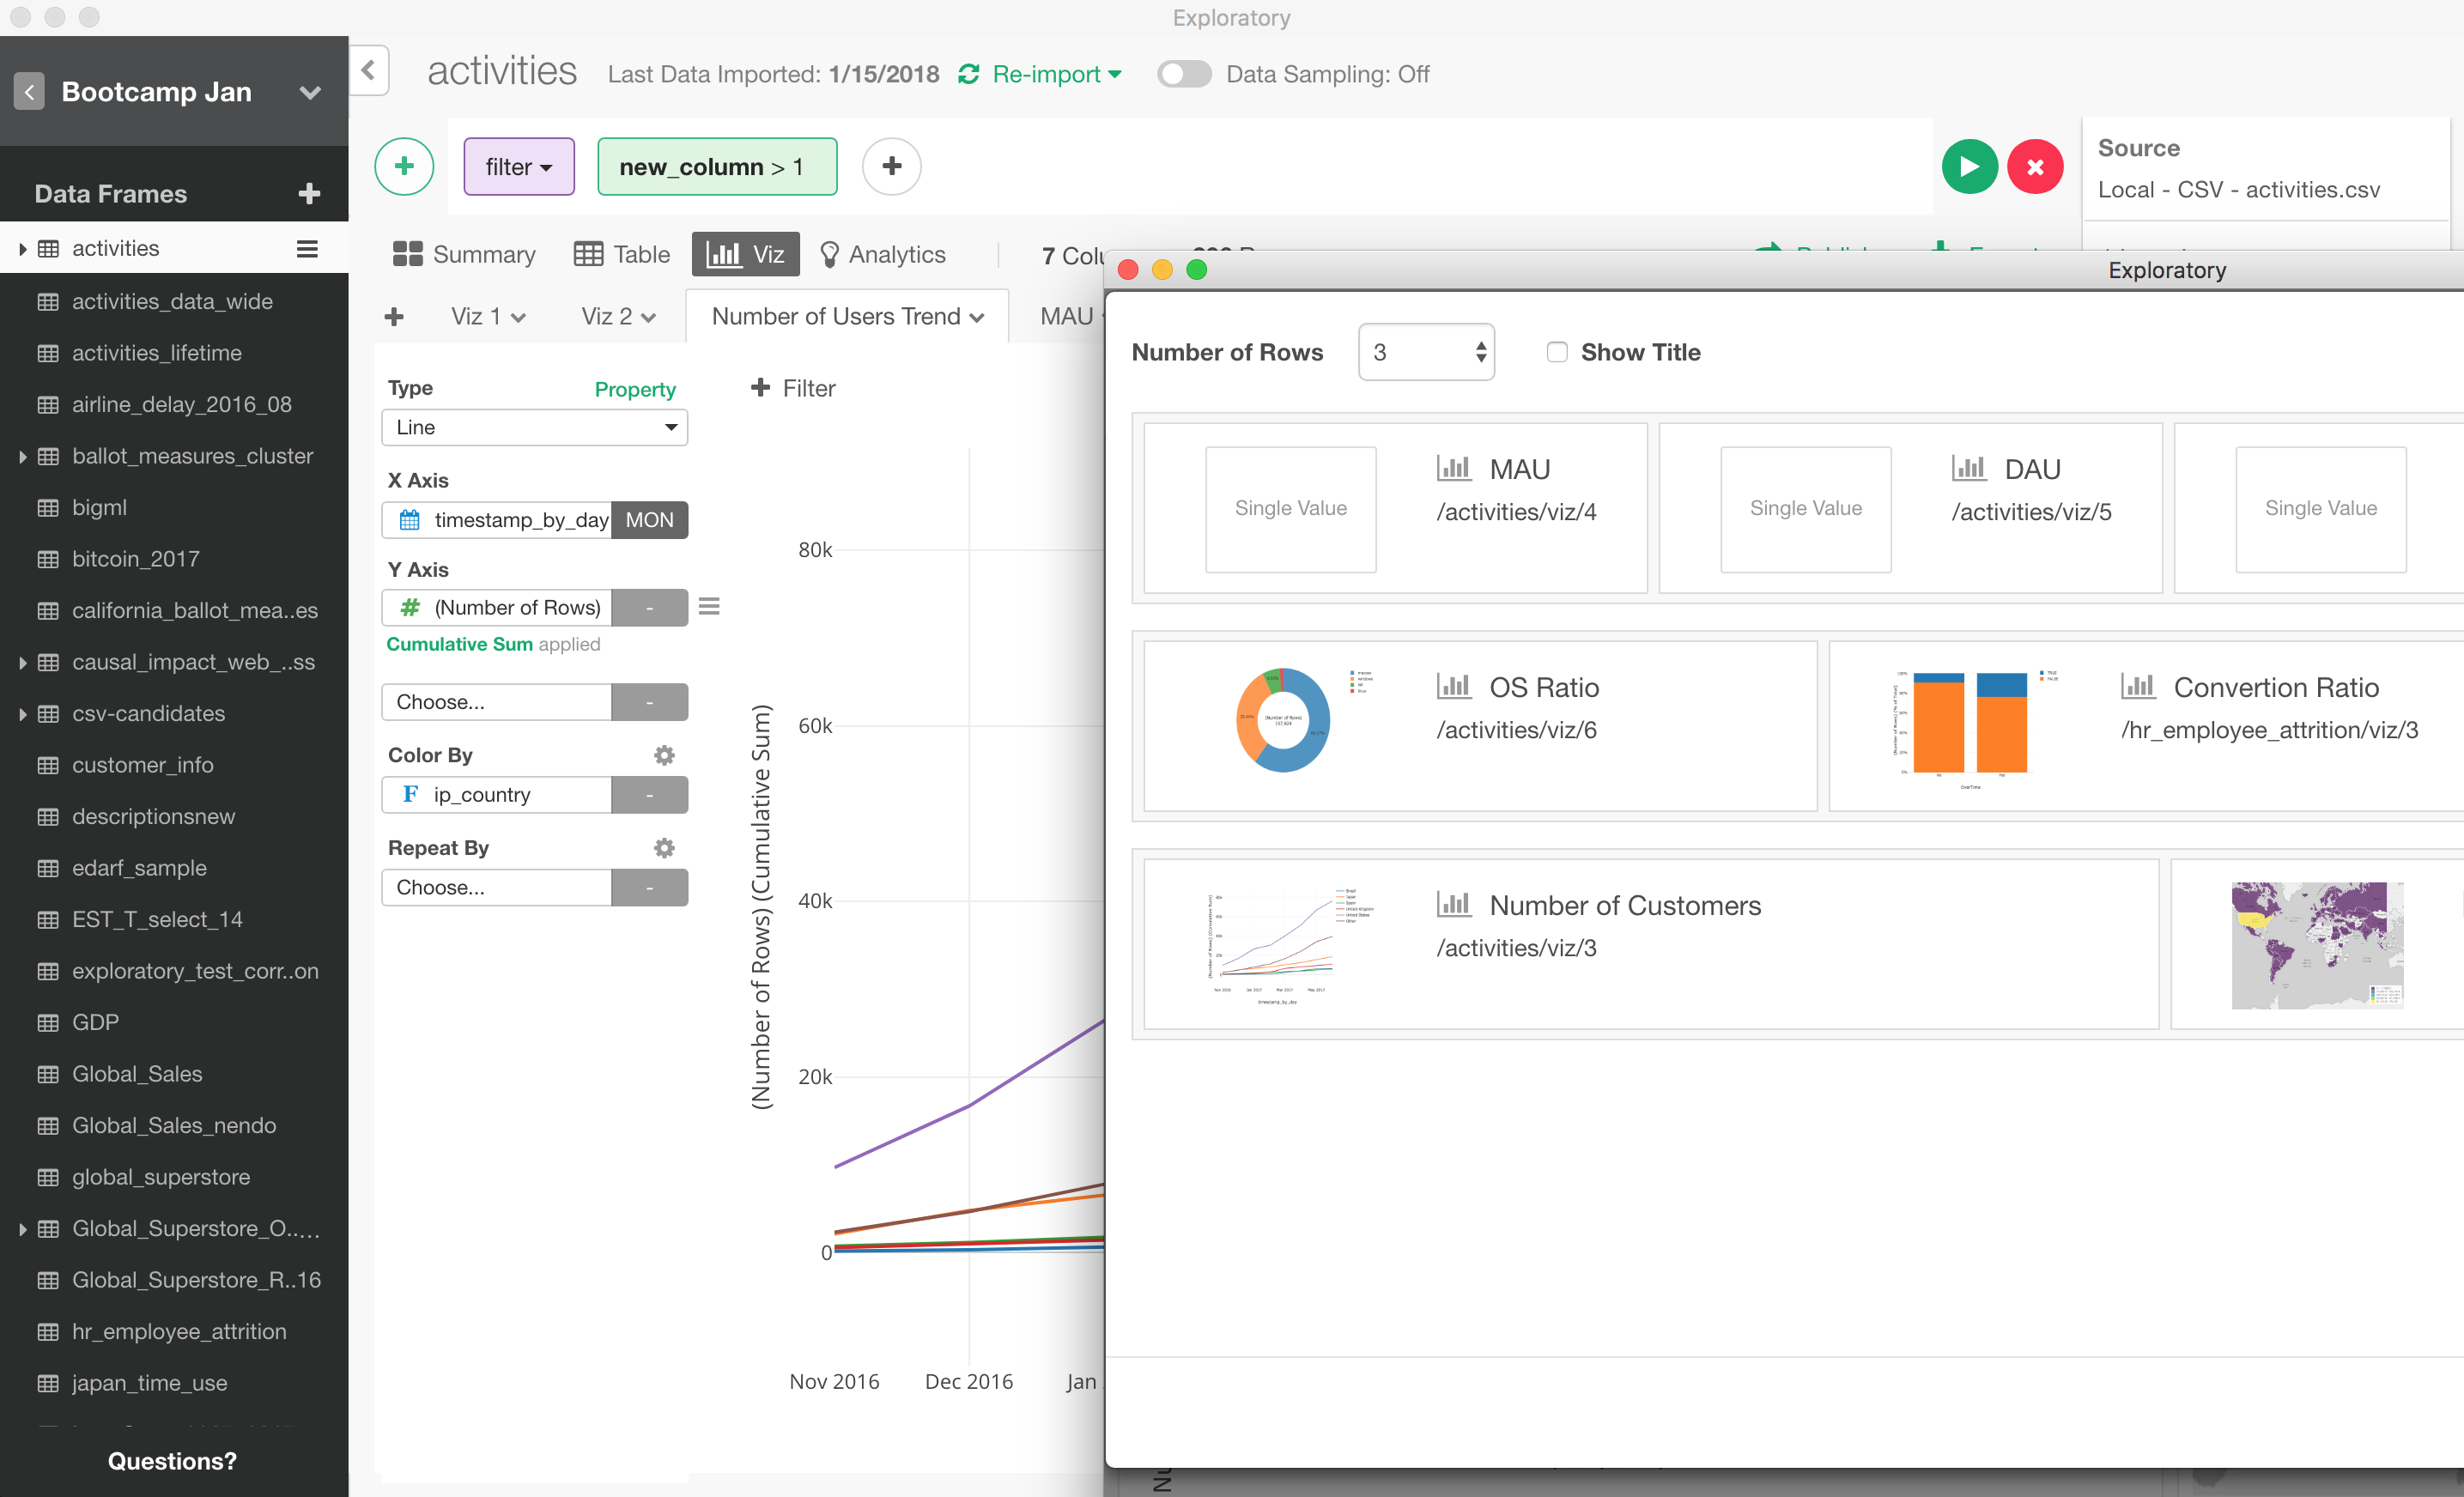
We are adding a support for opening Note, Slide and Dashboard windows separately from the main window.
This doesn’t sound like a big deal to you because most of the applications you use let you do something like this easily. And, you are absolutely right about that! ;) But finally, we have made this work after a week of engineering the details. This will make your productivity 10x up and you will be 10x less annoyed!
And yes, you can configure your Dashboard with a bunch of charts in one window while you update Chart in the main window.
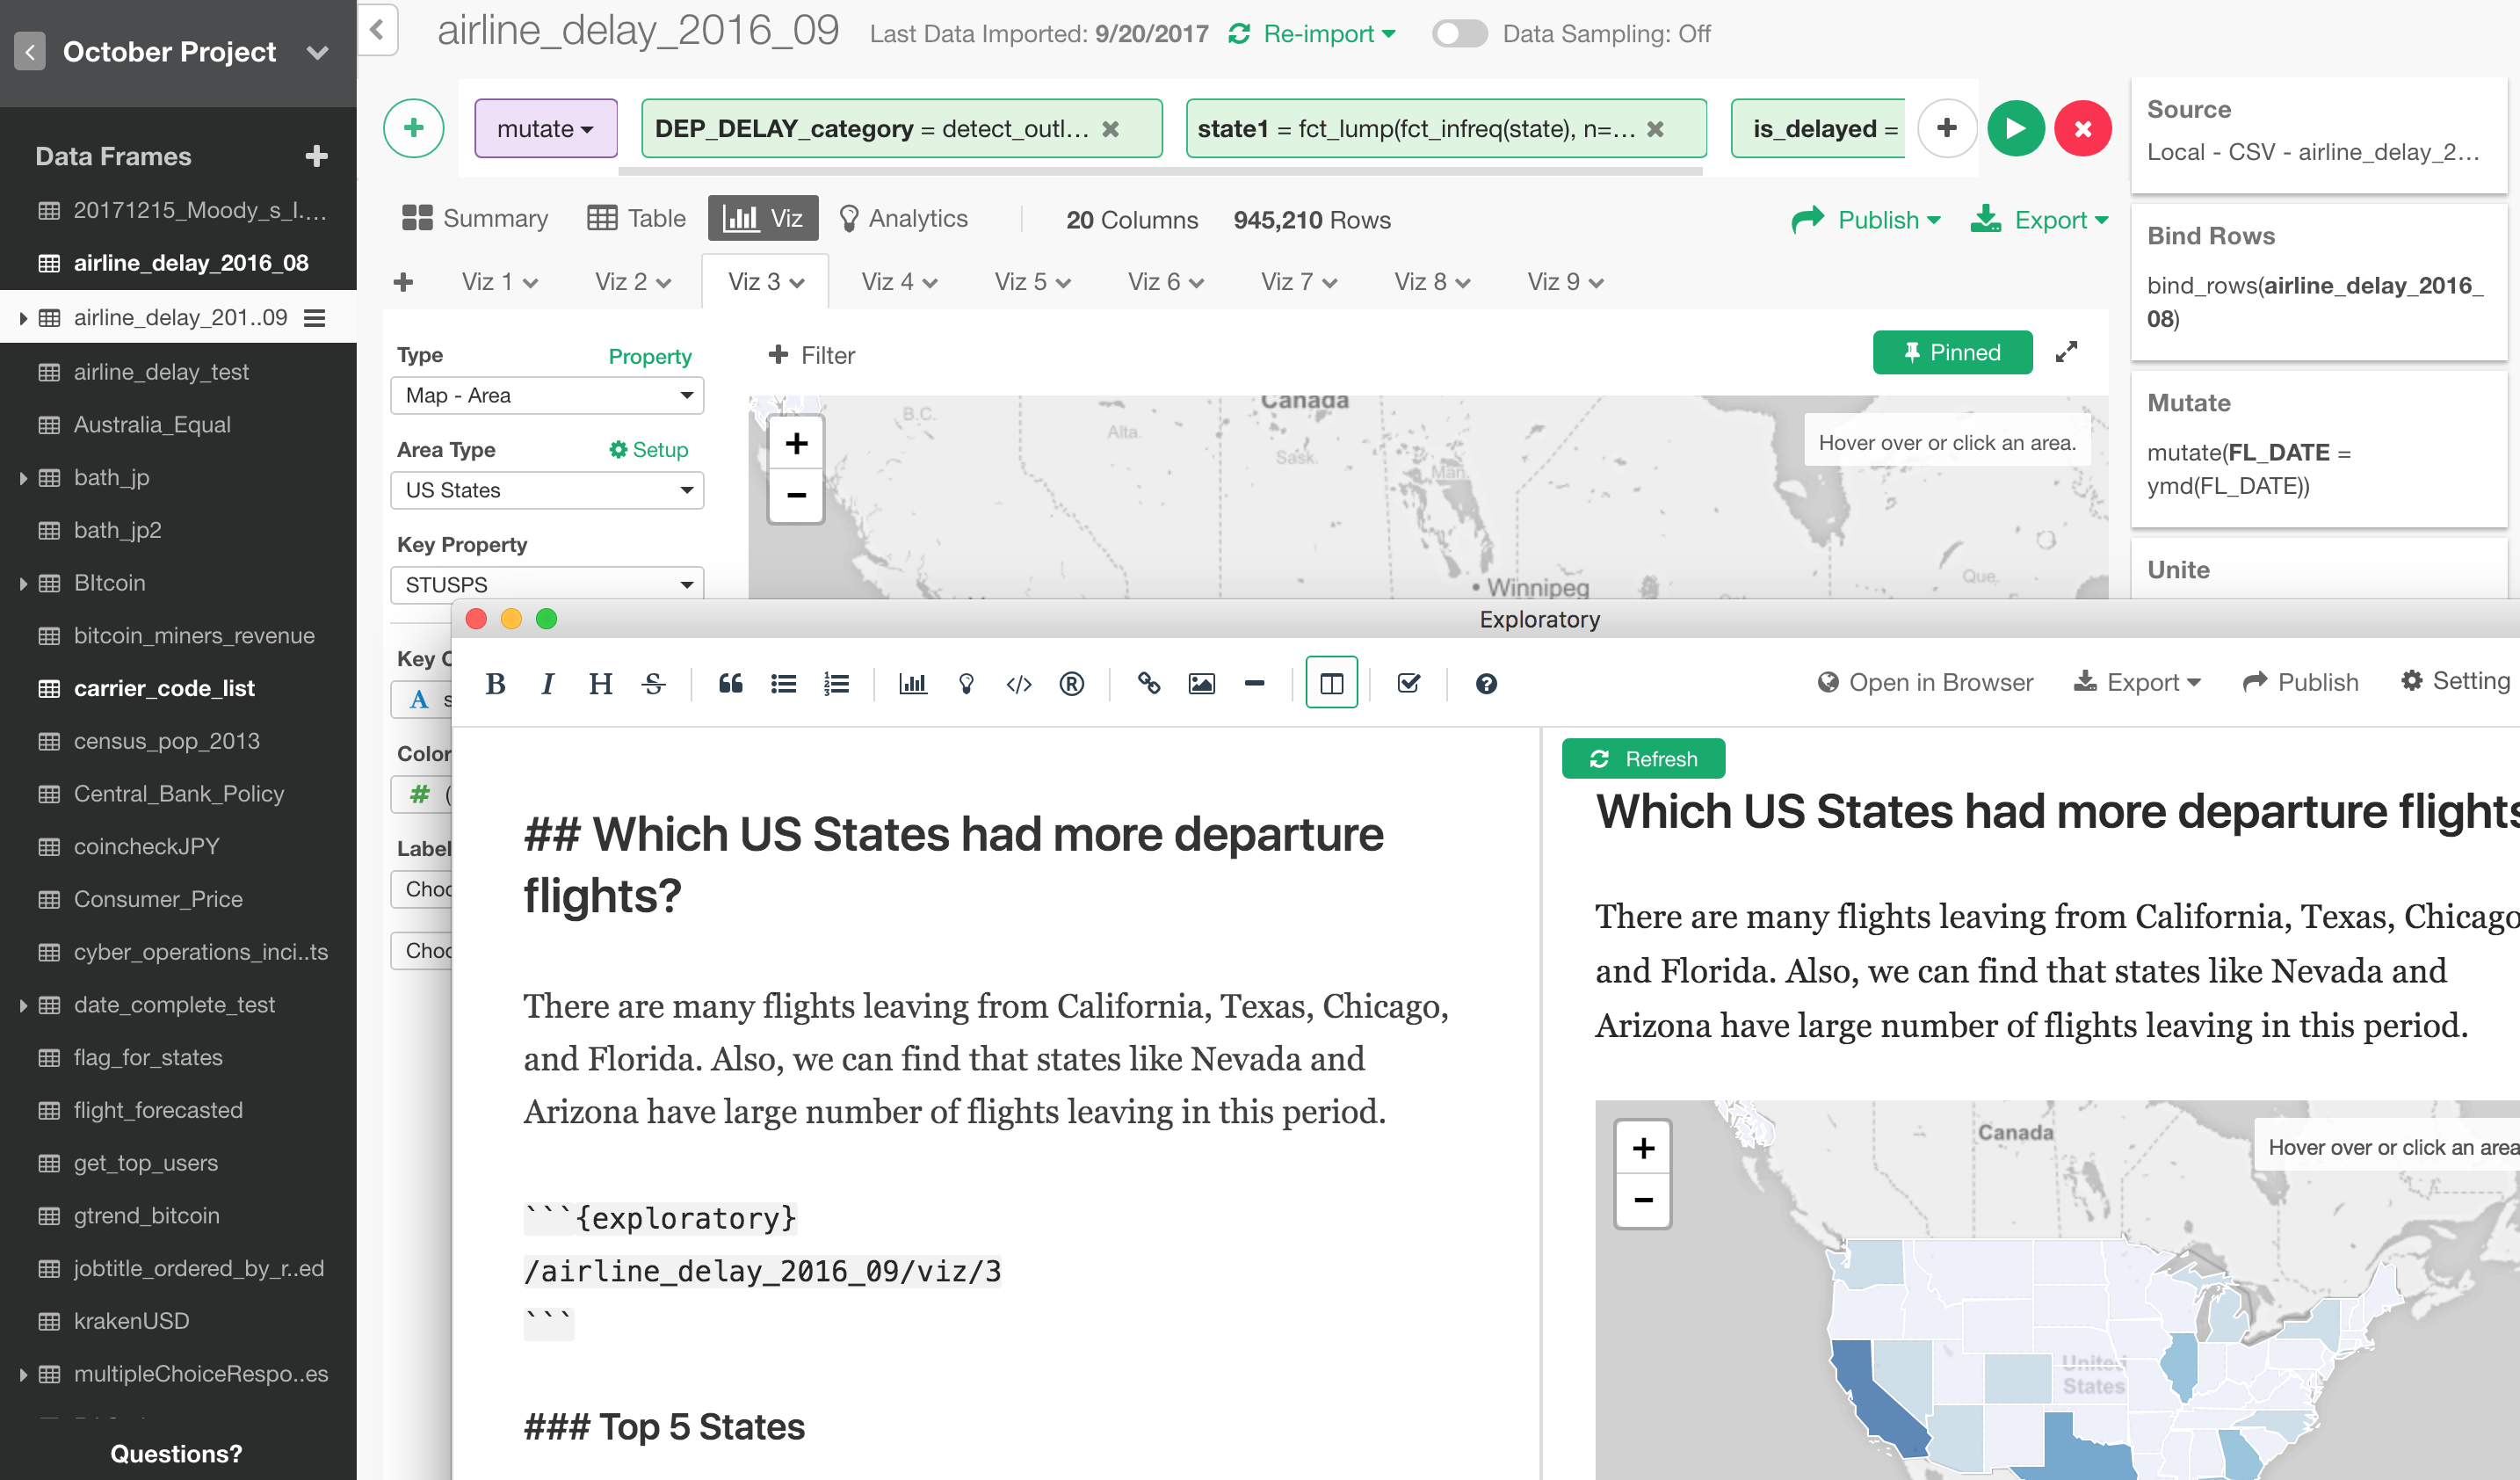
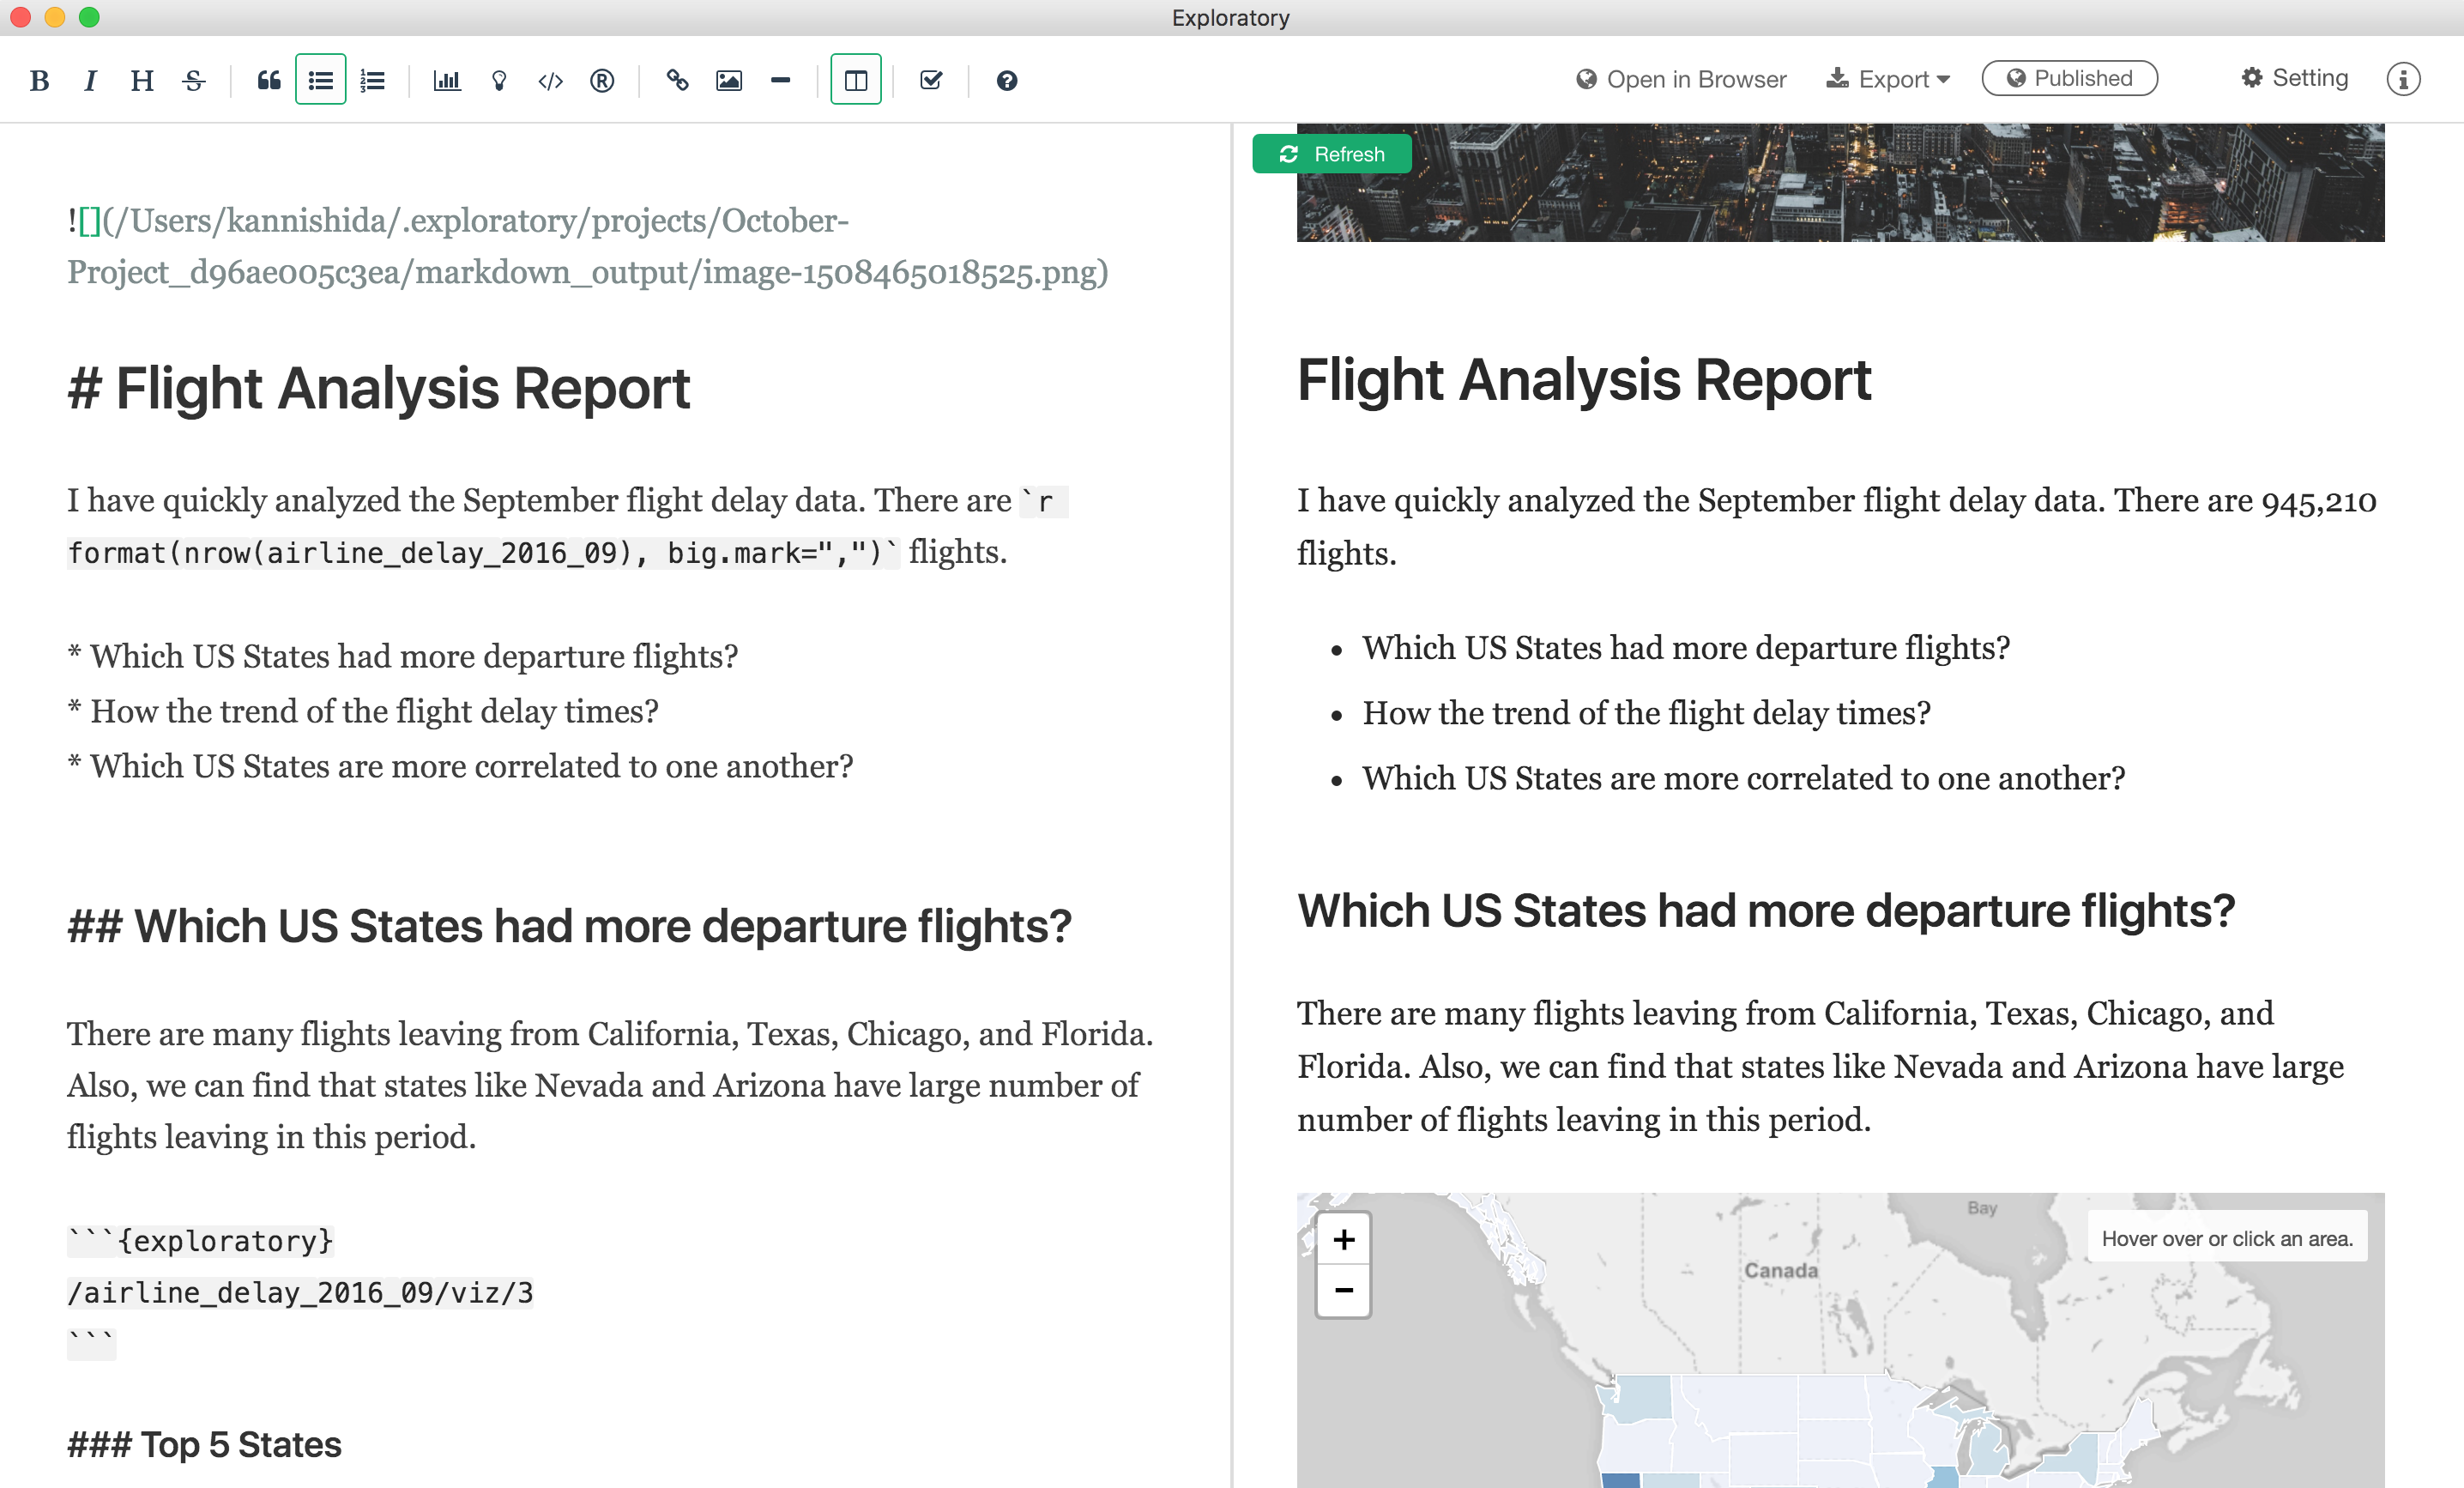
Also, on top of that, we are enhancing Side-by-Side mode where you can write Markdown text at the left-hand side while you can preview the content at the right-hand side. Now you can view the charts and any R scripts being dynamically generated in the preview pane.
Data Science Booster Training
As mentioned at the beginning, the early bird discount for the online Data Science Booster training in June will end tomorrow. If you are interested in learning Data Science without programming, make sure to sign up soon!
If you are a current student, click here to get the student discount.
That’s it for this week.
Have a wonderful week!
Kan CEO/Exploratory
This is a weekly email update of what I have seen in Data Science / AI and thought were interesting, plus what Team Exploratory is working on.