
Hi there!
It’s Kan from Exploratory.
I always thought this American vacation called ‘Ski Week’ was such a cool idea. Basically, the schools are off during the whole week so that families with kids can go skiing. What I didn’t realize until last week was that it also meant that I had to have a baby crying at left-hand side and a pre-school boy begging for playing at right-hand side while I was trying to work on Exploratory. ;)
Anyway, before starting this week’s update, our Data Science Booster training’s enrollment is still open. We have a student discount (50% off). If you are interested in learning Data Science without programming, sign up today!
Now, here’s this week’s update!
What We Are Reading
Machine Learning won’t reach its potential without the human element - Link
Explainability / Interpretability of Machine Learning models is one of the most challenging roadblocks for making Machine Learning be useful for many. We, as consumers of the applications, don’t know if something we read, see, listen, etc. are created by AI and we don’t really know how they are even created. And it turned out that the ones who create them also don’t fully understand the limitations of the algorithm they use and what bias they have in their training data.
This is more of the reason why we need to emphasize more on data analysis side of Machine Learning (or Statistical Learning), which can help us understand the relationships and patterns in data, rather than just getting the result of the prediction. This is not a ‘cool’ message many of us want to hear when we want all the problems to be solved automatically by AI, but it’s an important one. ;)
Once we go beyond this AI automation hype though, people will understand AI is just an extension of our toolkit. It’s more like Augmented Intelligence rather than Artificial Intelligence. And the discussion will become more like, how can we use AI to make ourselves more productive or improve our decision making, rather than worrying about if AI will take over our jobs to improve our productivity.
Big Companies Are Embracing Analytics, But Most Still Don’t Have a Data-Driven Culture - Link
Data savvy tech companies like Google, Amazon, Facebook, etc. are increasingly becoming the existential threat to many businesses. And this makes many companies wanting to build their own data-driven cultures. The problem is that these AI first tech companies didn’t become Data savvy overnight, they started the journey from their very early stage. And this is why it’s called ‘culture’.
But this could be a problem. This recent AI hype might end up making Data Science projects being just another one of those IT driven projects, rather than being a business driven project that would changes the way business folks make their business decisions using data. Creating positions like Chief Data Officer, Chief Analytics Officer, etc. makes people feel good in a short term. But the cultural change takes times and that’s what most of the companies need for the long term.
But, we can also argue that, if only Data savvy companies can be competitive then all companies will have data-driven culture eventually thanks to ‘survival of the fittest’. Companies without such culture will die if all up to the market.
Machine Learning vs. Statistics - Link
If anyone wants to know what is the difference between Machine Learning and Statistics, this is it. It’s not a new blog post from last week, but I have just found it last week and wanted to share.
Others
- How to Reform Worker-Training and Adjustment Policies for an Era of Technological Change - Link
- “We’re in a diversity crisis”: cofounder of Black in AI on what’s poisoning algorithms in our lives - Link
- What is GDPR (General Data Protection Regulation)? Understanding and complying with GDPR data protection requirements. - Link
Quote of the Week
Crypto is decentralizing, AI is centralizing. Or, if you want to frame it more ideologically, crypto is libertarian and AI is communist.
Peter Thiel, Paypal founder, Venture capitalist, etc.
Peter Thiel (Paypal founder, Venture capitalist)and Reid Hoffman (LinkedIn founder, Venture capitalist) discussed tech, politics, etc. One of the topics was AI. They have both very interesting views but differs as a libertarian and a liberal. Strongly recommend watching this recording. Link
Interesting Data
U.S. Economic Sanctions Data
Office of Foreign Assets Control in the Treasury Department publishes lists of the organizations and individuals who are the target of U.S. economic sanctions.
- Specially Designated Nationals and Blocked Persons (“SDN”) - Link
- Consolidated Sanctions List - Link
(Introduced by ‘Data is Plural’.)
Journalist Deaths Around the World - Link
Committee to Protect Journalists collects and publishes data about journalists who have been killed around the world since 1992. It contains the detail data like their nationality, where they were killed, which media outlets they worked for, etc.
(Introduced by ‘Data World’.)
What We Are Writing
Linear Regression is nothing new and nothing fancy in this day and age, but it is still one of the most frequently used Statistical Learning (or Machine Learning) algorithm among Data Scientists / Statisticians for analyzing data due to its simplicity, which makes it easier to work with various problems and also makes it easier to interpret the insights it produces. However, this powerful and useful algorithm is still a bit of mystery for those who are new to the world of Data Science, so I’m starting a series called ‘A Practical Guide of Exploratory Data Analysis with Linear Regression’, and here is the first post.
- A Practical Guide to Exploratory Data Analysis with Linear Regression - Link
Hope this will help many more folks use Linear Regression for their daily data analysis and get more values out of their data.
What We Are Working On
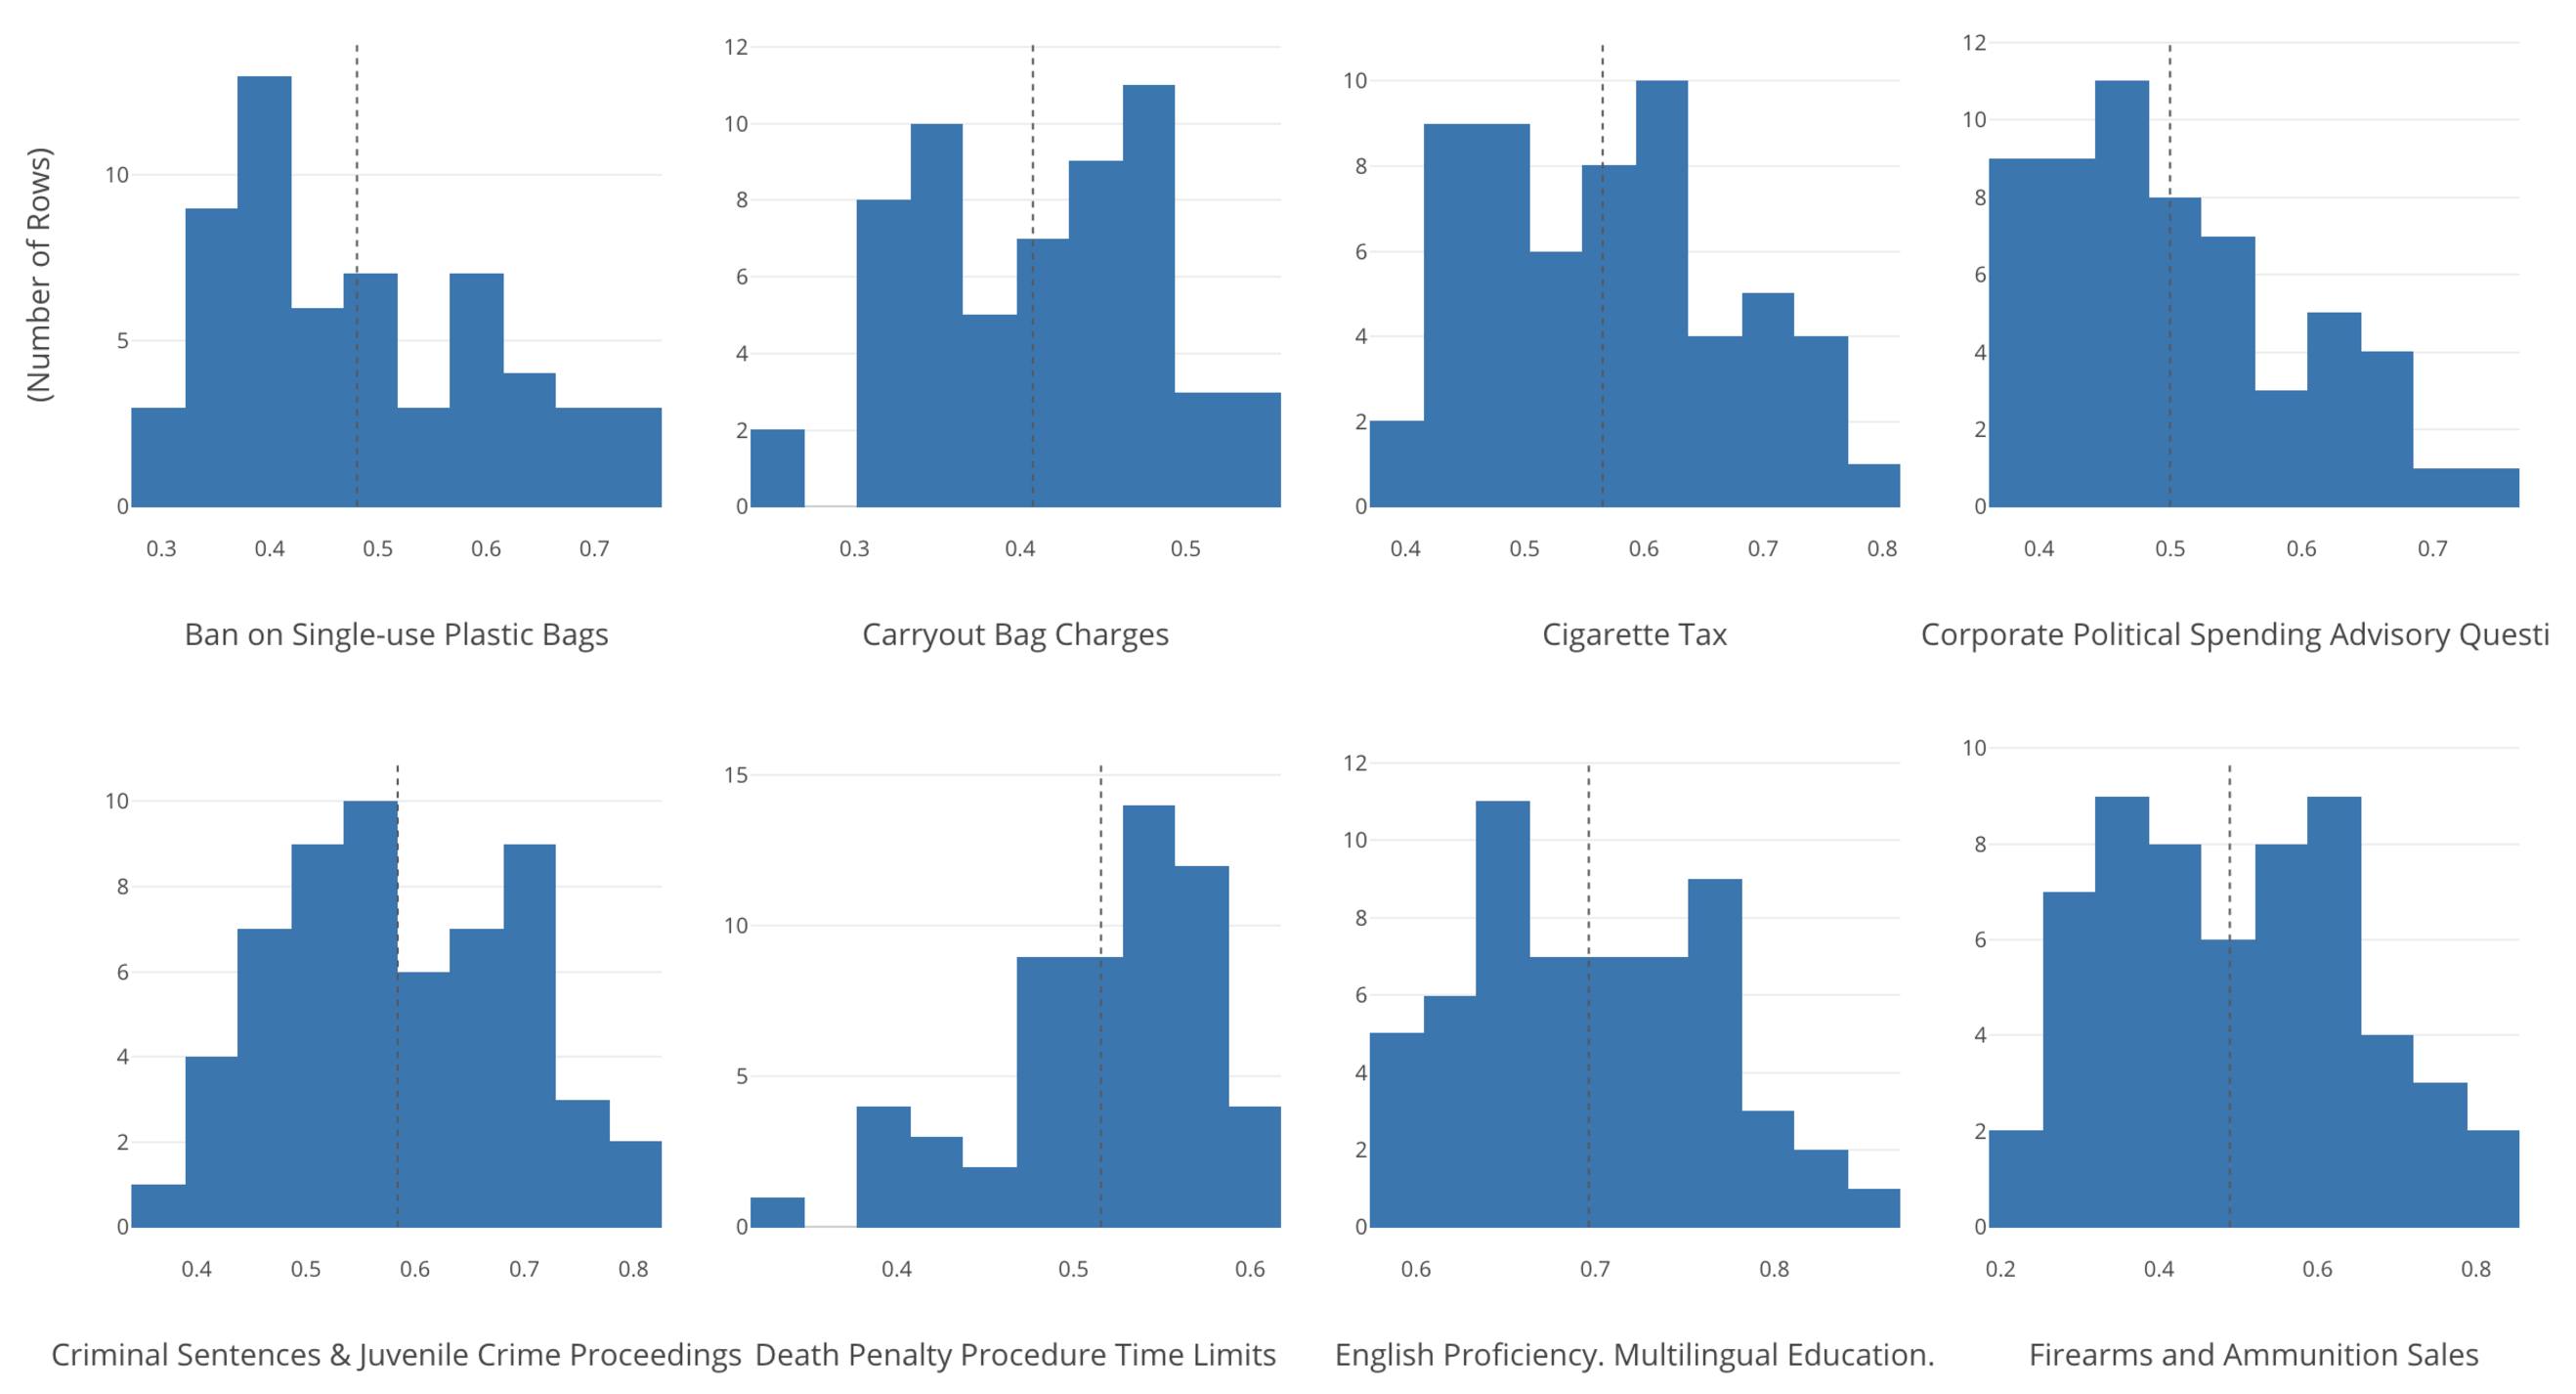
As I mentioned last week, we are adding more Statistical Test capabilities into Analytics View. One of them is Normality Test, which evaluates if a given variable’s data is normally distributed. Some of the statistical algorithms like T-Test, Pearson Correlation, etc. assume the underlying data is normally distributed. Now you can simply select a set of variables and quickly find which variables are normally distributed or not.
For example, I have the following 8 variables whose data distribution can be shown as Histogram.
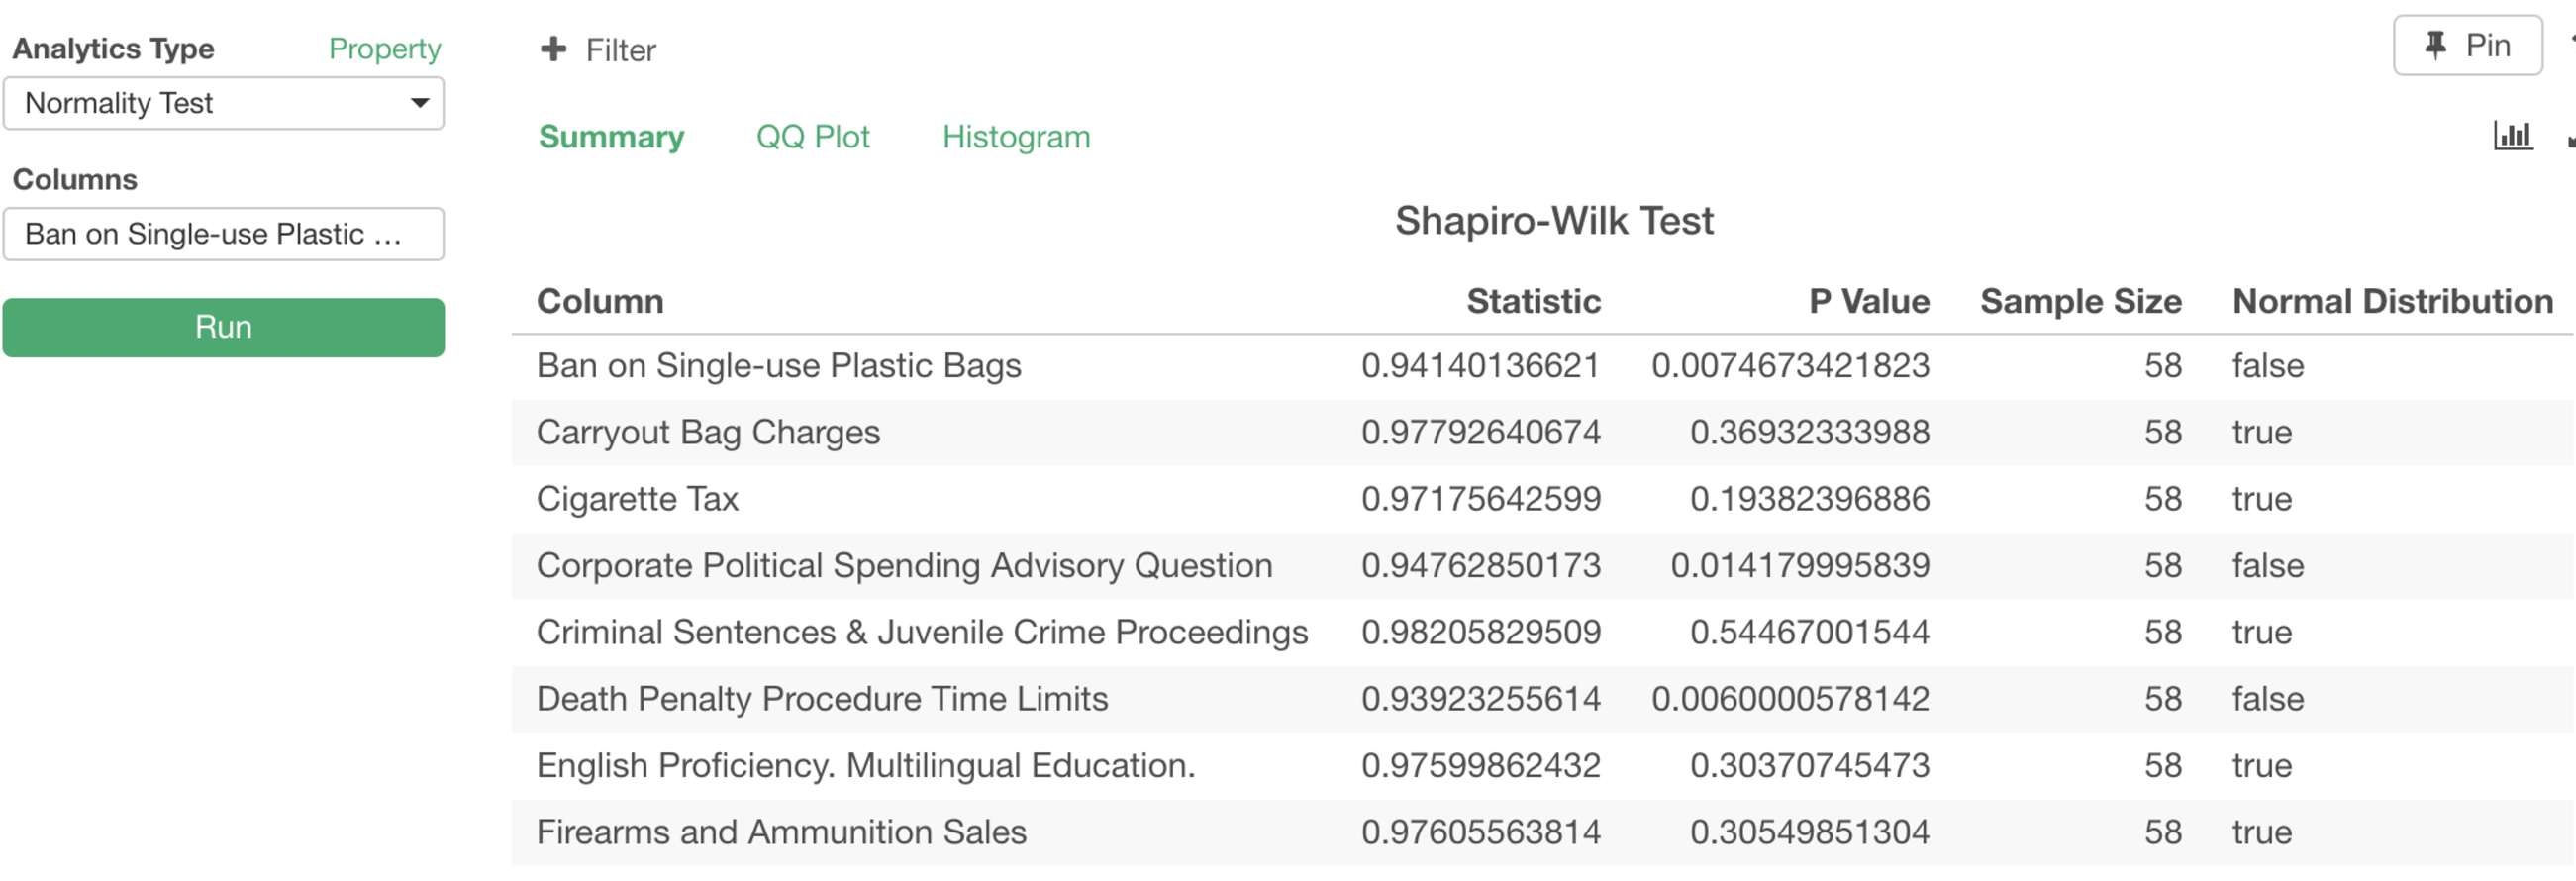
Normality Test (Shapiro-Wilk test) will tell us which variables are most likely normally distributed and which are not.
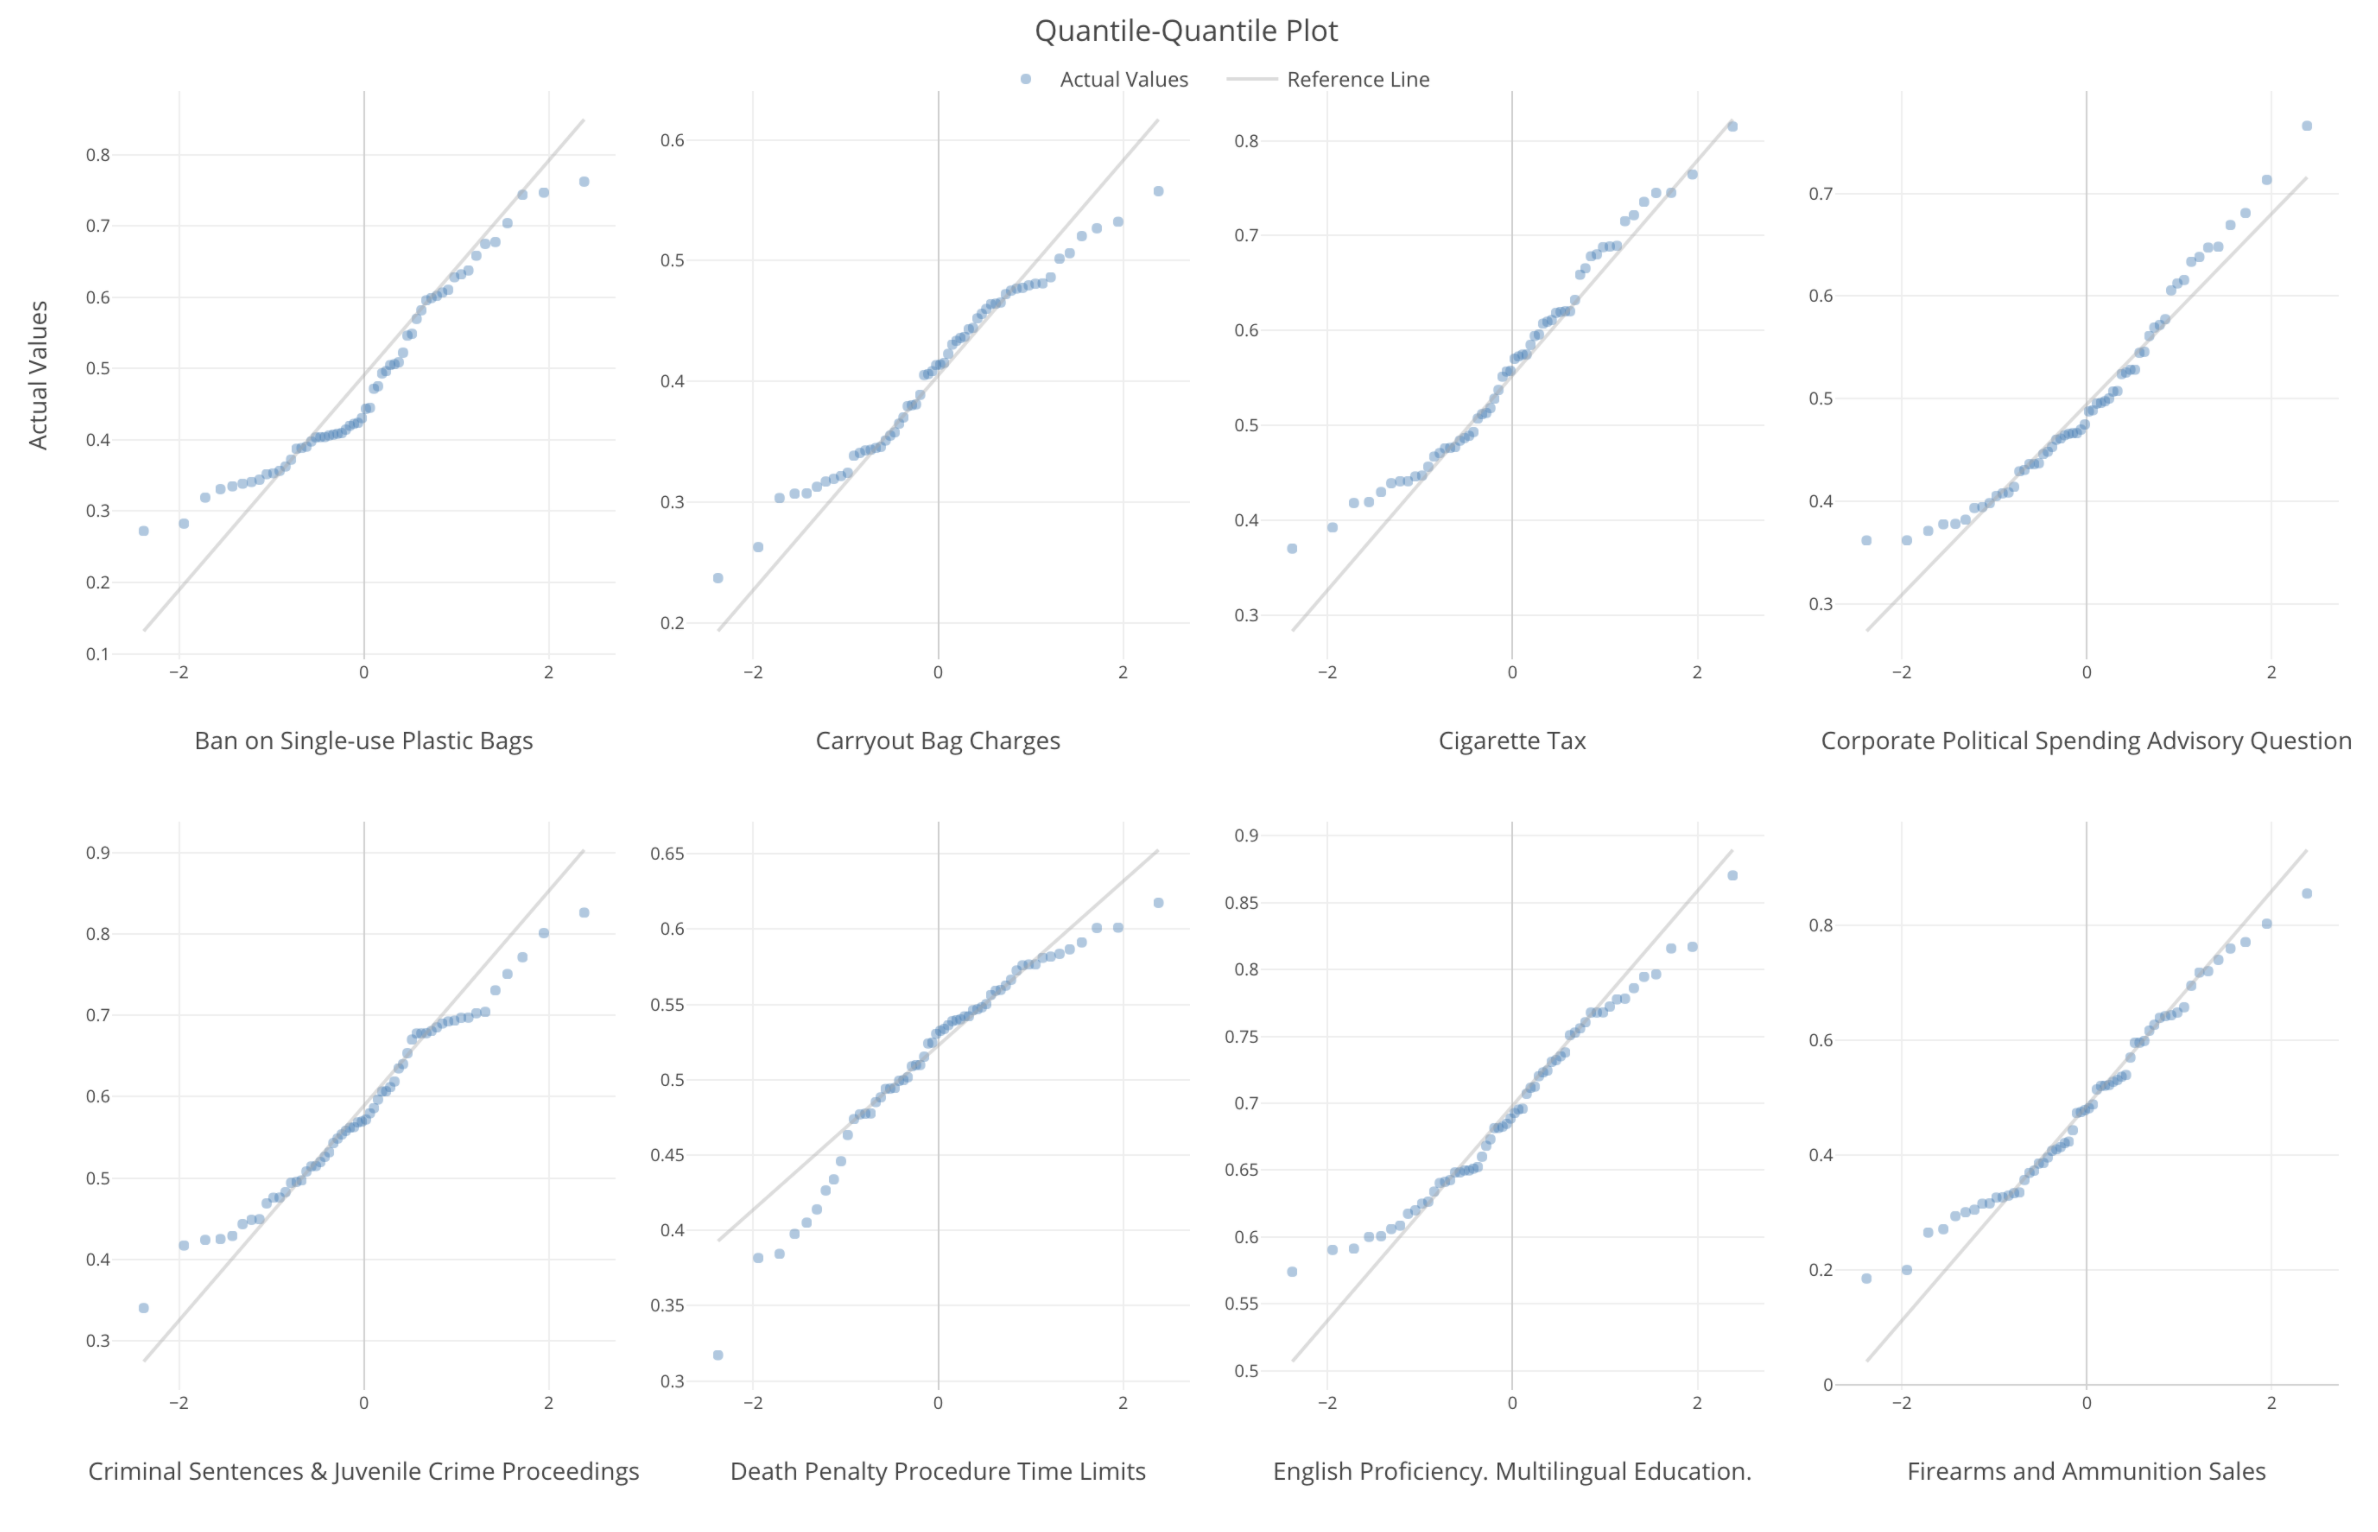
We can also use something called QQ Plot to visualize how the underlying data is close or far from the ideal form of the normal distribution.
Data Science Booster Training
As mentioned at the beginning, our Data Science Booster training’s enrollment is still open. We have a student discount (50% off). If you are interested in learning Data Science without programming, sign up today!
Enroll April Booster Training!
That’s it for this week.
Have a wonderful week!
Kan CEO/Exploratory
This is a weekly email update of what I have seen in Data Science / AI and thought were interesting, plus what Team Exploratory is working on.