
“If you can’t measure it, you can’t improve it.”
by Peter Drucker
Hi there!
It’s Kan from Exploratory.
It’s already September! We have only 4 weeks to go before releasing Exploratory v5.0! There is a lot going on with v5.0 and it’s going to be great. But honestly, it’s a bit overwhelming with the deadline approaching…😱
Anyway, here’s this week’s update!
What We Are Reading
Tesla, software, and disruption - Link
Tesla is the latest example of “Software eating the world”. iPhone defeated Nokia, Motorola, RIM, Panasonic, Sony, etc. with Software. Does Tesla defeat American, German and Japanese automakers?
This time is not just about Software, but also about Data, especially for autonomous. Benedict Evans, an analyst at A16Z (a successful venture capital in Silicon Valley), wrote a well thought essay on how to think about Tesla in terms of whether it is a disruptive innovation. As always with his essays, things are not as simple as they look.
Models Will Run the World - Link
In the startup world, we call it ‘Data Network Effect’. More data can make your service better, which can attract more users, which can bring more data, and that will make your service even better. It’s a virtuous cycle once it starts working. Tesla mentioned in the above article is one of such products.
I’m not sure about the word ‘Model Driven’ business and I’m skeptical when people make it sounds that the business can be run automatically by the machine learning models. But still, I’m finding this article published at Wall Street Journal useful for anyone who is interested in Data Network Effect.
What is the measure of success for the YouTube algorithm?
Often we mistake, but different business models have different business goals. And different business goals have different measures of the success. And, when you have different measures, then your recommendation or prediction models would be very different even when you have a same kind of data.
The type of things Youtube would recommend is very different from what Netflix would recommend.
Here’s what ex-googler who was working on the Youtube recommendation algorithm had to say.
The YouTube algorithm I worked on heavily promoted Brexit, because divisiveness is efficient for watch time, and watch time leads to ads.
— Guillaume Chaslot (@gchaslot) September 2, 2018
Brits deserve deserve to know what @YouTube's AI promoted by the millions during the referendum.
Without transparency there is no democracy https://t.co/UPclipTfZX
What We Are Writing
Here are some blog posts I have written or updated recently.
What We Are Working On
Exploratory v5.0
We are adding K-means Clustering to Analytics view in v5.0!
In v4.4.x, you can already run the K-means as the data wrangling step, which gives you a scored data. Then, you can visualize the result the way you want.
But the problem is, it’s not like everybody knows how to visualize the result to understand the characteristics of each cluster.
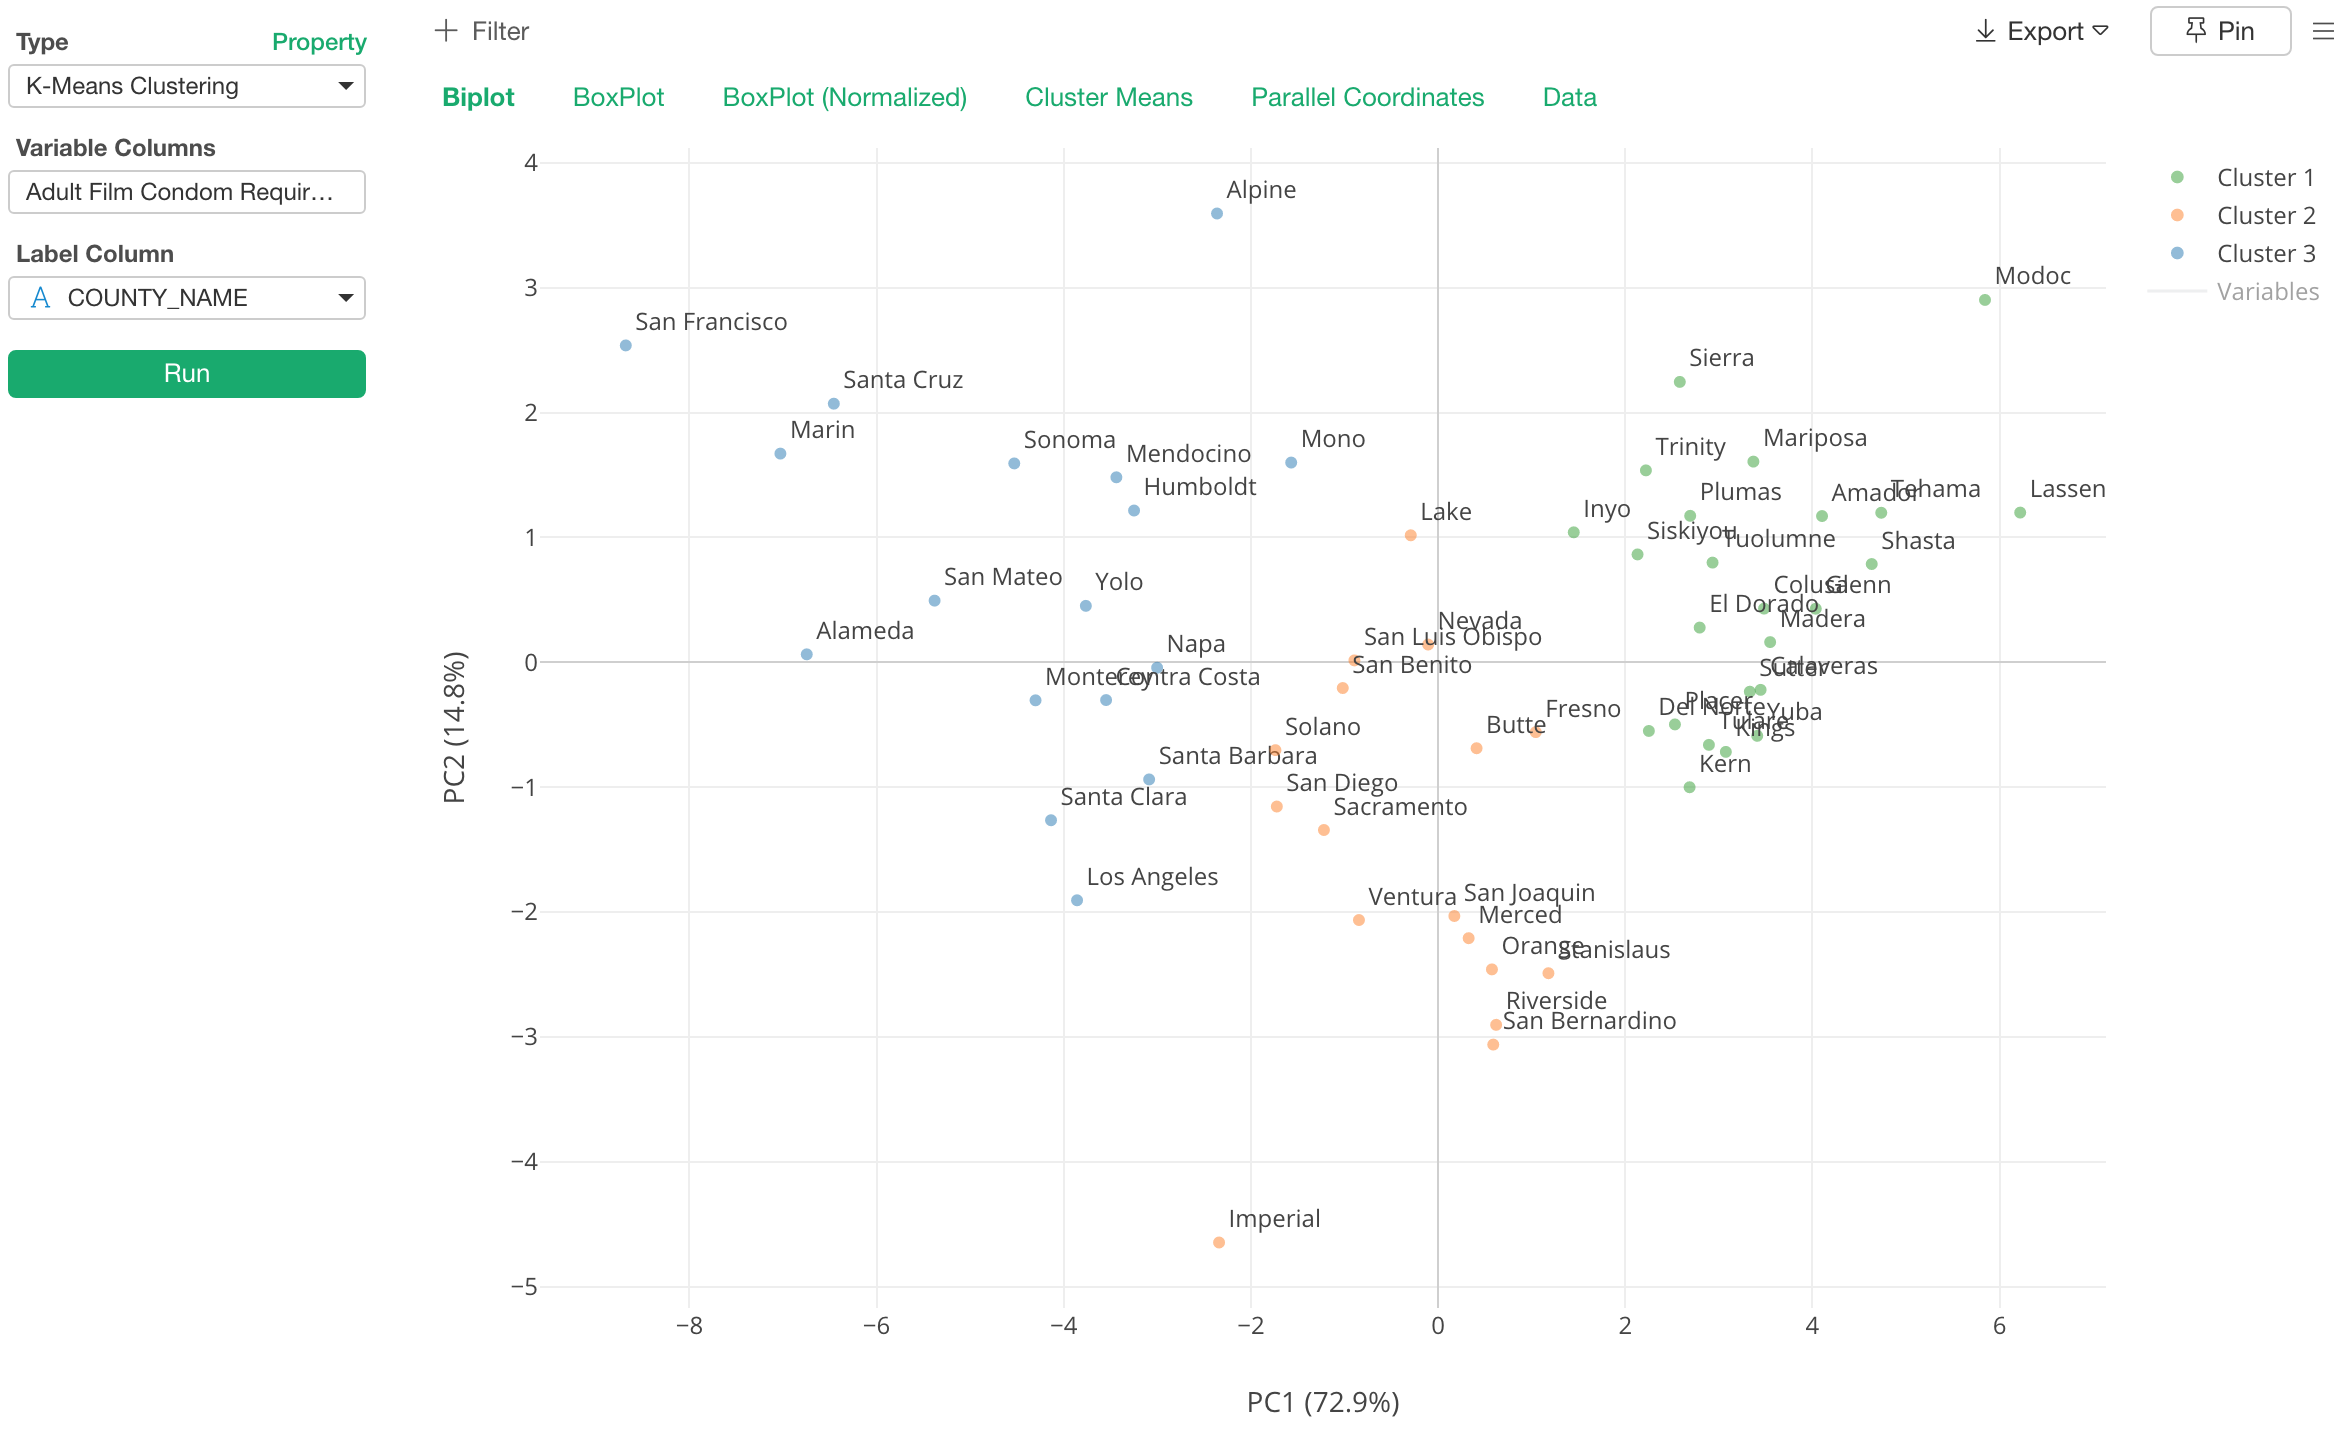
So we are adding it to Analytics view with a set of pre-seeded charts, which would help you understand the relationship and patterns in the data by visualizing the characteristics of the clusters.
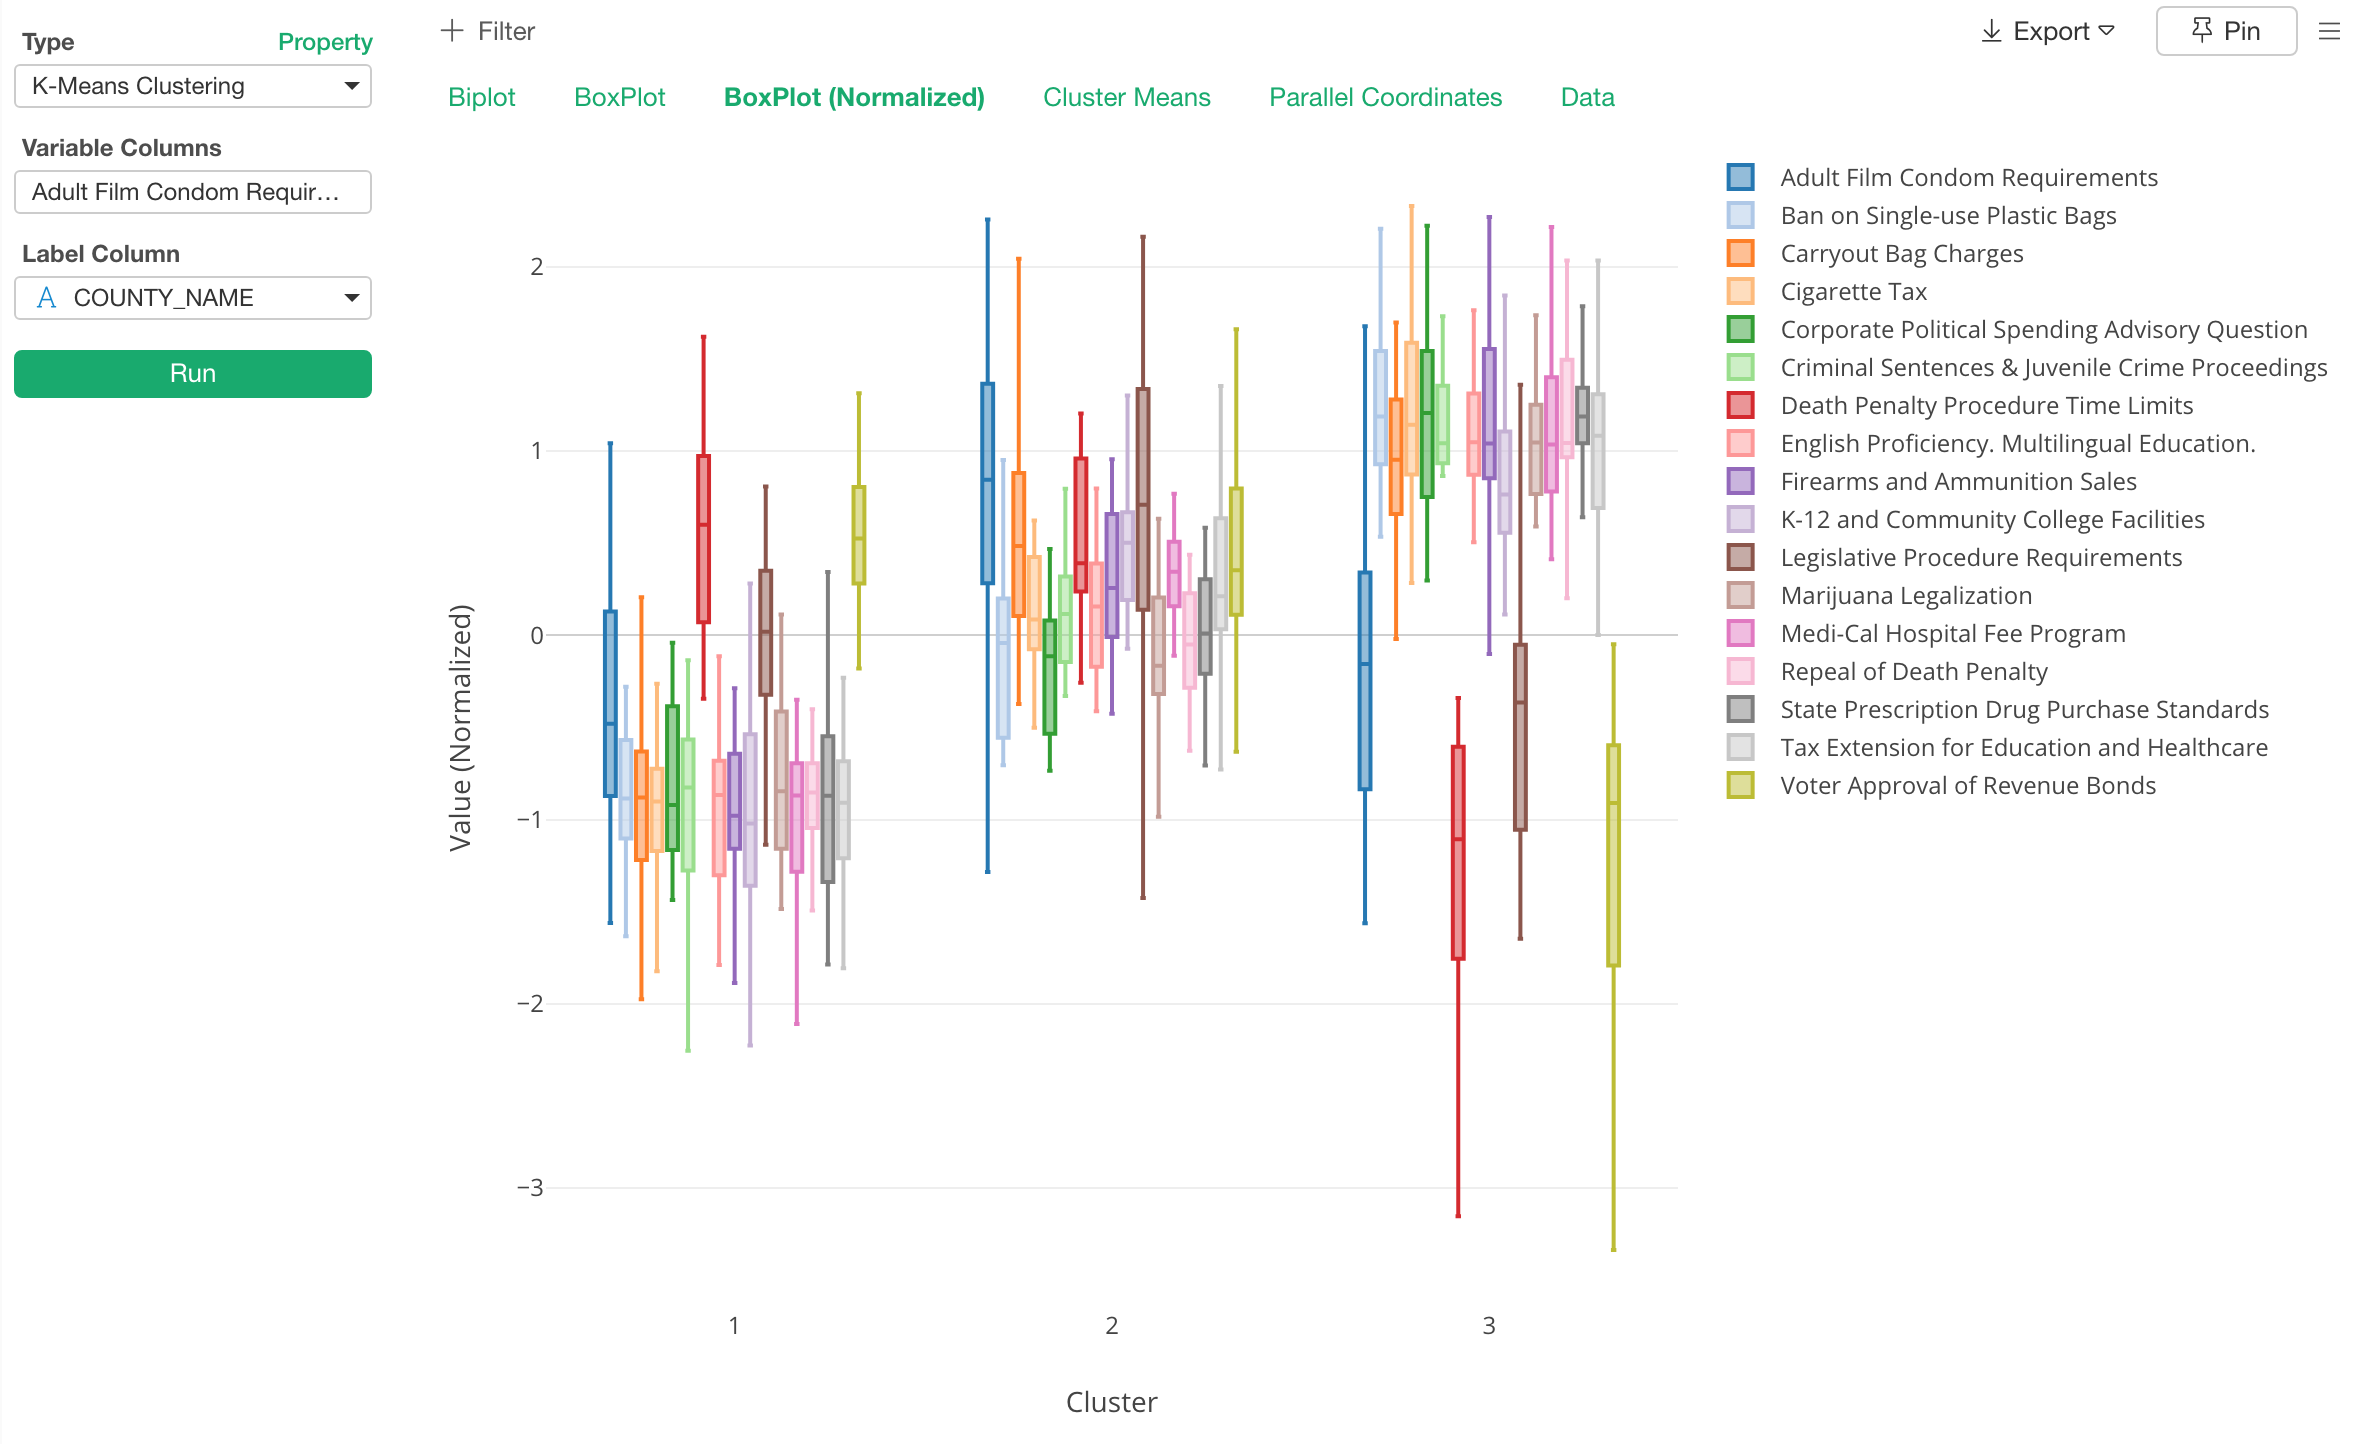
Here is a boxplot to show the data distribution of the variables for each cluster so that you can see the characteristics of each cluster.
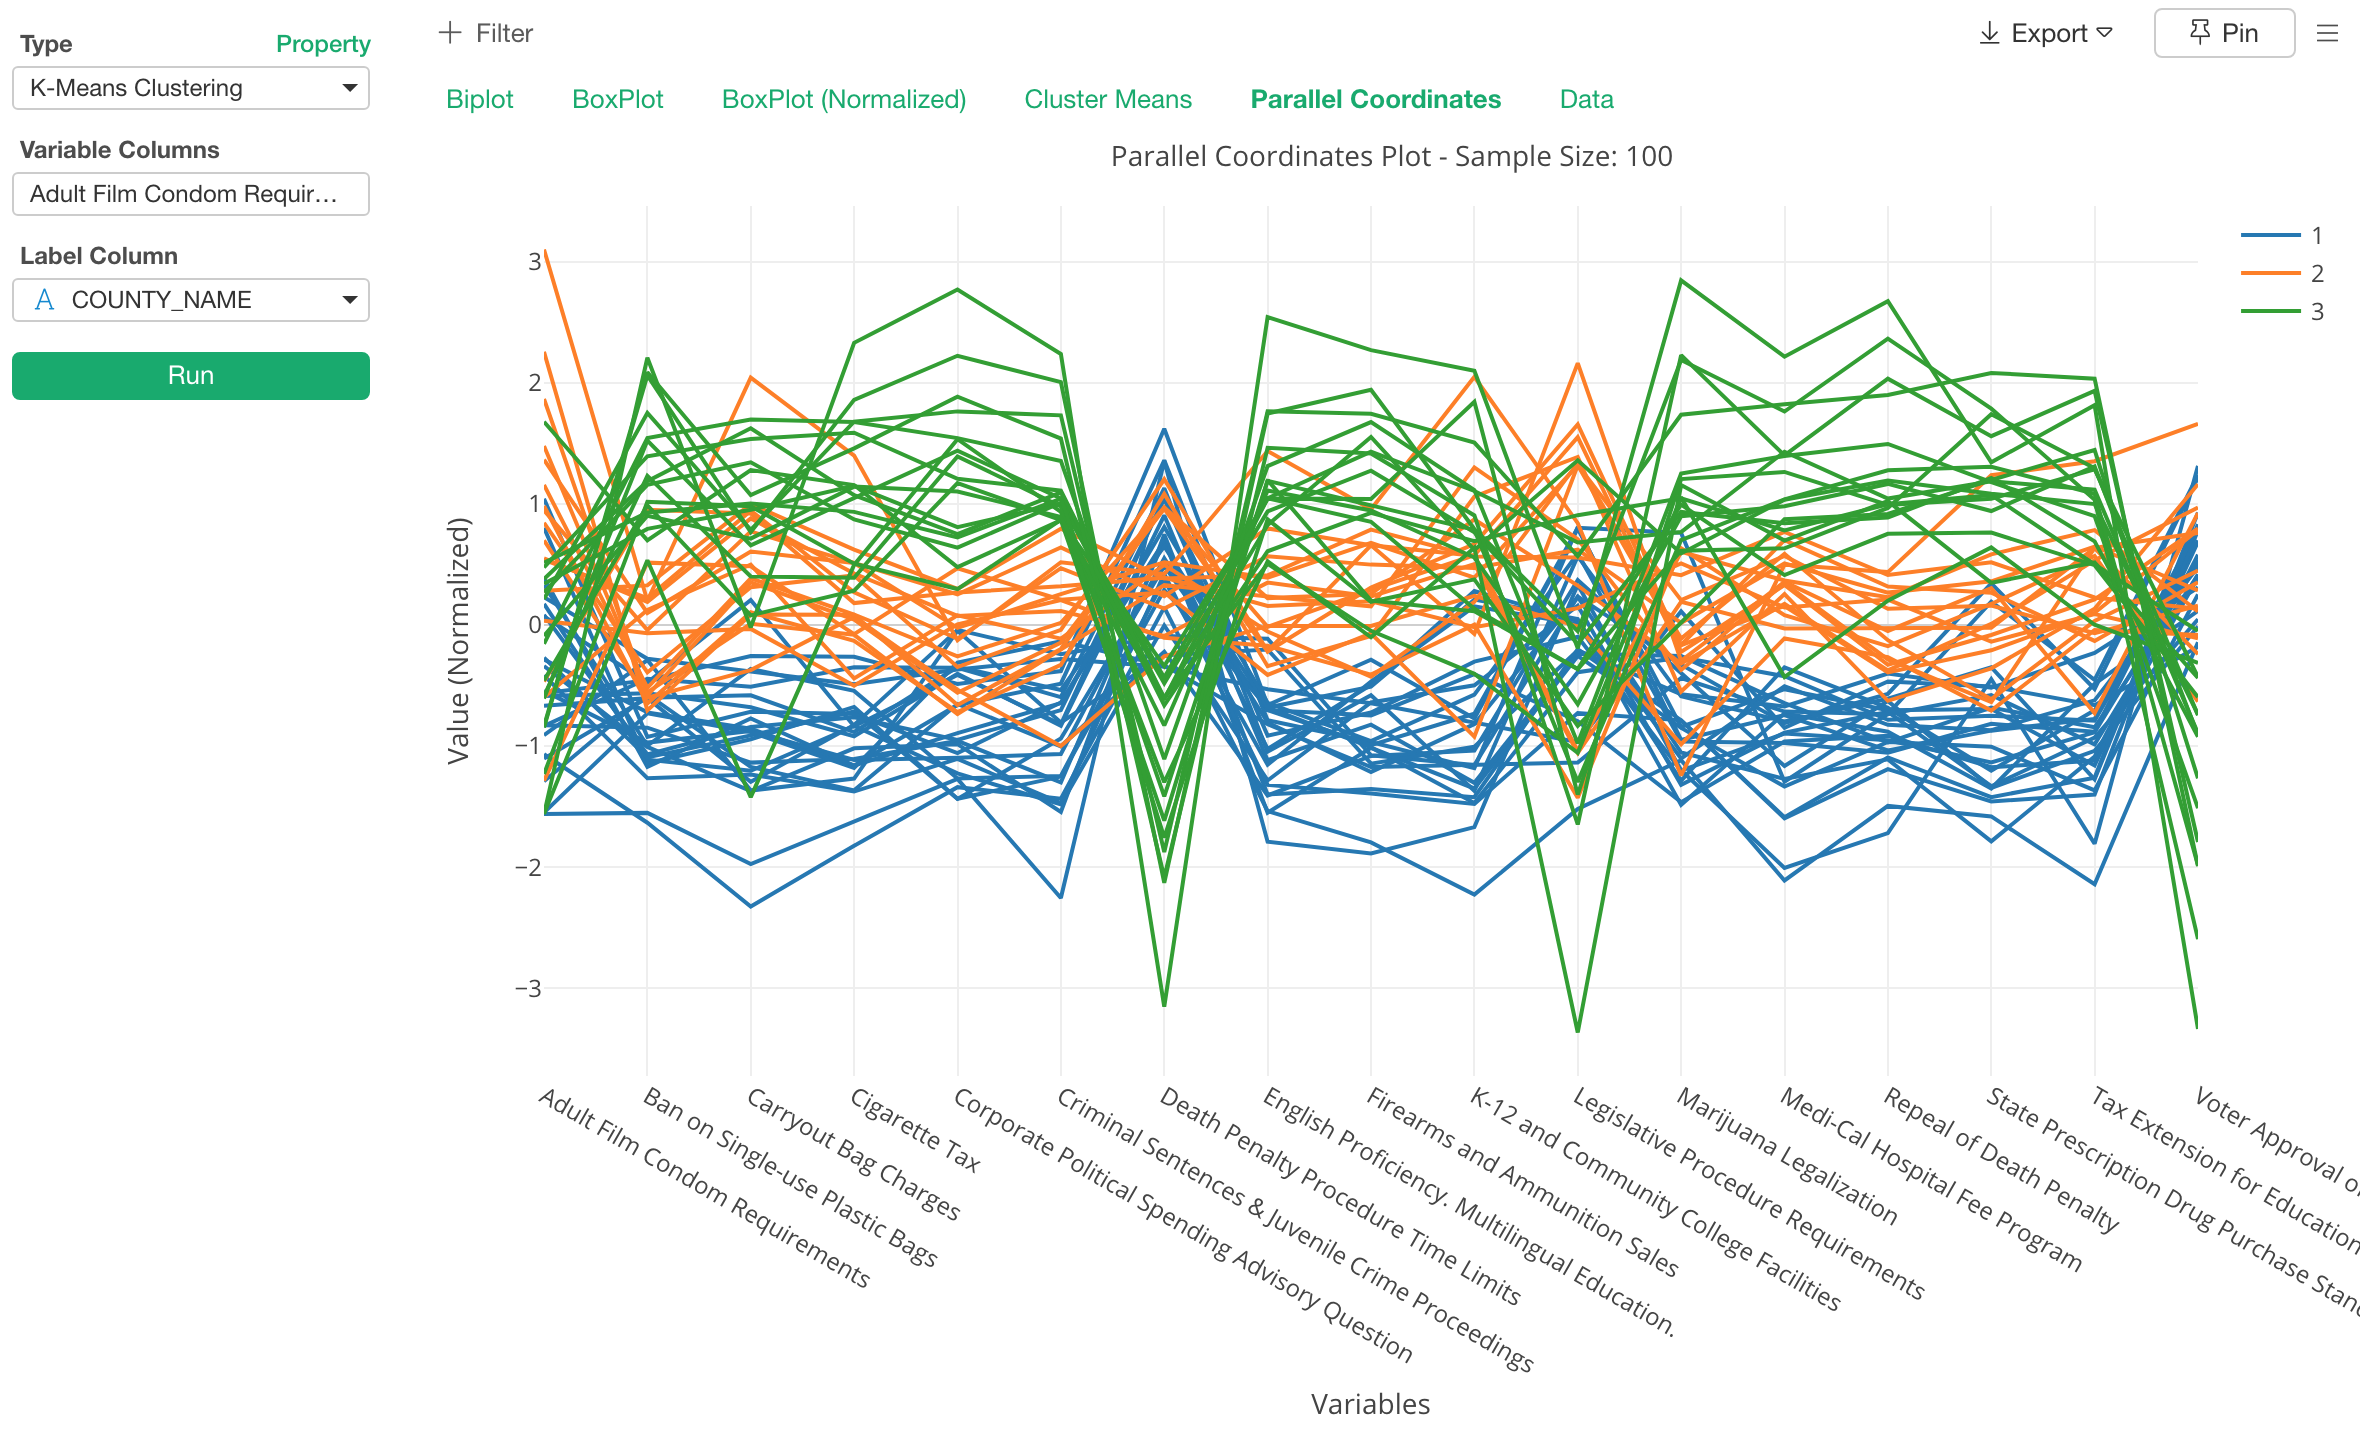
And here is something called ‘Parallel Coordinate’ chart that shows how each observation scores for each variable, which can give you another way to understand the characteristics of the clusters.
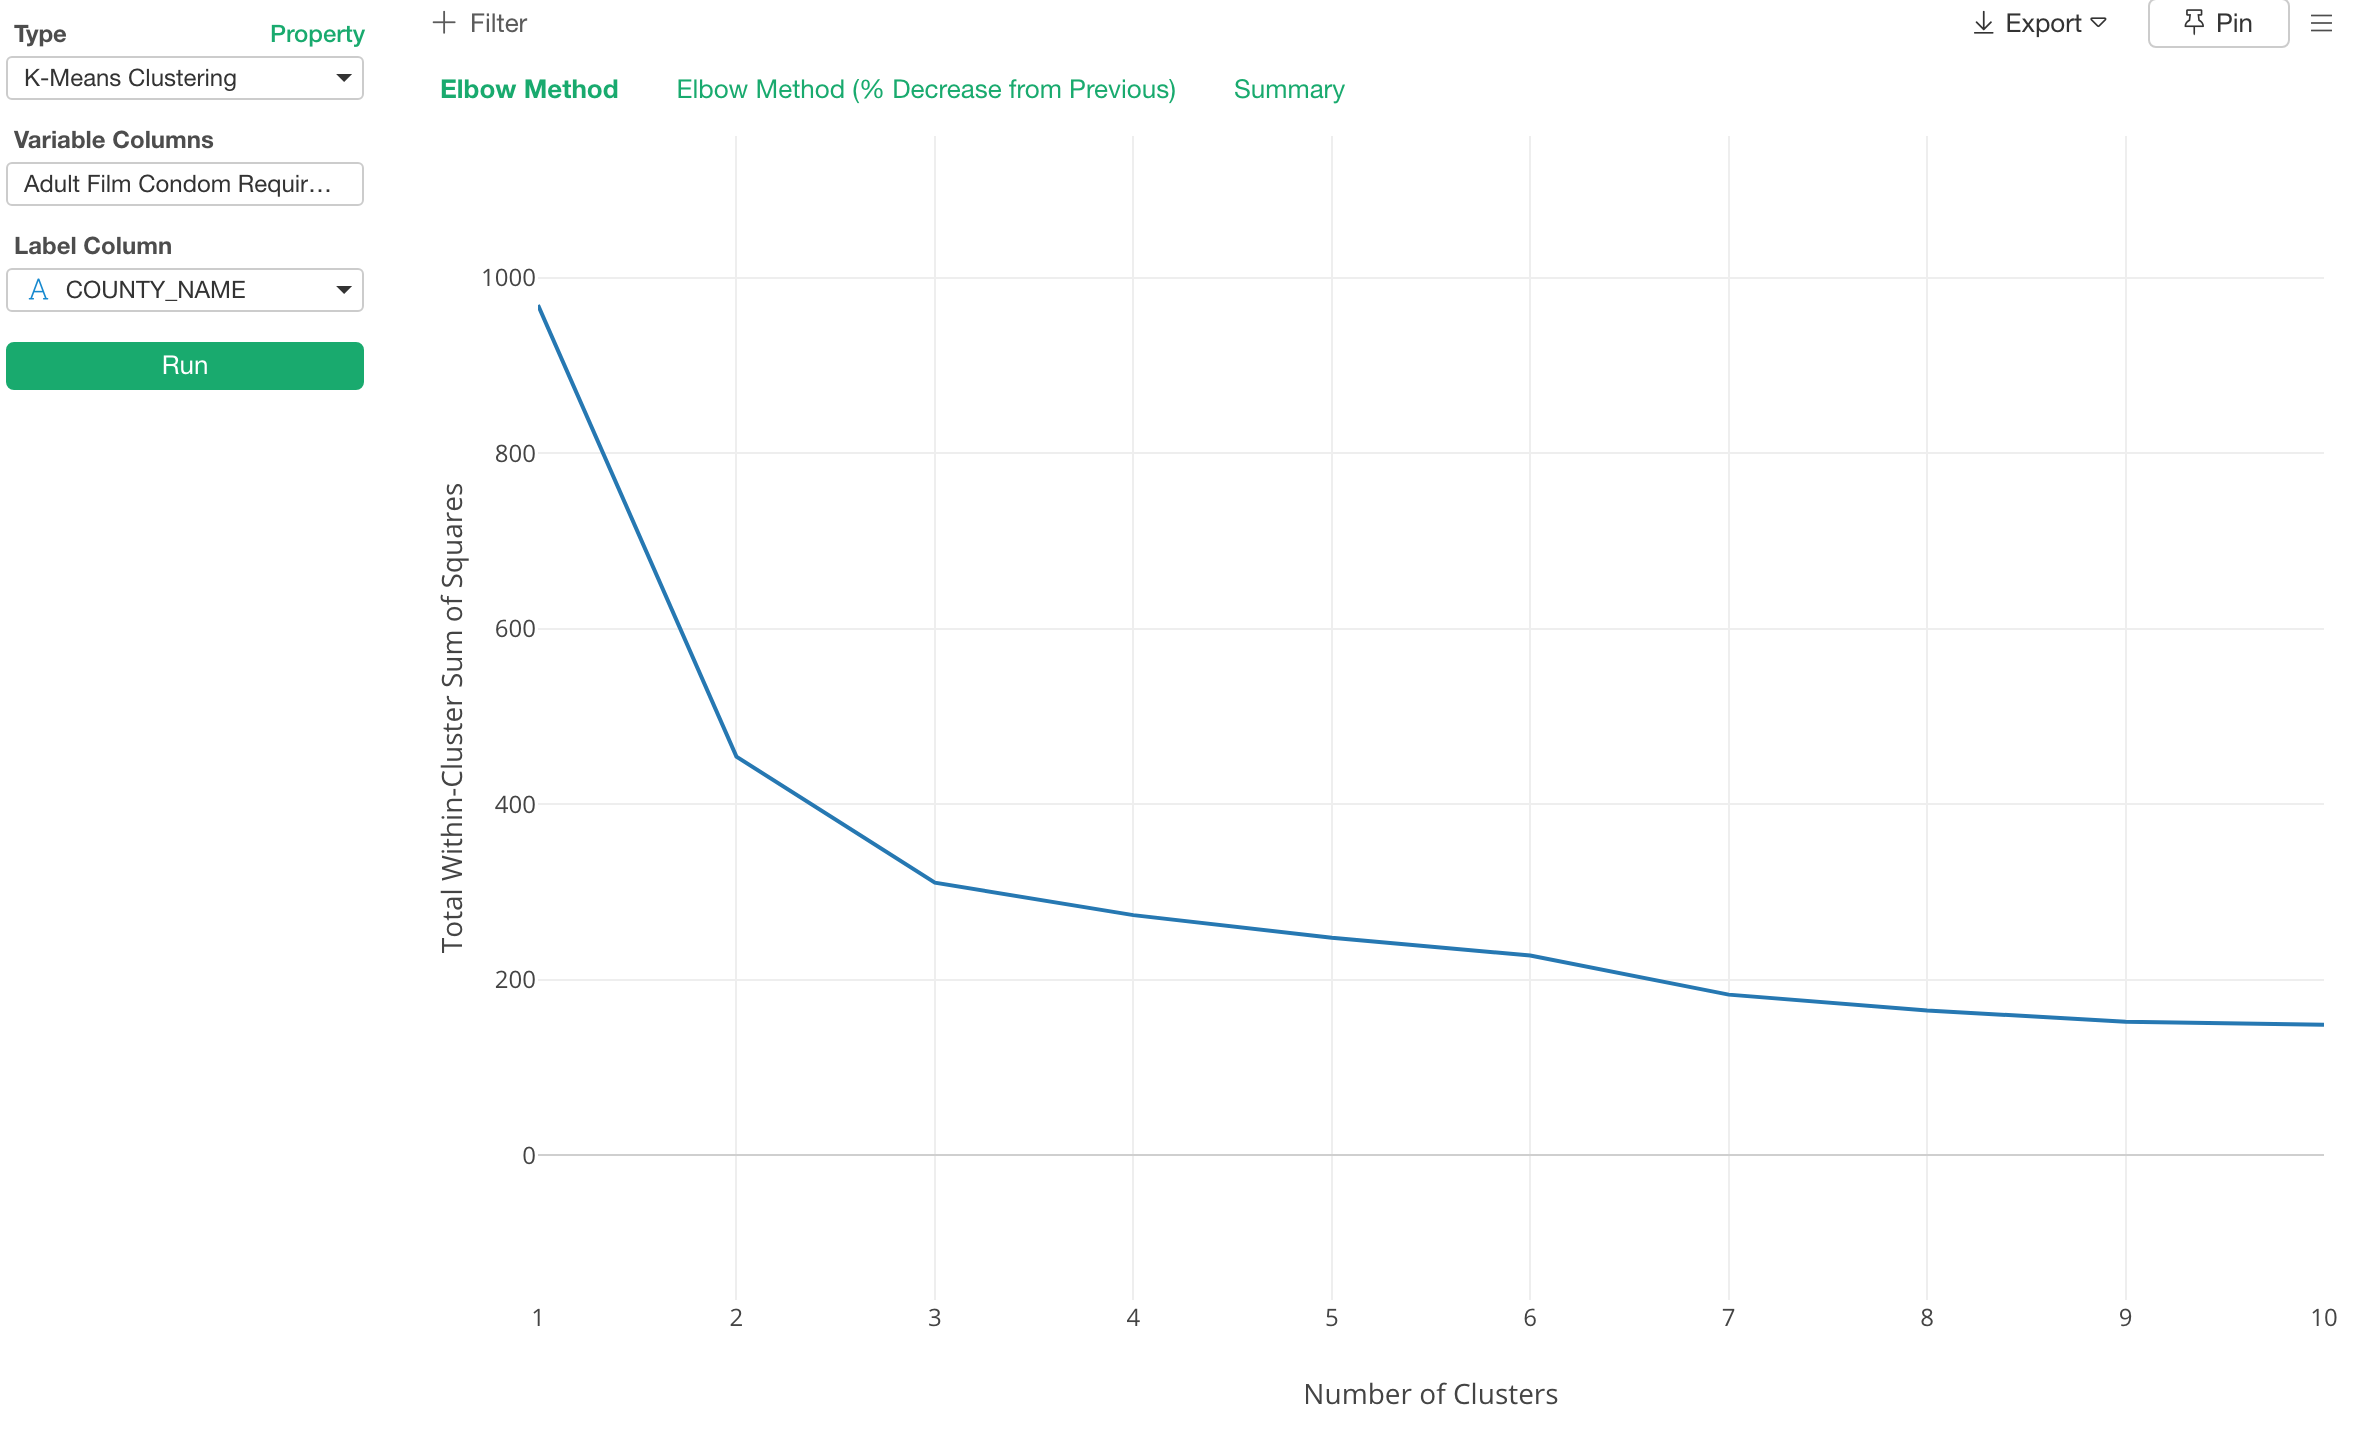
And here is another thing. The K-means Clustering algorithm requires you to set the number (K) of the clusters when you run it. And the obvious question here is,
“what is the magic number?”
There are a few ways to answer the question. One of them is called ‘Elbow Curve’, which you can draw it with just a click of a button. Here, the elbow is around the number 3, so you can try building the clusters with 3.
That’s it for this week.
Have a wonderful week!
Kan CEO/Exploratory
This is a weekly email update of what I have seen in Data Science / AI and thought were interesting, plus what Team Exploratory is working on.