
“A good model can be useful even when it fails.”
by Nate Silver
Hi there!
It’s Kan from Exploratory.
Hope you guys are doing great.
I have a big news today.
We have just released Exploratory v5.1! 🎉🎉🎉
It took us longer than we had originally planned, but I think we’ve got something wonderful.
There are two main themes with this version.
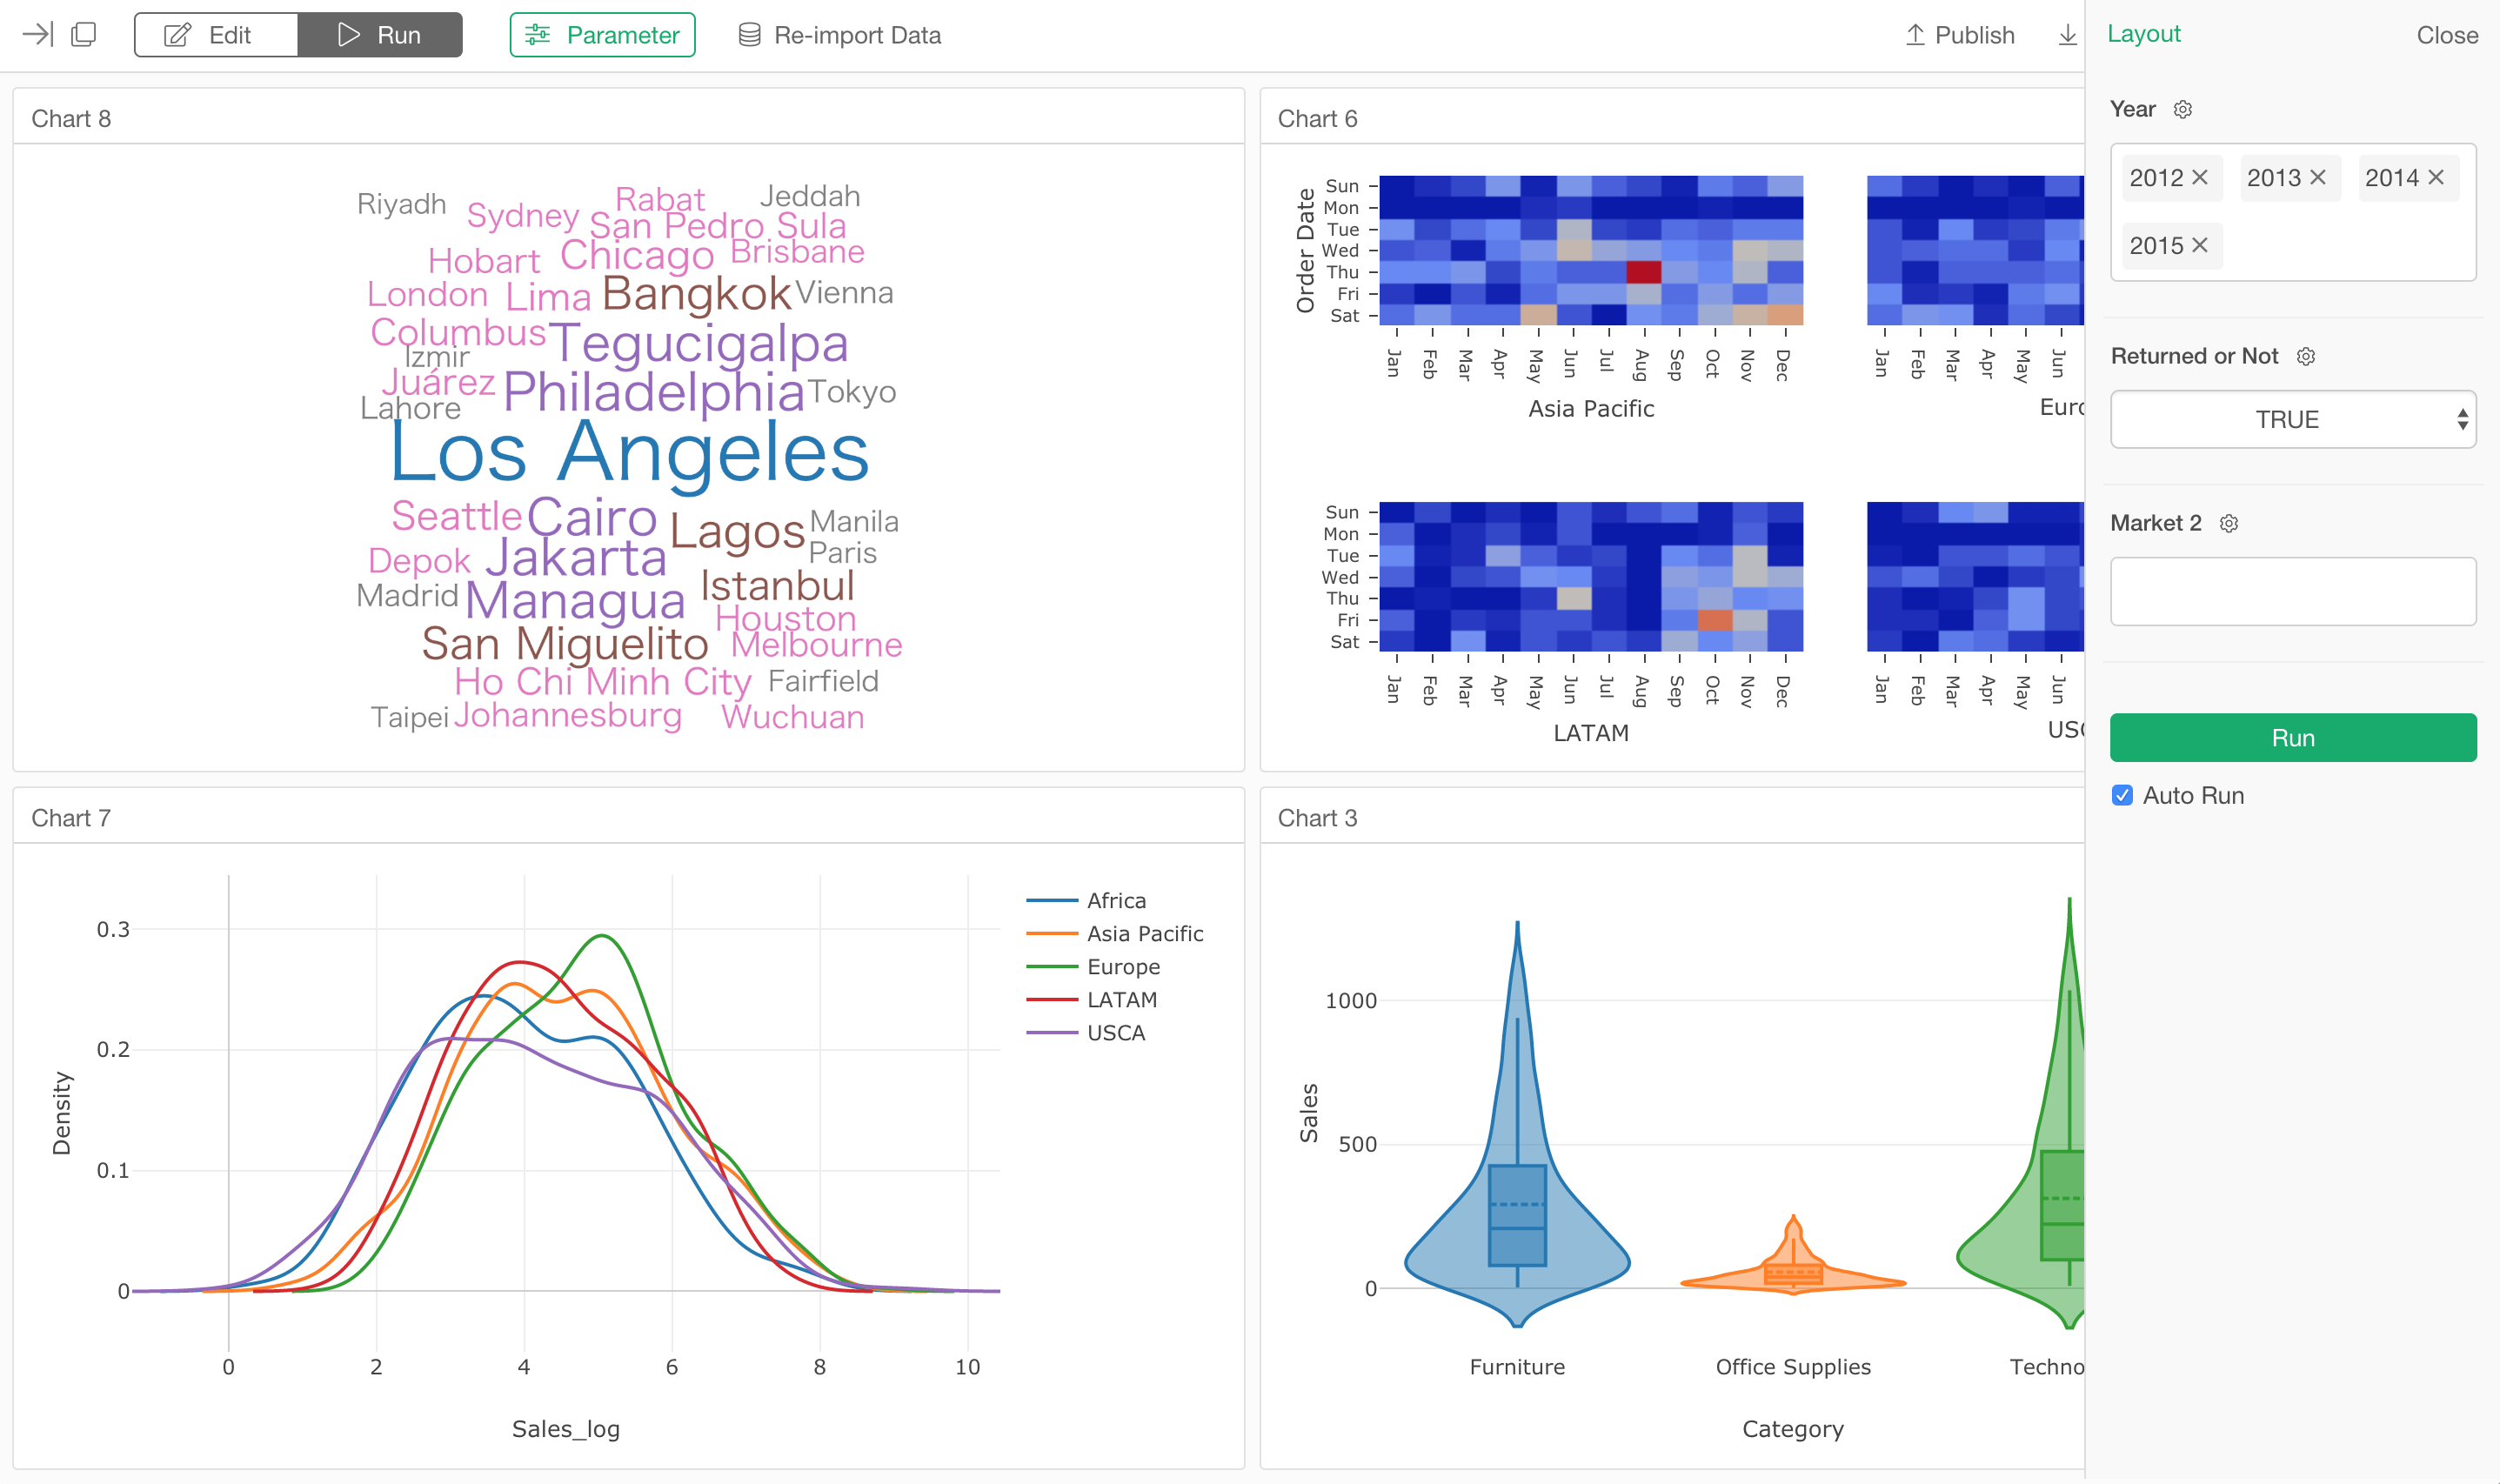
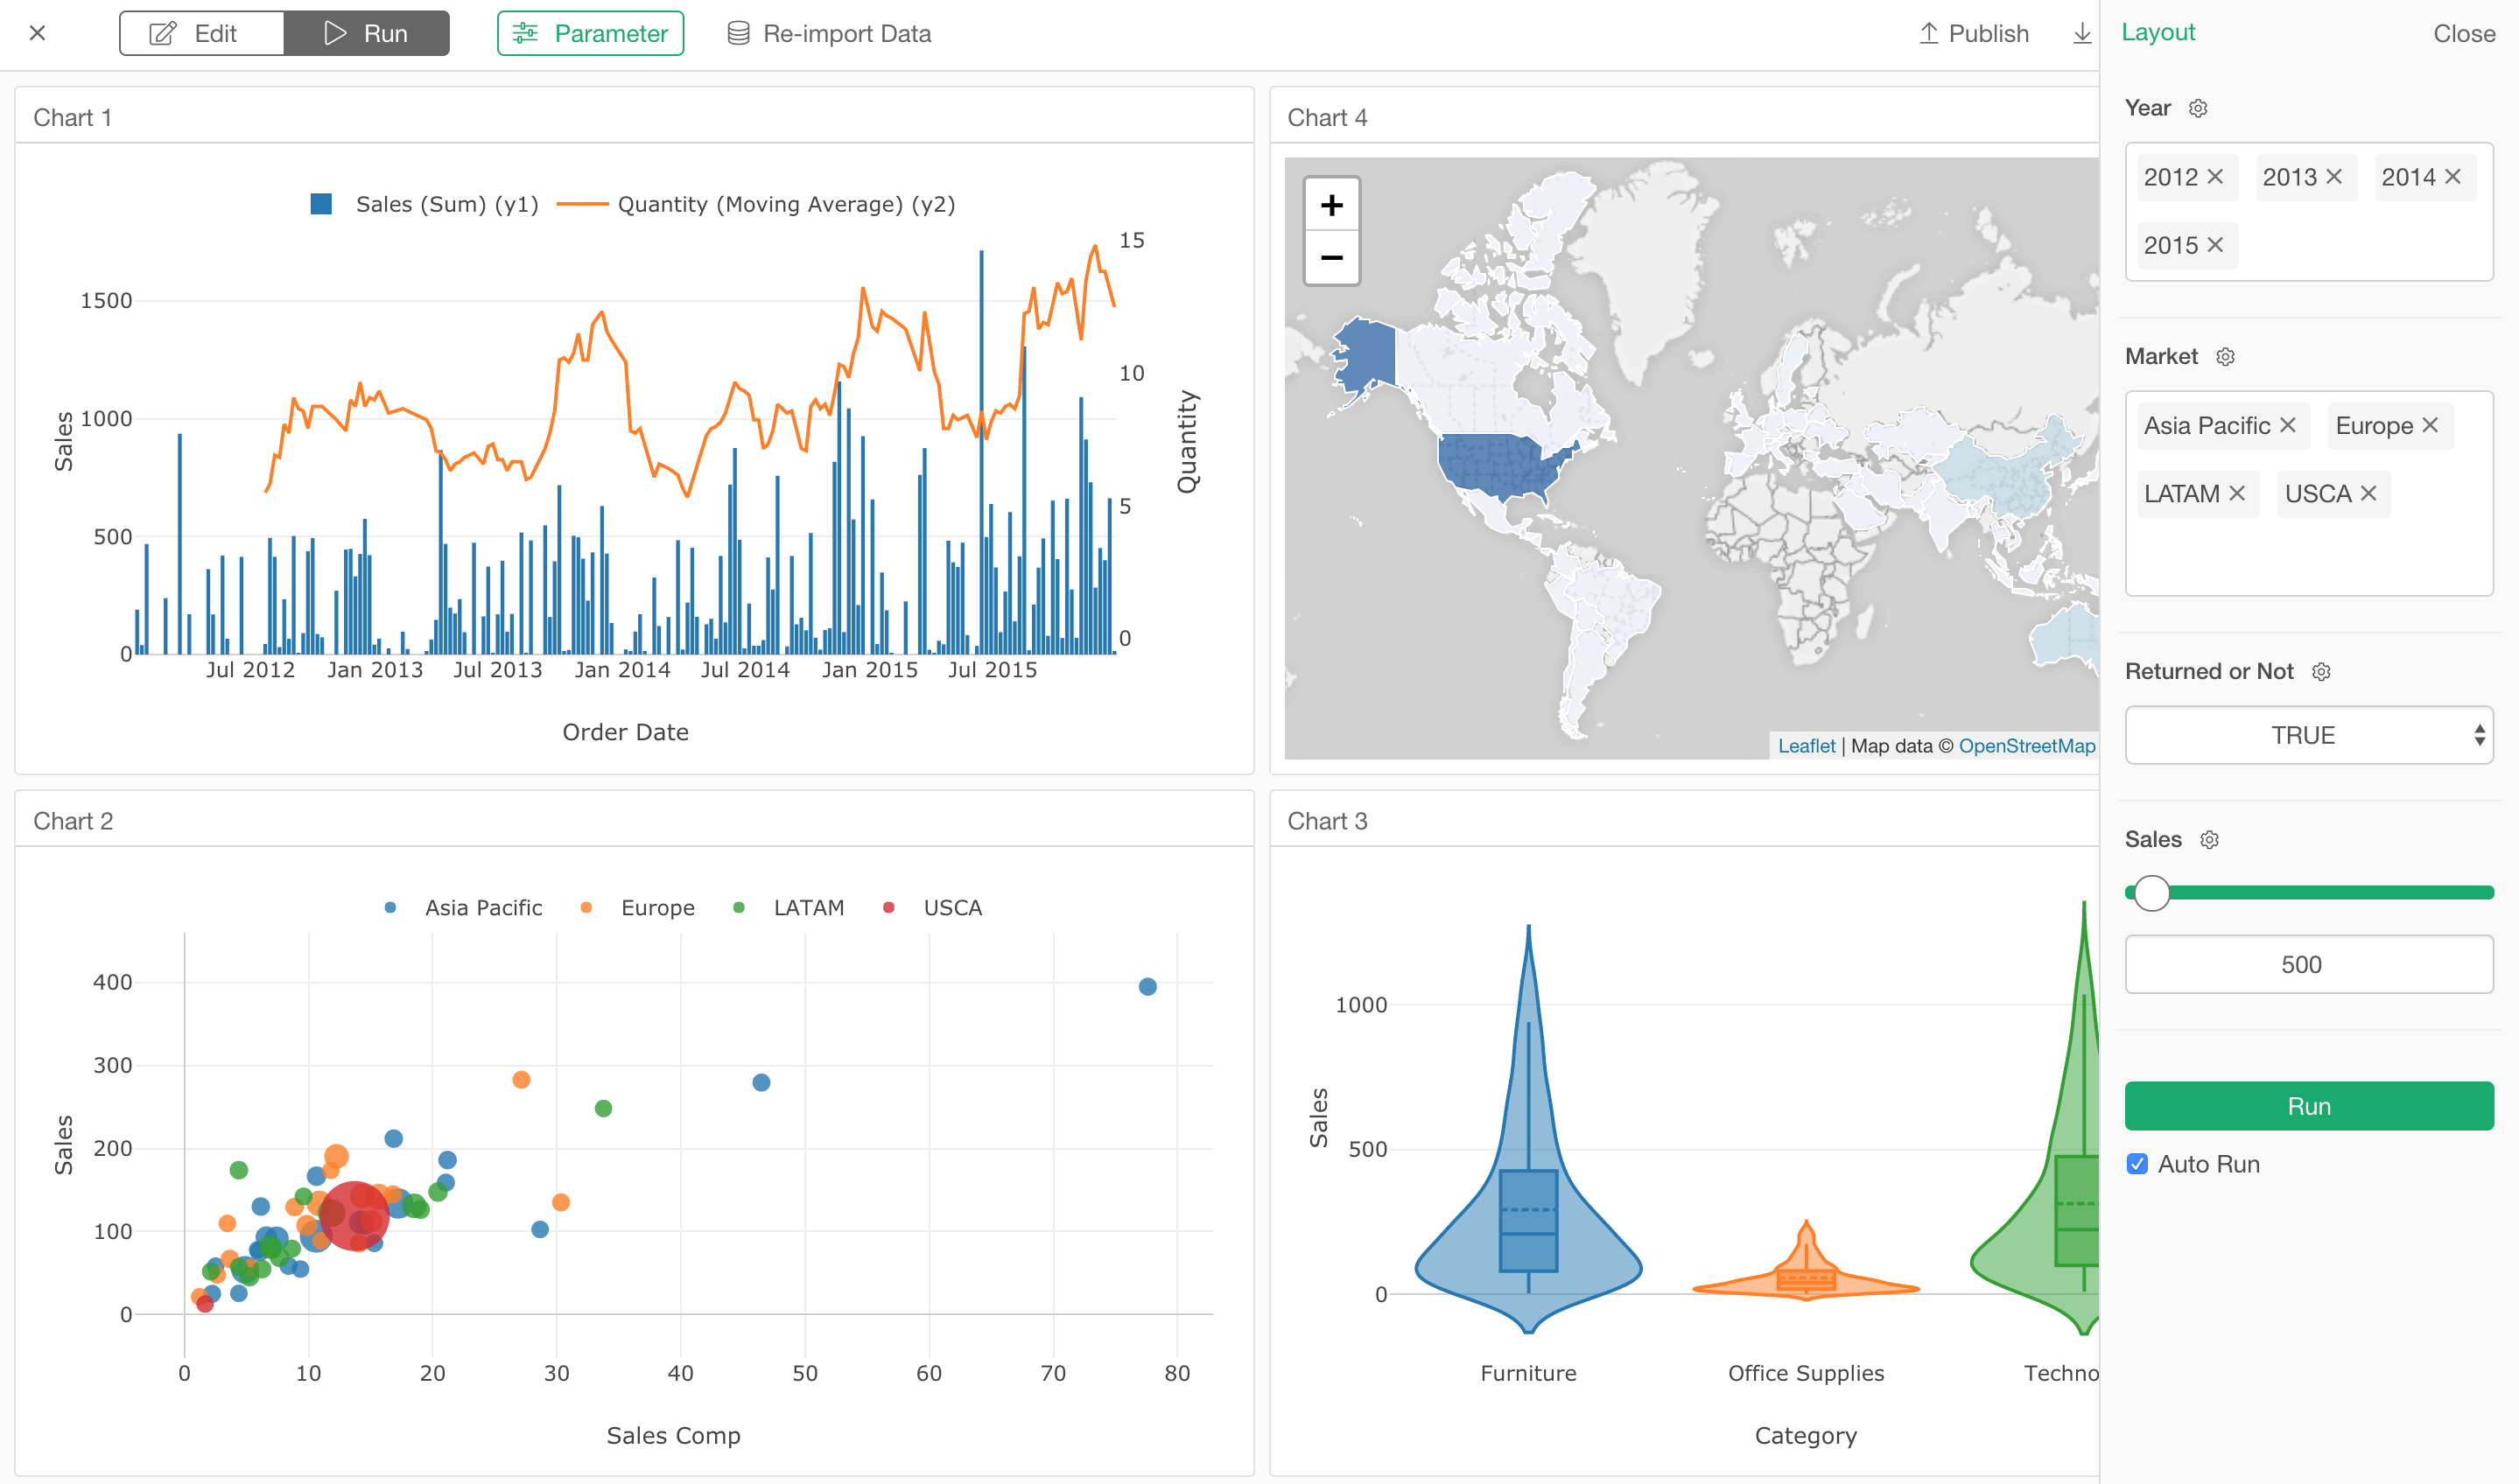
One is to make it possible for you to make your Dashboards, Notes, Slides, and Charts interactive so that your team members can interact with them and dynamically update the data. We call it Parameter.
Another is to make the EDA (Exploratory Data Analysis) experience of Exploratory easier and more powerful with new chart types such as Violin plot, Scatter matrix, Density Plot, and Word Cloud, and new analytics capabilities such as Boruta for Random Forest, Relative Importance for Linear Regression, Marginal Effect for Logistic Regression, etc.
And of course, there are many more new features, enhancements, and bug fixes.
Take a look at our announcement blog post!
What We Are Reading
Data Science Related Questions Answered - Link
“Data science serves two important but distinct sets of goals: improving the products your customers use, and improving the decisions your business makes.”
Product engagement: the most important metric you aren’t tracking for your SaaS business - Link
Derek talks about how to create the Product Engagement metric step by step, and explain how it is super useful to grow businesses in many areas including Product, Marketing, Sales, Customer Success.
Succeeding as a Data Scientist in small companies - Link
“In the beginning, most dashboards and reports will be manual. It takes a lot of iteration to hit upon metrics that people care enough to see multiple times. Automation is a nice-to-have, but getting insights out takes priority.”
What We Are Writing
Here are a few posts we have written recently!
- Calculating Duration Between Order Dates for Each Customer - Link
- How to create a Linear Regerssion Model as a step then prdedict with new data - Link
- How to access MySQL through ssh tunnel - Link
What We Are Working On
Exploratory v5.1
As mentioned above, we have finally released v5.1!
It took us a long time, but we think this is another great release with many new exciting features!
First, there is the Parameter. With this, you can make parameterize your SQL queries, MongoDB queries, Data Wrangling steps, and R Scripts. And this means, you can make your Dashboards, Notes, and Slides interactive!
We have added Violin Plot, Density Plot, Scatter Matrix, and Word Cloud chart types.
Under Analytics view, we have added GLM family, Boruta for Random Forest, Marginal Effects for Logistic Regression, and Relative Importance for Linear Regression.
We have also added new data sources such as AWS S3 Athena and Teradata.
Another big improvement is around the installation. We have fixed some critical issues that were preventing some folks from being able to start the app or open the projects. We also added the Windows Installer support!
There are many other new features, enhancements, and bug fixes.
Take a look at our announcement blog post!
You should give it a shot by downloading it today!
Want to try it again?
If your trial period has been expired but you’d like to try it again, now you can request an extension of the trial period by clicking a button that shows up inside Exploratory Desktop when you launch the app!
Exploratory Collaboration Server v5.1
With Exploratory Collaboration Server, you can publish and schedule your Dashboards, Notes, Slides, Charts, and Data at your own server.
Now that we have released Exploratory Desktop v5.1, we are working on to upgrade Exploratory Collaboration Server to be v5.1 compatible.
We’re hoping to make it publicly available some time next week!
Exploratory v5.2
We are planning to add exciting new features in Data Wrangling, Visualization, Analytics, and Dashboard areas.
One big thing will be Time Series Forecasting. We already provide it with Prophet, but will be adding other methods like ARIMA, VAR, State Space, etc.
Also, we’ll be adding a few new data sources like Salesforce, S3, Google Drive, etc.
Stay tuned!
That’s it for this week.
Have a wonderful week!
Kan CEO/Exploratory
This is a weekly email update of what I have seen in Data Science / AI and thought were interesting, plus what Team Exploratory is working on.