
“Technology is beneficial as a labor-saving device, but we should not expect machines to do our thinking for us.”
by Nate Silver
Hi there!
It’s Kan from Exploratory.
We are finding that synthesizing fake information is becoming much easier. Some people using AI to produce fake faces (artificially created people faces that don’t exist in the world.), some people using AI produce fake articles.
There is a saying that more data doesn’t mean more knowledge. With this big data world with AI, the signal to the noise ratio is not getting better, it’s actually getting worse.
If the fake news is the new normal, what then? How are we going to make informed decisions without getting distracted by fake information or data?
We need a better education on how to collect data, find signals from the noise, use models to understand the world better, and make informed decisions based on such understanding.
That’s where my thinking is these days. And I’d love to hear what you think.
Anyway, here’s this week’s update!
What We Are Reading
Purely evidence-based policy doesn’t exist - Link
Lars Peter Hansen, an economist at Univ. Chicago, who is also a 2013 recipient of the Nobel Prize in Economic Sciences, publishing a very important essay about the limitation of data, model, and science.
We should always start from accepting the fact that we don’t quite understand the world even when we have data (and even when it is big!).
Doing Data Science Right - Your Most Common Questions Answered - Link
There are 4 questions everybody should ask their organizations before continuing doing Data Science.
A great advice piece by a VP of data science at Instacart, a ‘food delivery meets AI’ unicorn startup in San Francisco
Cameras that understand - Link
Now that cameras have been completely swallowed by software, it’s AI that is redefining what cameras really are.
We use iPhone (or Android) cameras to take pictures of white boards, slides at conferences, recipe from magazines, etc. They are data input devices. This means, with AI, we will be able to do a lot of things, which is exciting, but at the same time a bit scary.
Police across the US are training crime-predicting AIs on falsified data - Link
Some cities including New Orleans in the US deploying predictive policing AI system that is built based on the racially profiled and politically manipulated ‘historical data’.
When it comes to the quality of AI, ‘garbage in garbage out’. The scary thing is that many cities in the US (and most likely other countries, too) have already started using such biased AI that can easily scale up the human bias. But, many people still believe AI is less bias than human.
Measuring Radio’s Lag Behind Streaming Services - Link
It’s a series of great visualization showing how hit songs are getting people’s attention these days. (Spoiler: Spotify)
Google and Microsoft Warn That AI May Do Dumb Things - Link
Alphabet is cautioning investors that the company’s AI technology could “raise new or exacerbate existing ethical, technological, legal, and other challenges.”

Microsoft warned in SEC filings that “AI algorithms may be flawed. Datasets may be insufficient or contain biased information. Inappropriate or controversial data practices by Microsoft or others could impair the acceptance of AI solutions.”
It turned out there is a risk of doing AI. Surprise! ;)
But, on a serious note, if the companies who are at the cutting edge of AI recognizing such risk, how should other organizations who are busy implementing their systems with AI are going to do? Are we the users of such systems or services will be the first casualty hit by such risk? 🤔
What We Are Writing
Here are a few posts we have written recently!
- Venture Capital Money is Massively Pouring into Silicon Valley & That’s even Accelerating - Link
- How to Create Word Cloud Visualization in Exploratory - Link
- Building Decision Tree and Visualize in Exploratory - Link
What We Are Working On
Exploratory v5.1
We’re very close to releasing v5.1. There are many exciting new features! Here are some of them for Analytics.
Boruta
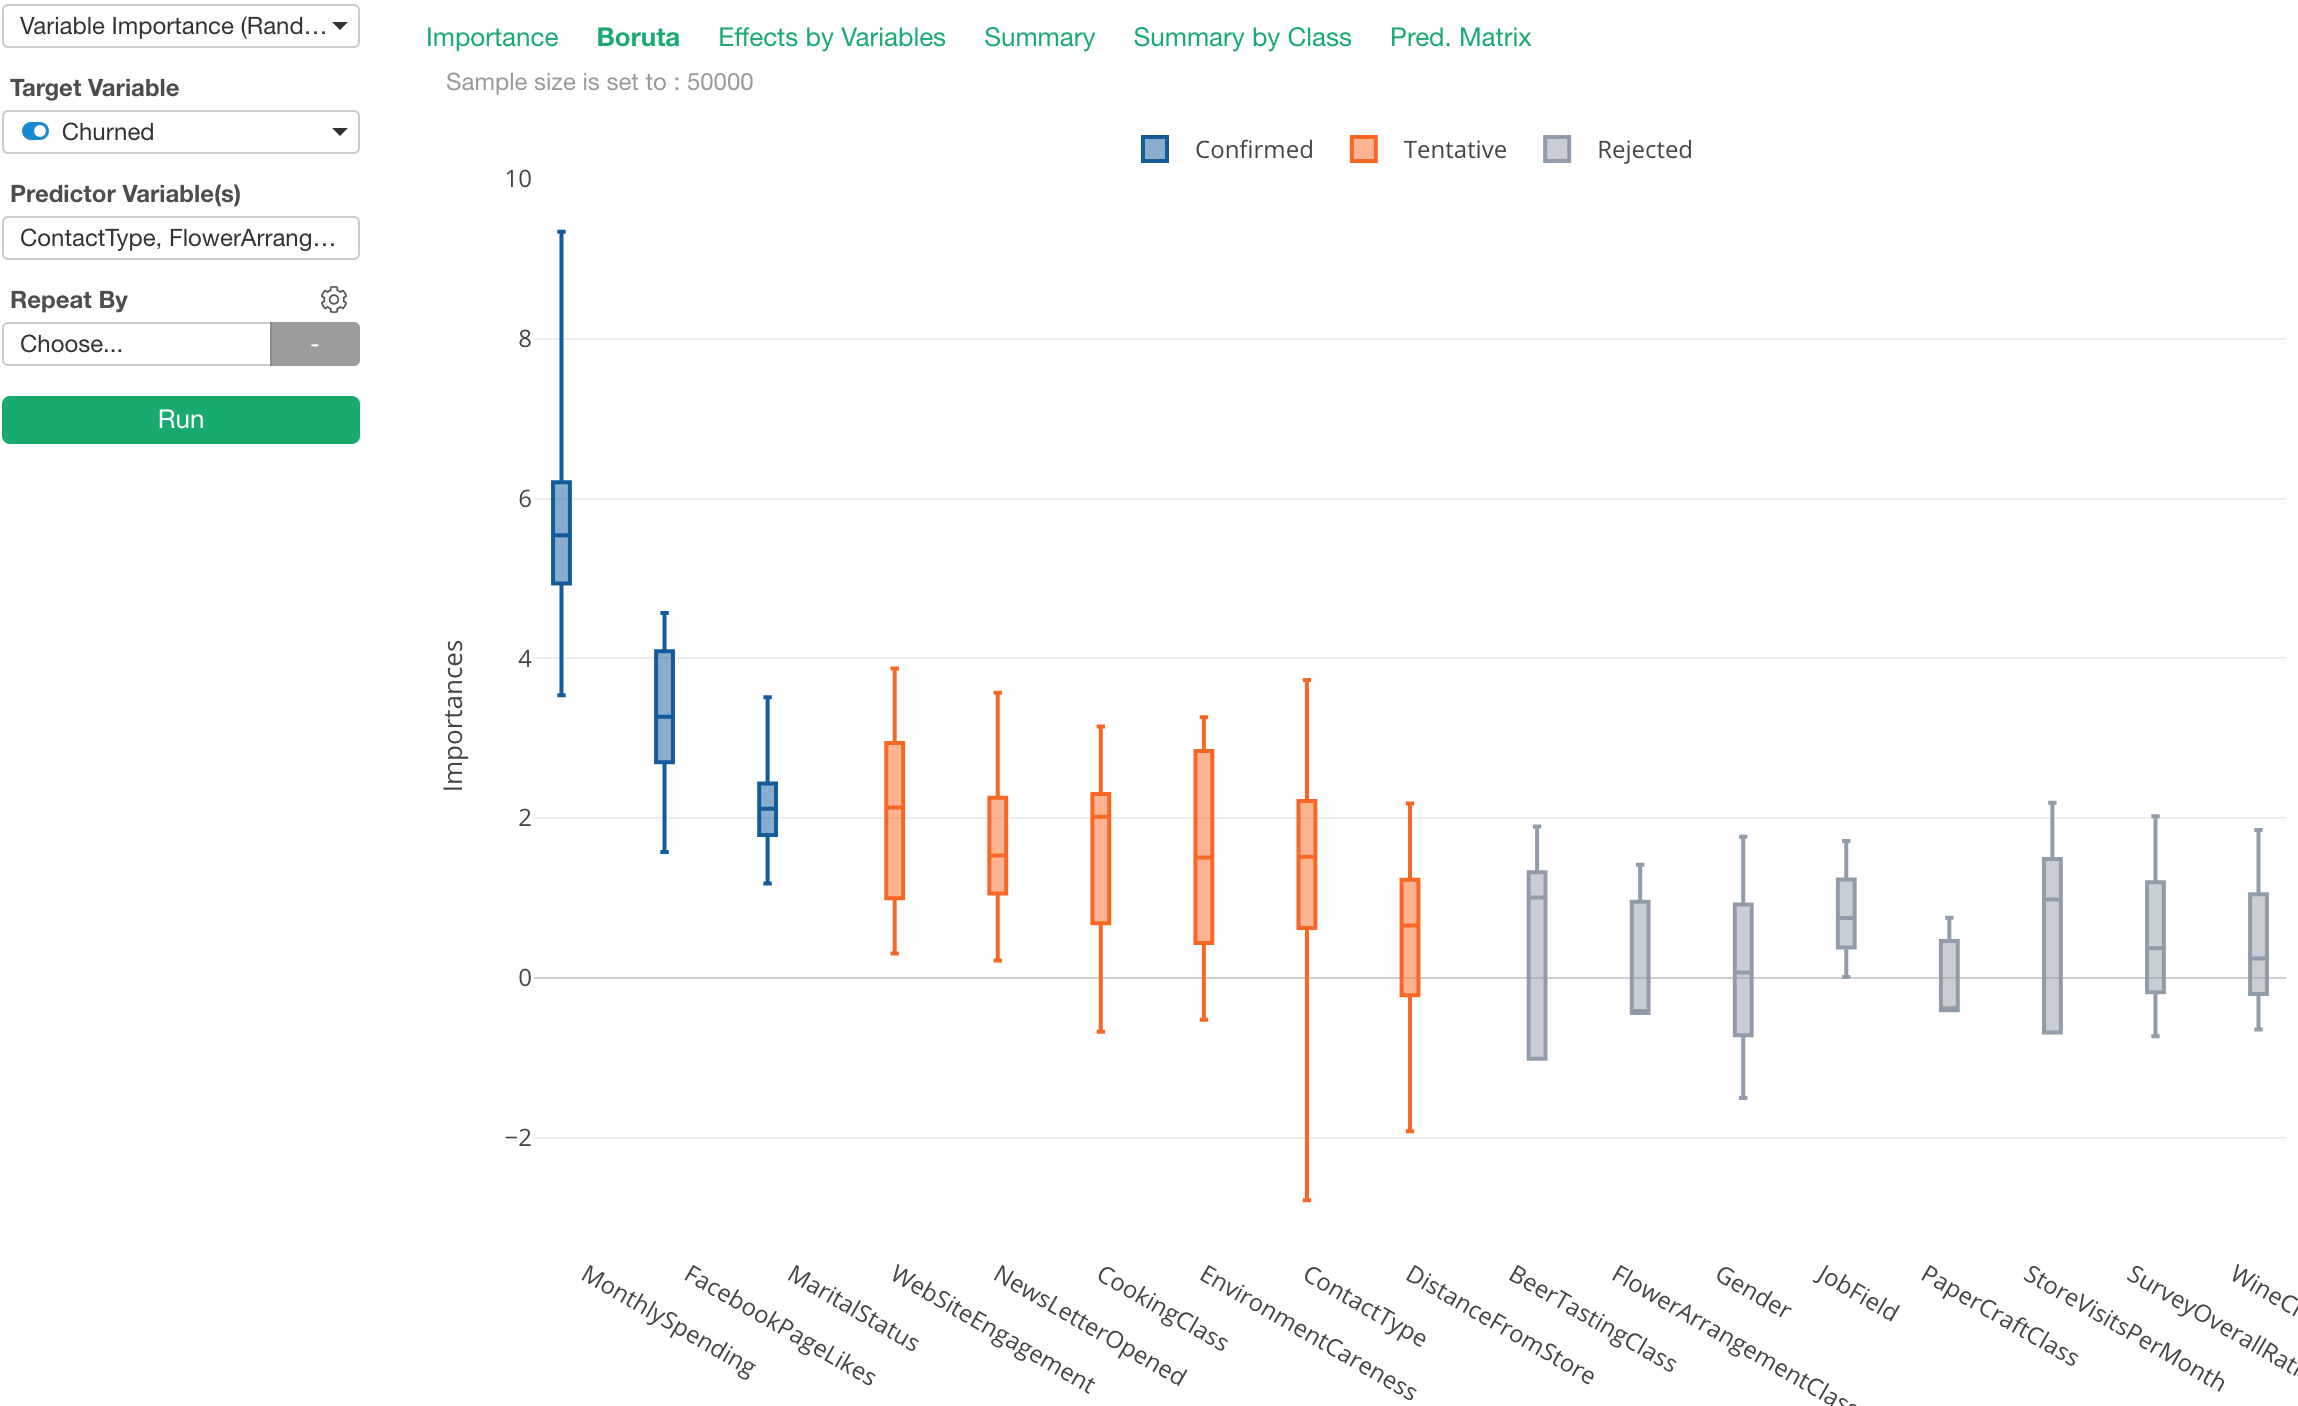
The thing about using Random Forest for ‘Variable Importance’ is that the result can differ every time you run it due to the ‘randomness’. and you don’t know which variables are actually significant.
There is a method called Boruta, which address these two challenges.
With Boruta, you can see the variable importance scores (Gini purity) as distribution (boxplot in Exploratory), not a point, and see the variables in different colors based on how significant they are.
Relative Importance
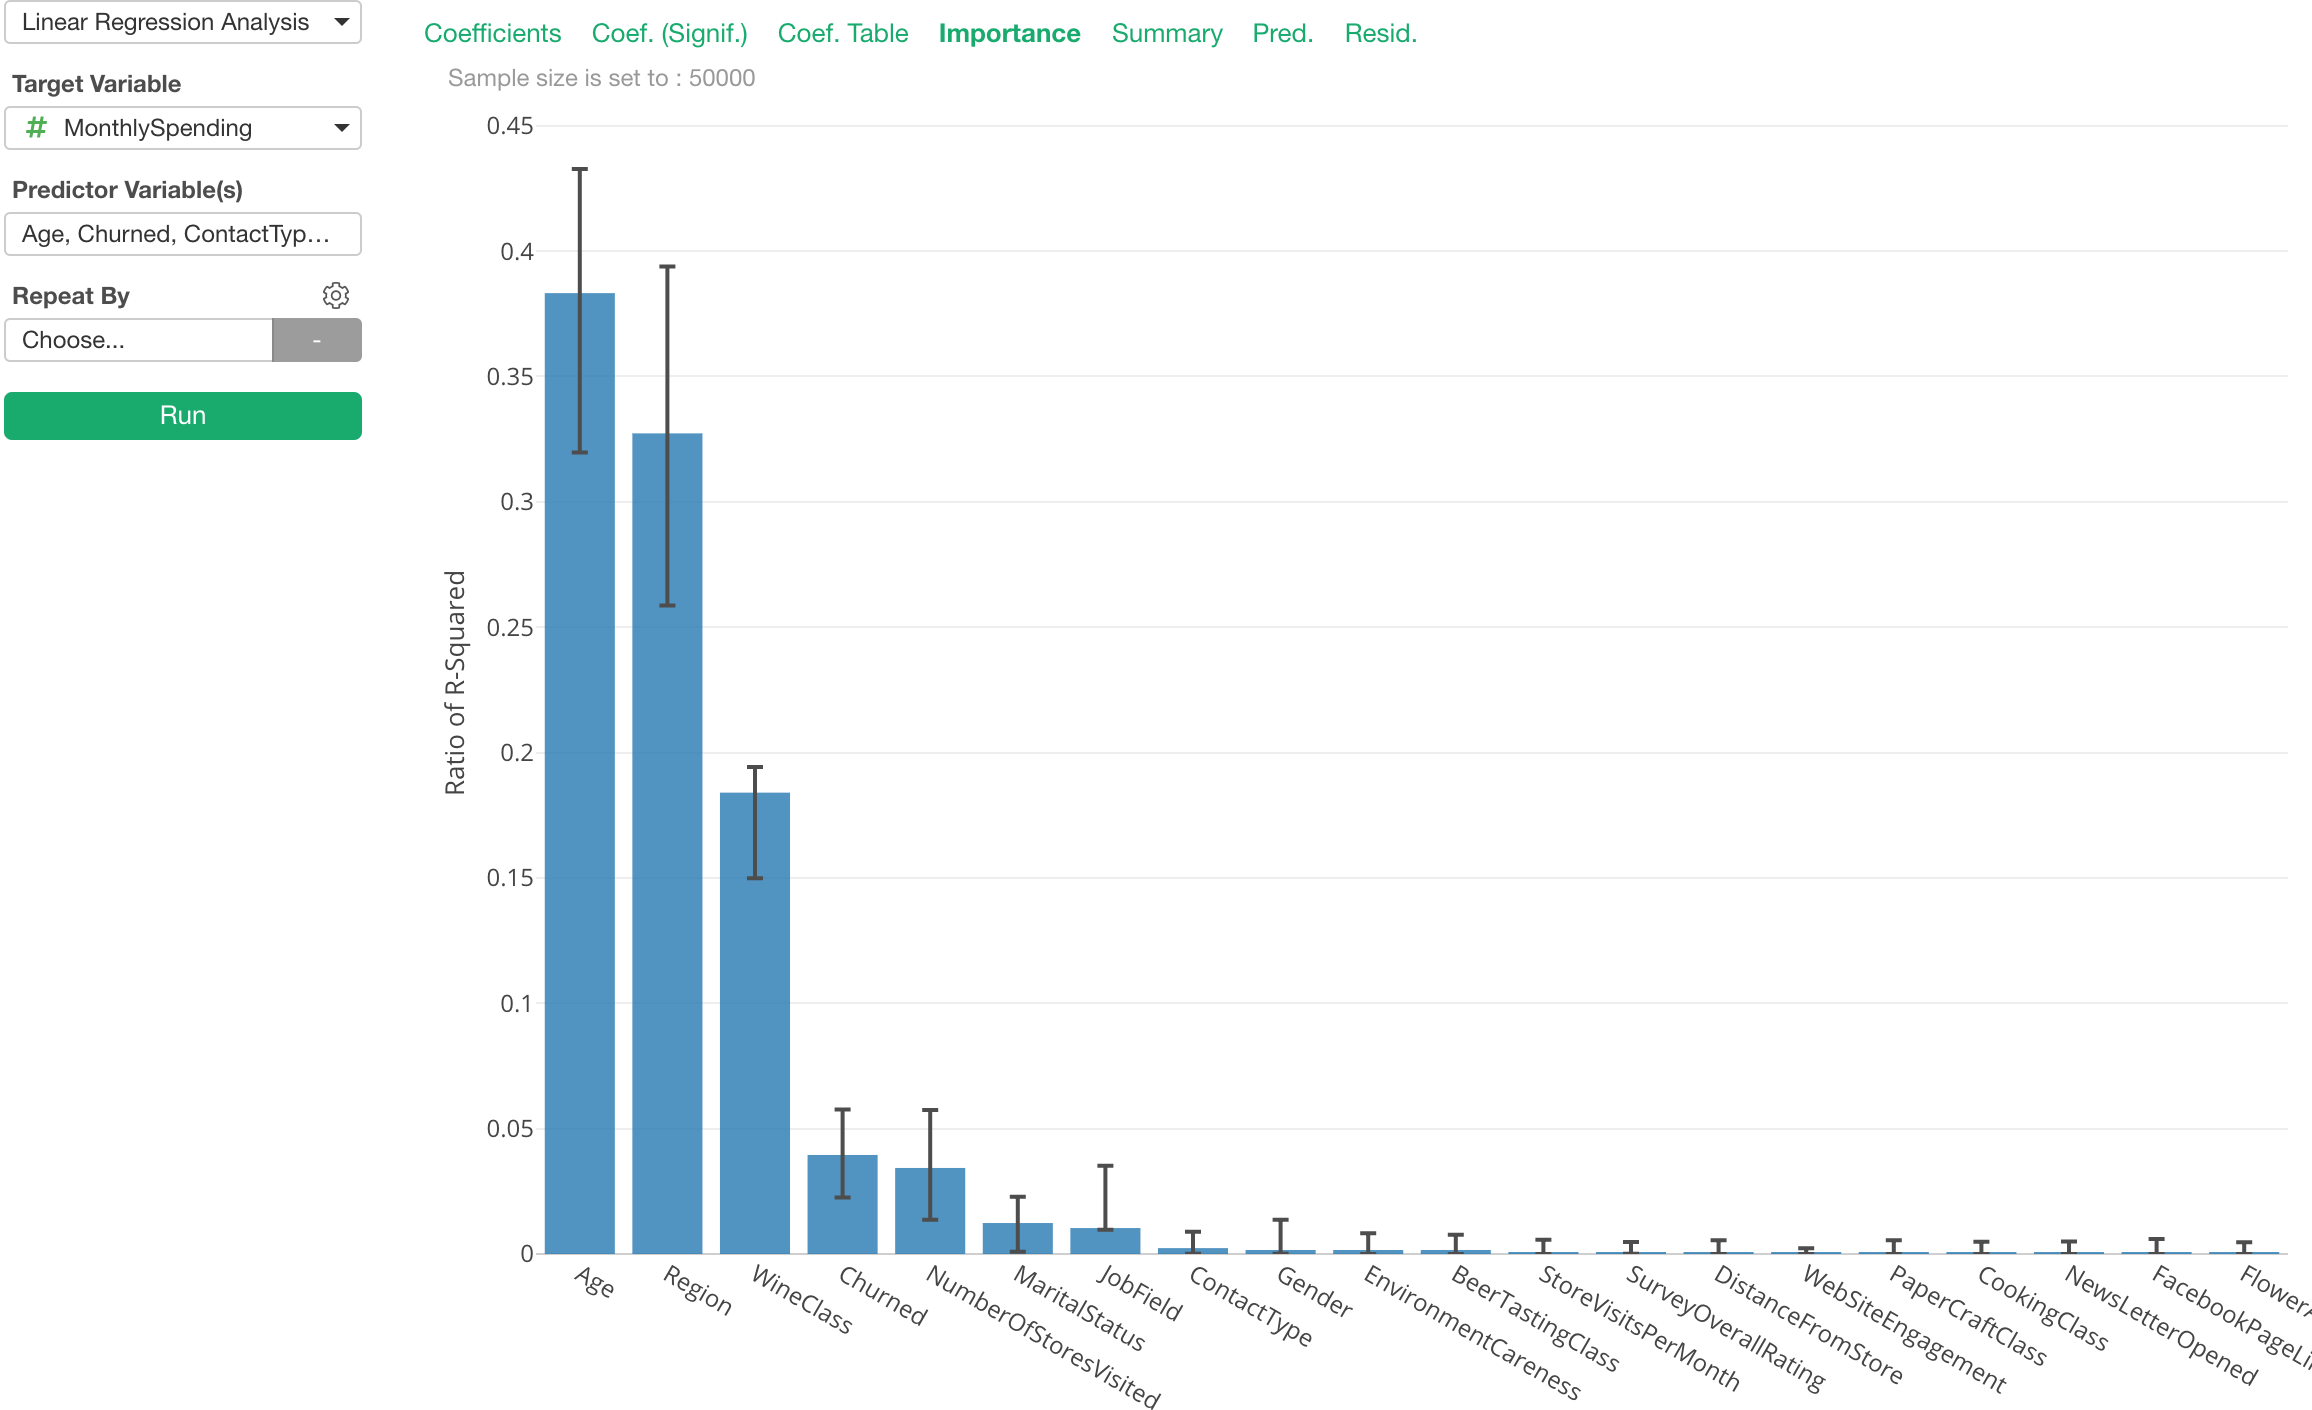
When we build Linear Regression models we can’t stop trying to see which predictor variables are more influential to the target variable in our head.
This ‘Relative Importance’ mode helps you see which predictor variables are more important by calculating their contributions to R-Square.
Marginal Effect
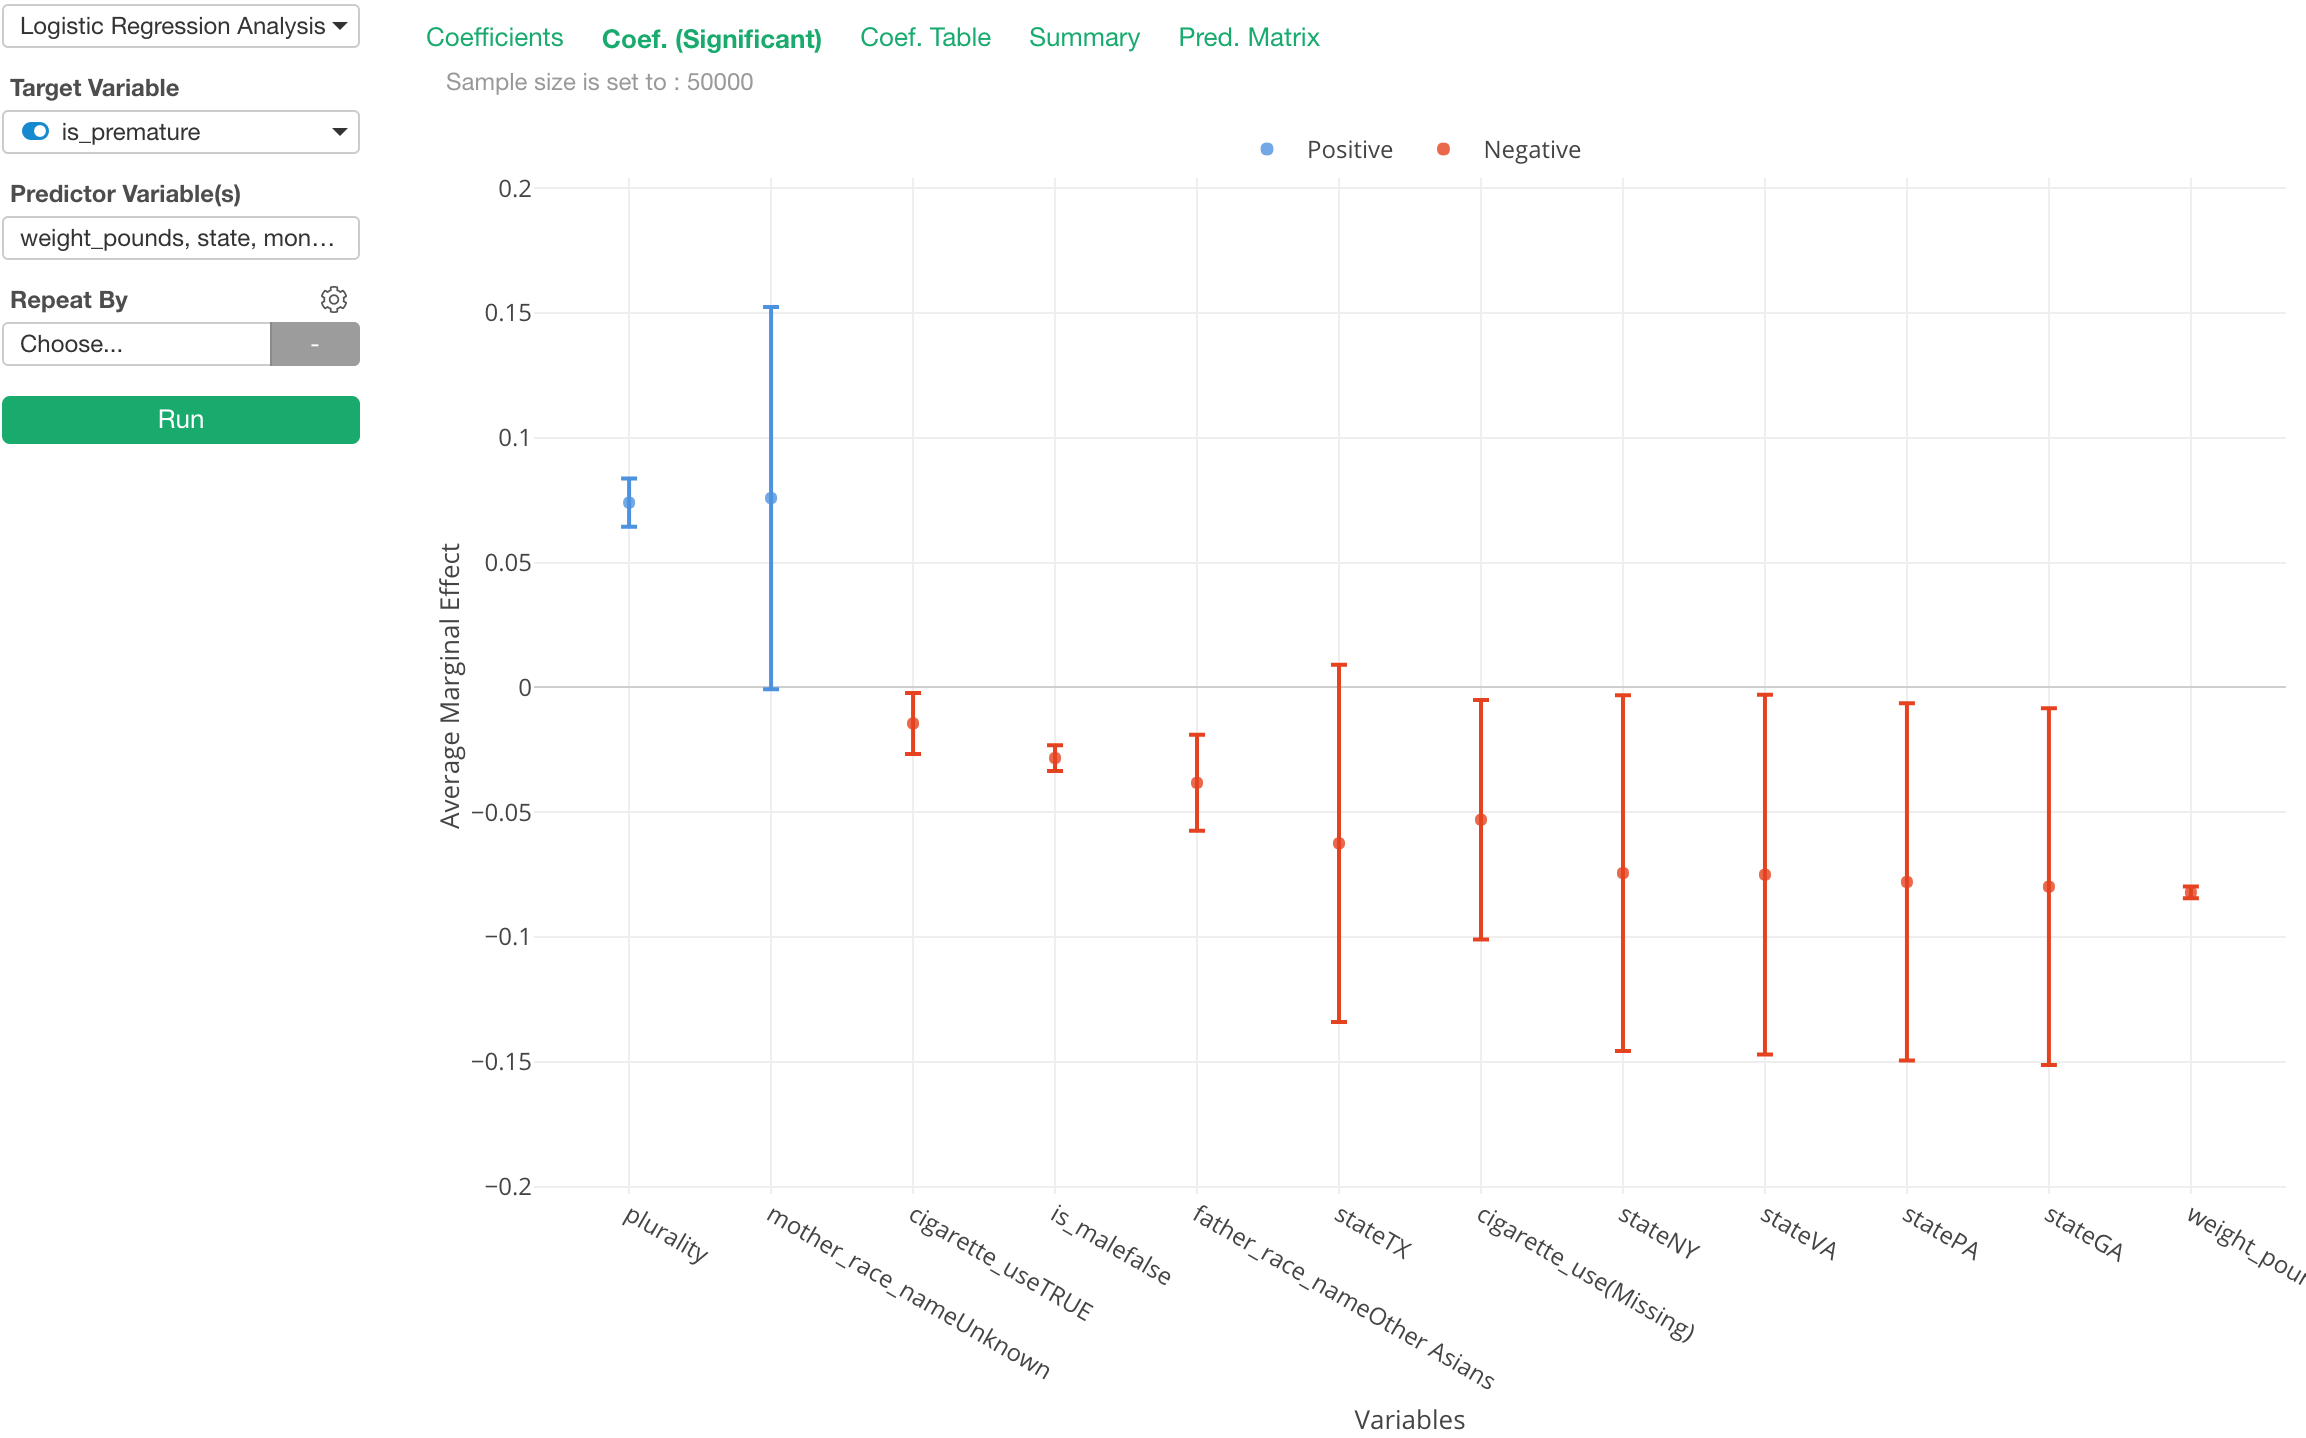
Interpreting the result of Logistic Model is hard because the coefficient of the logistic curve or even odds ratio is just not intuitive.
In the world of Economics and Political Science, there is something called Marginal Effect (or Average Marginal Effect) has been used instead of the coefficient/odds ratio because of its simplicity of the interpretation.
The chart above is showing Average Marginal Effect for the predictor variables. And we can interpret as ’if we see one point increase in a given predictor the chance of the target variable becoming TRUE increases N percent. Much more intuitive.
That’s it for this week.
Have a wonderful week!
Kan CEO/Exploratory
This is a weekly email update of what I have seen in Data Science / AI and thought were interesting, plus what Team Exploratory is working on.