Exploratory v16.4 Is Here! Hierarchical Clustering, Enhanced Visualizations, More Flexible Dashboards, and More
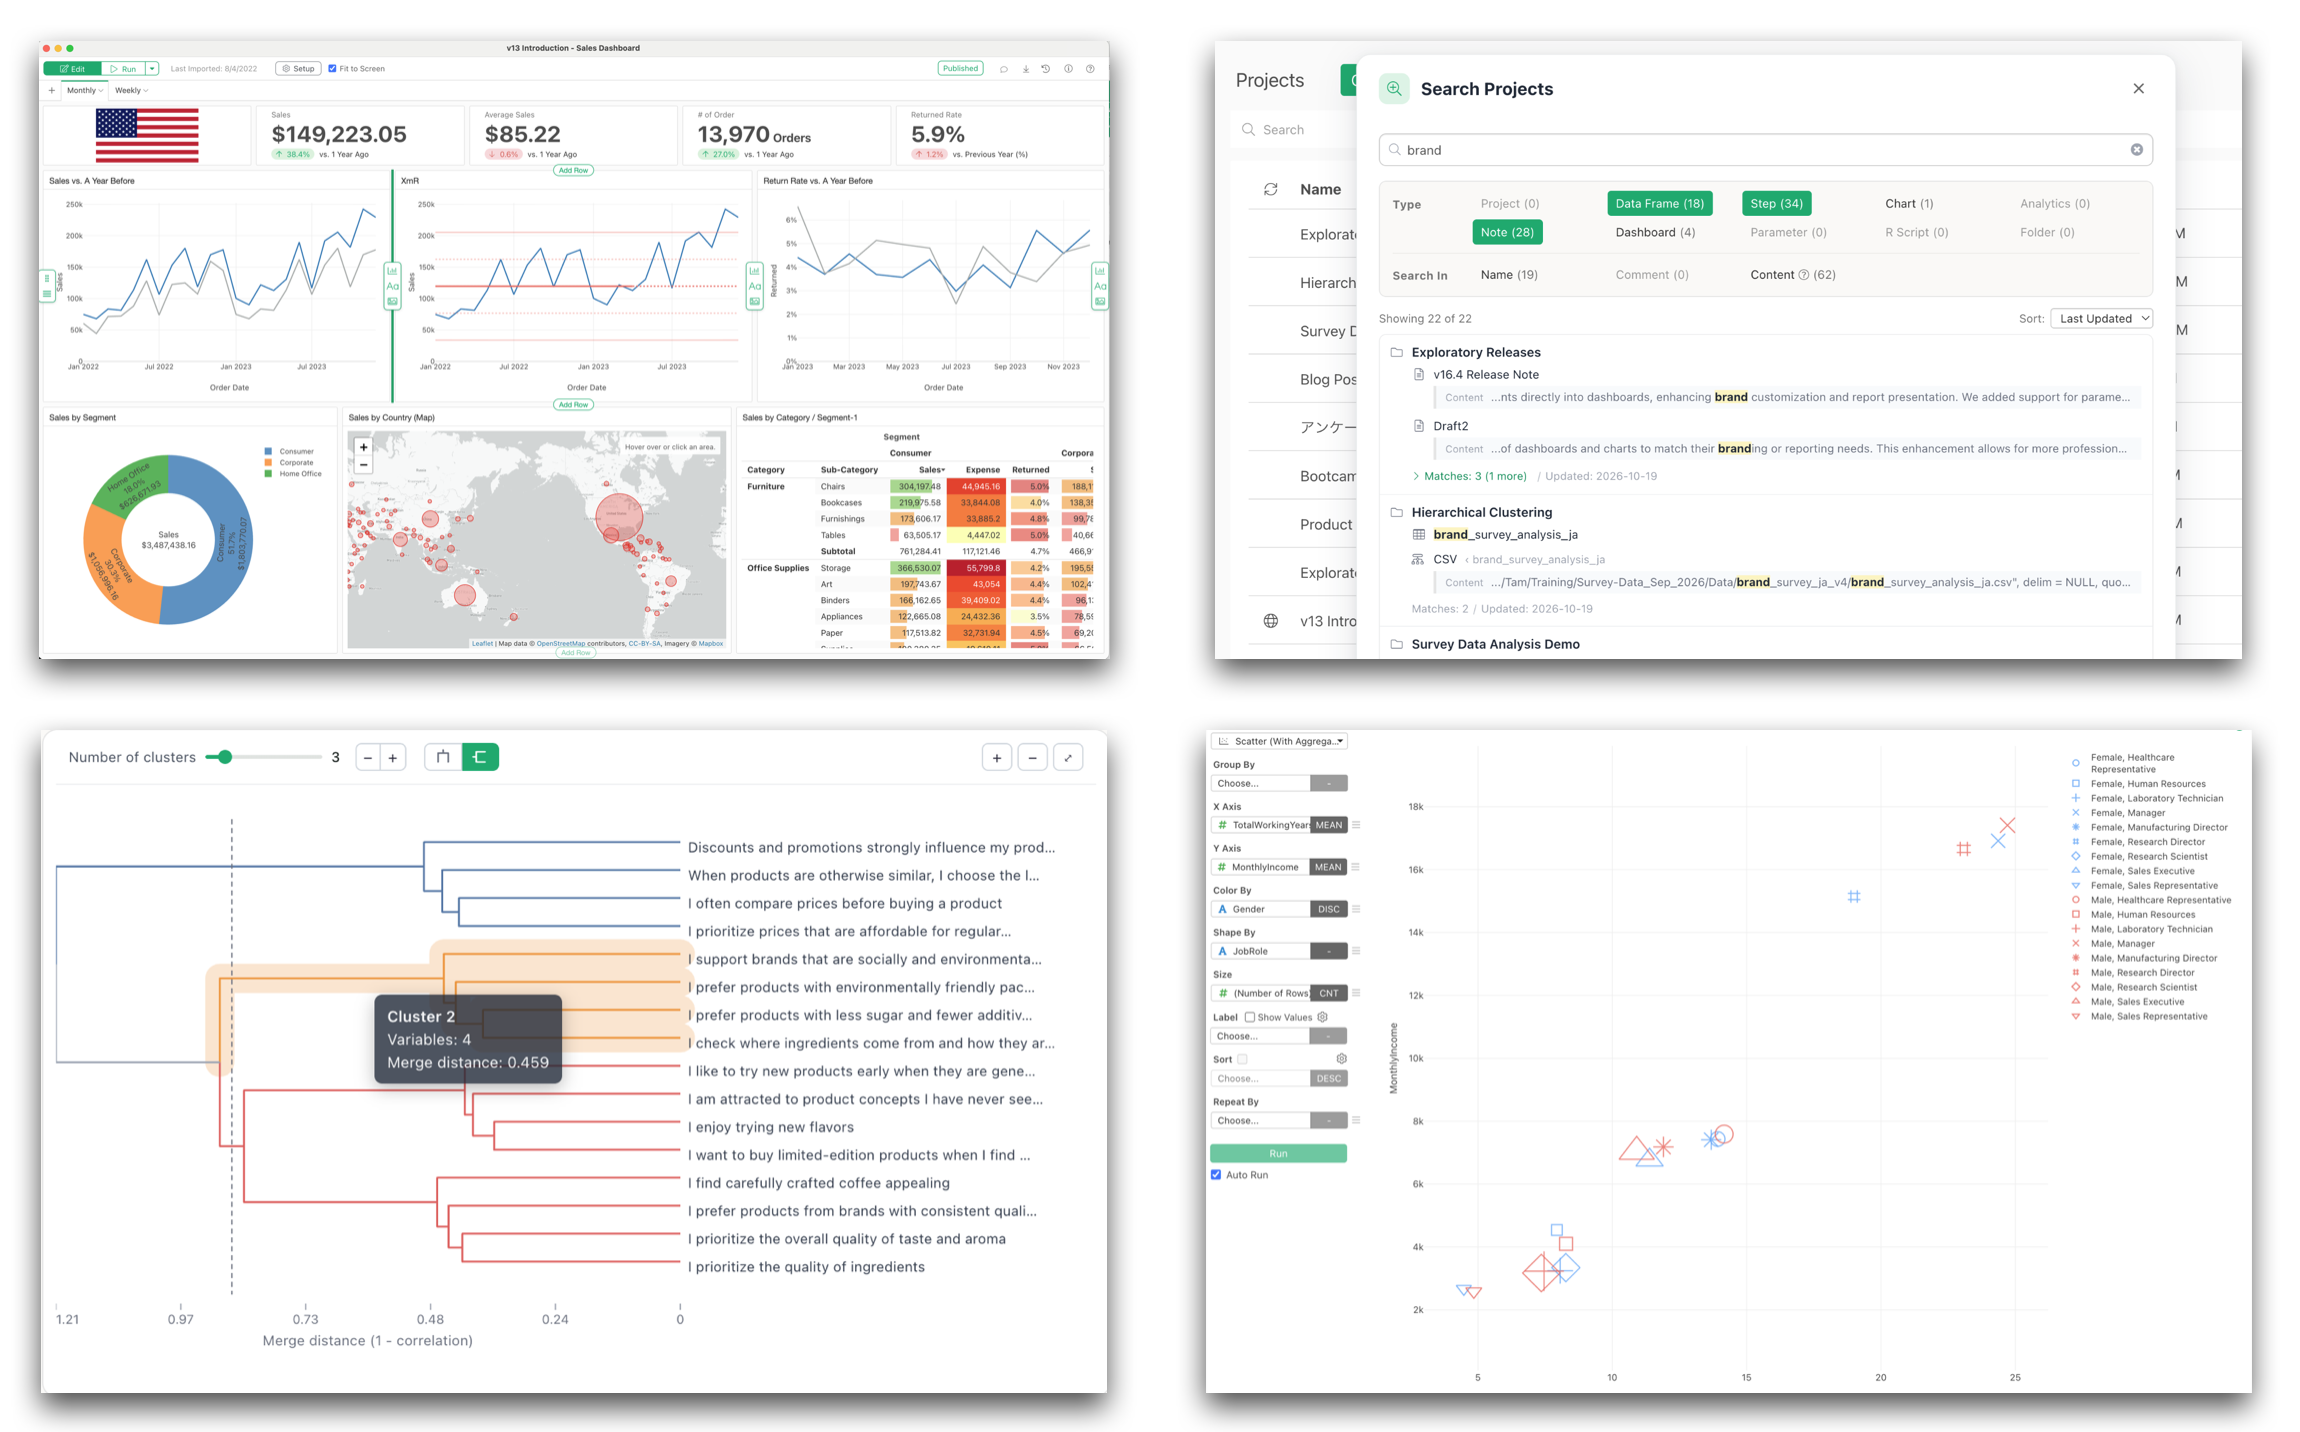
We’re excited to announce the release of Exploratory v16.4, bringing powerful new analytics capabilities, improved visualizations, more flexible dashboards, and a faster, more intuitive workflow.
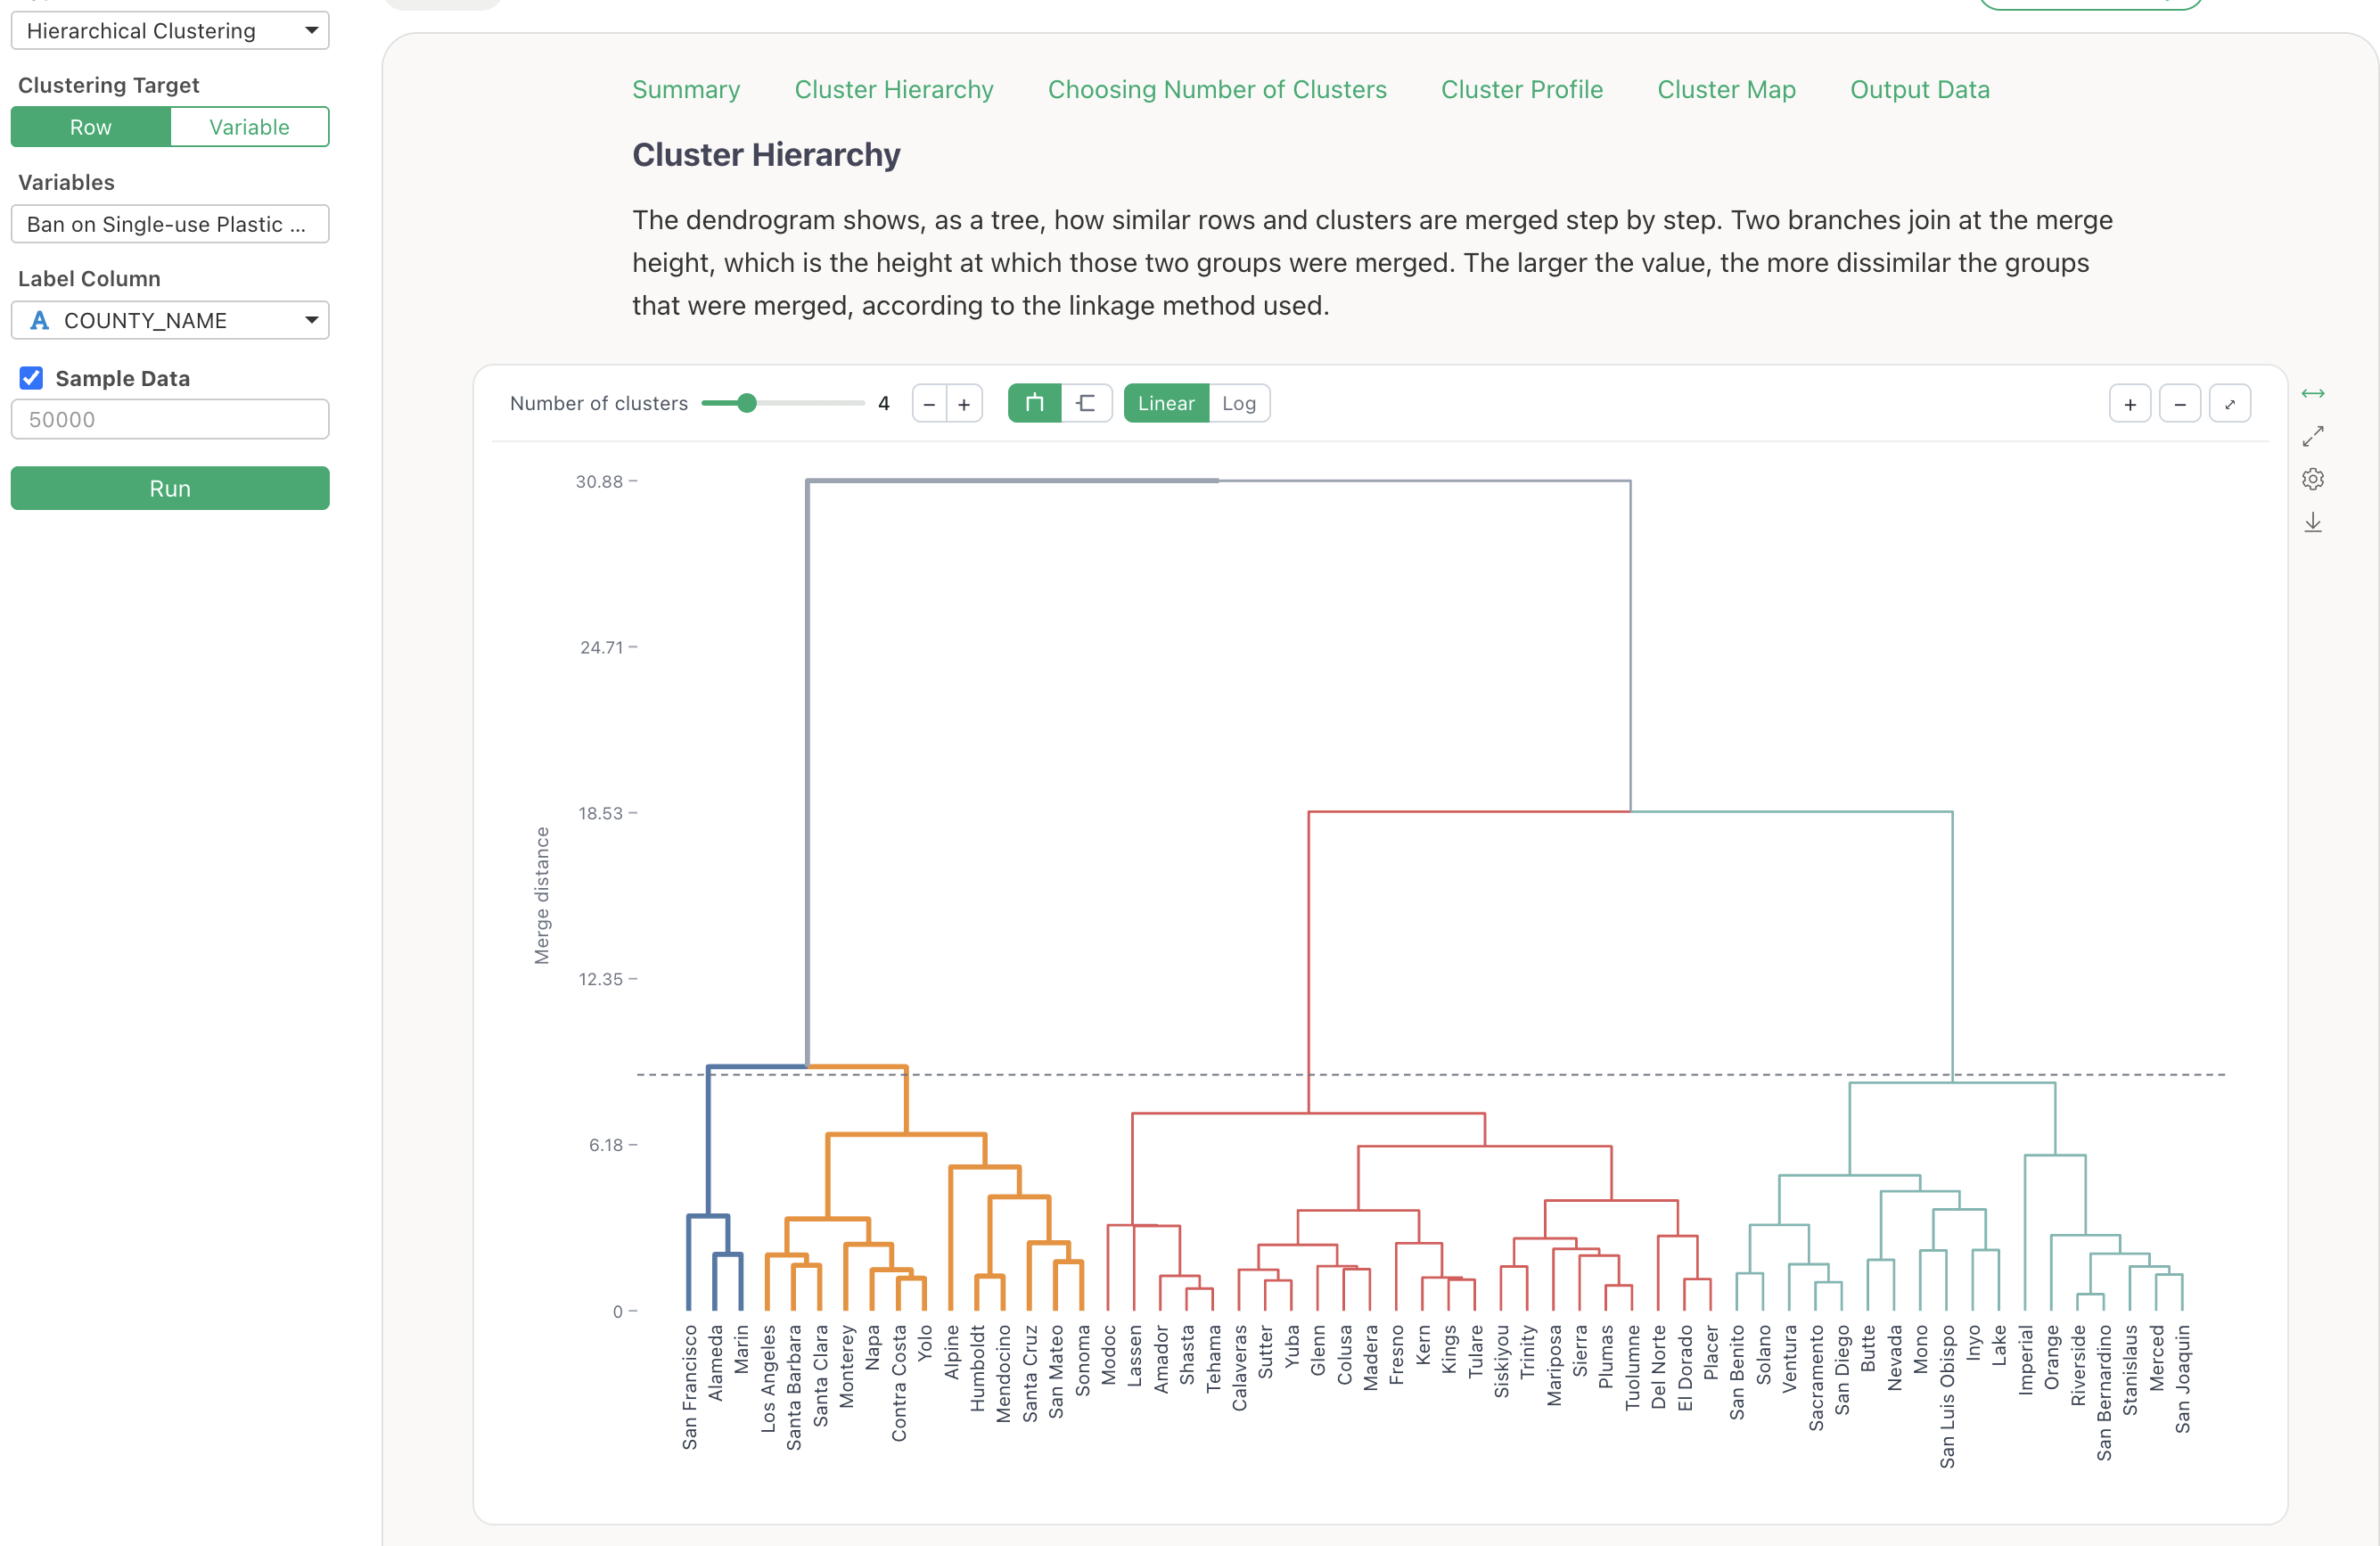
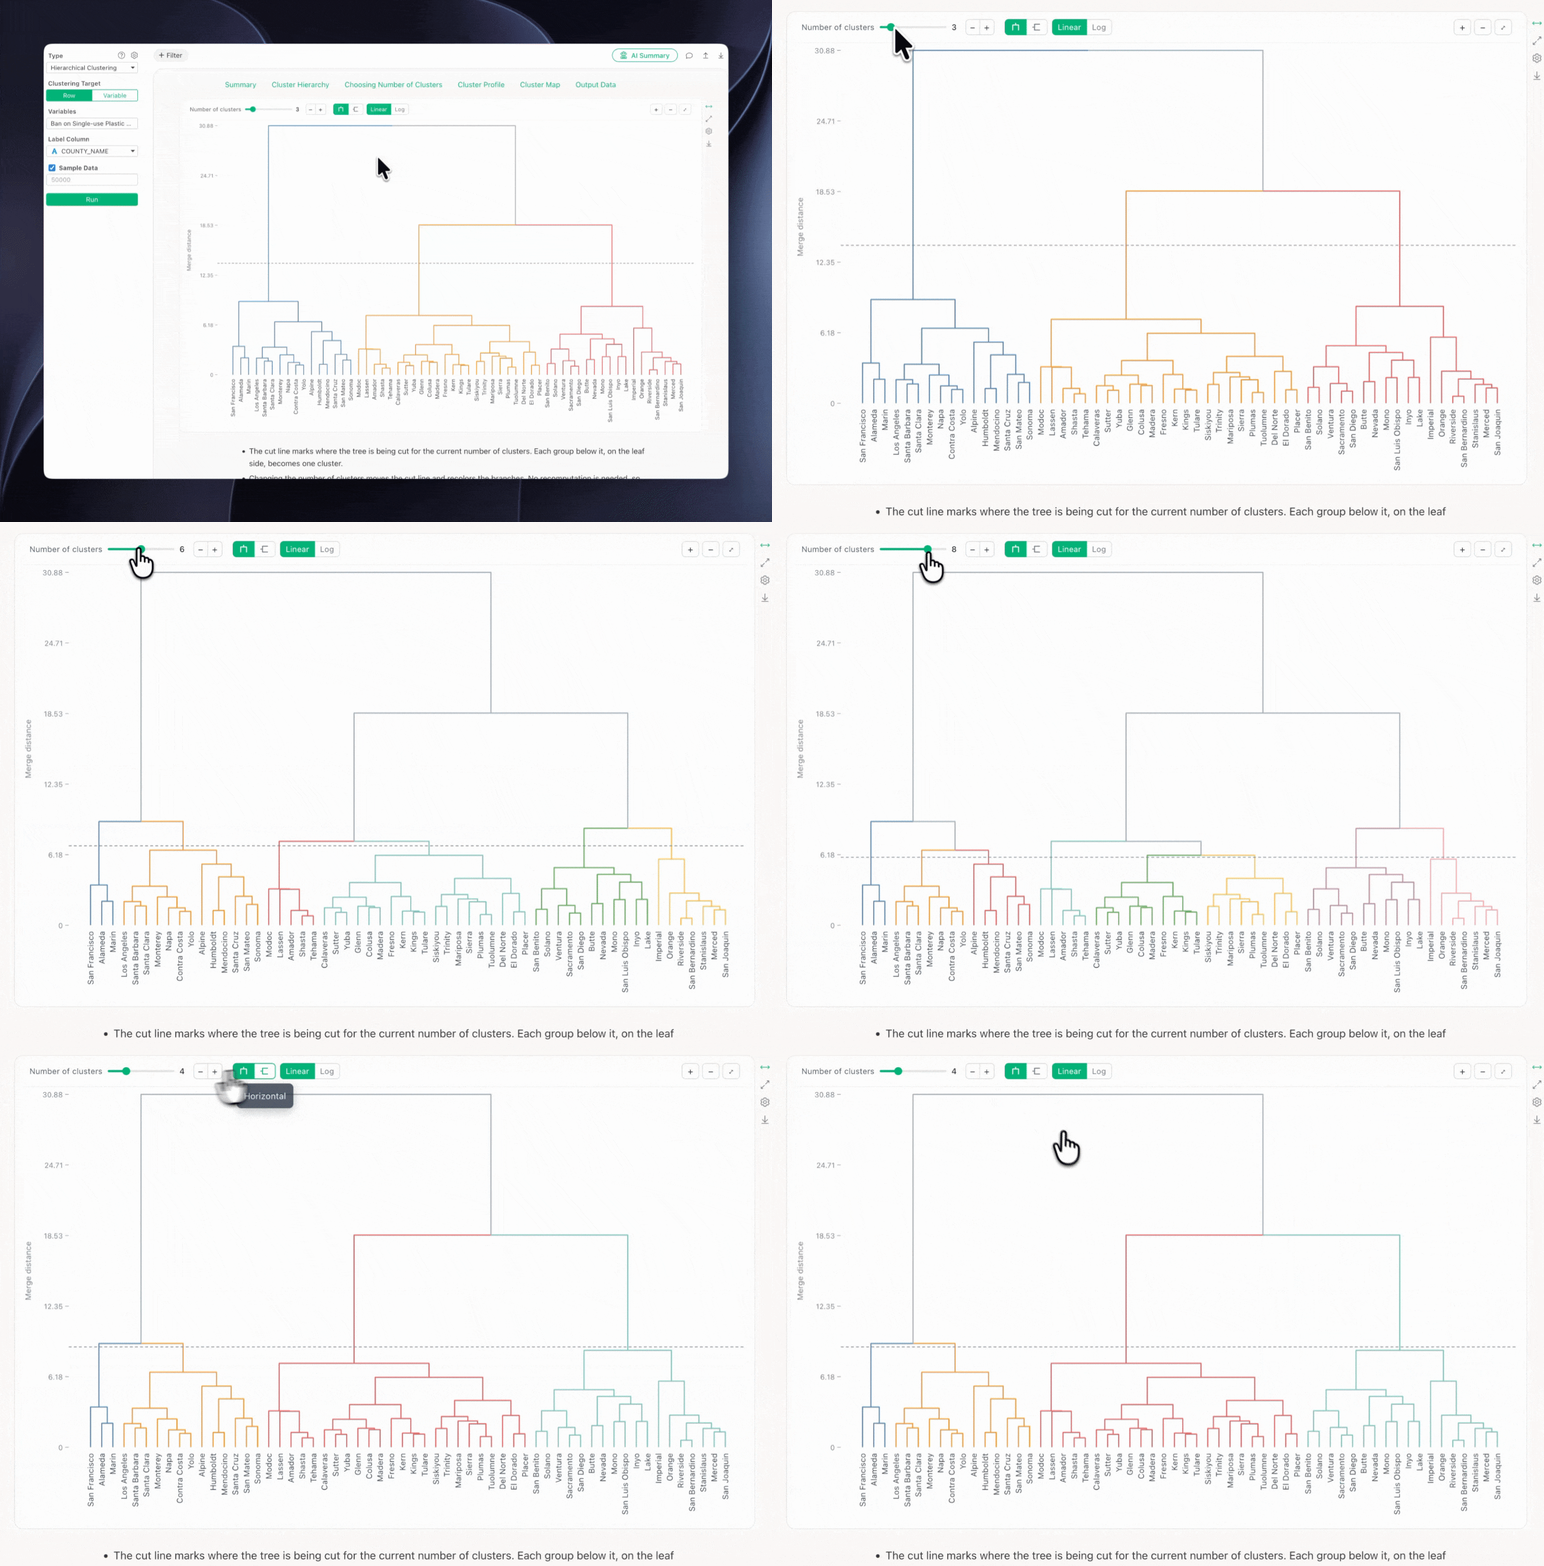
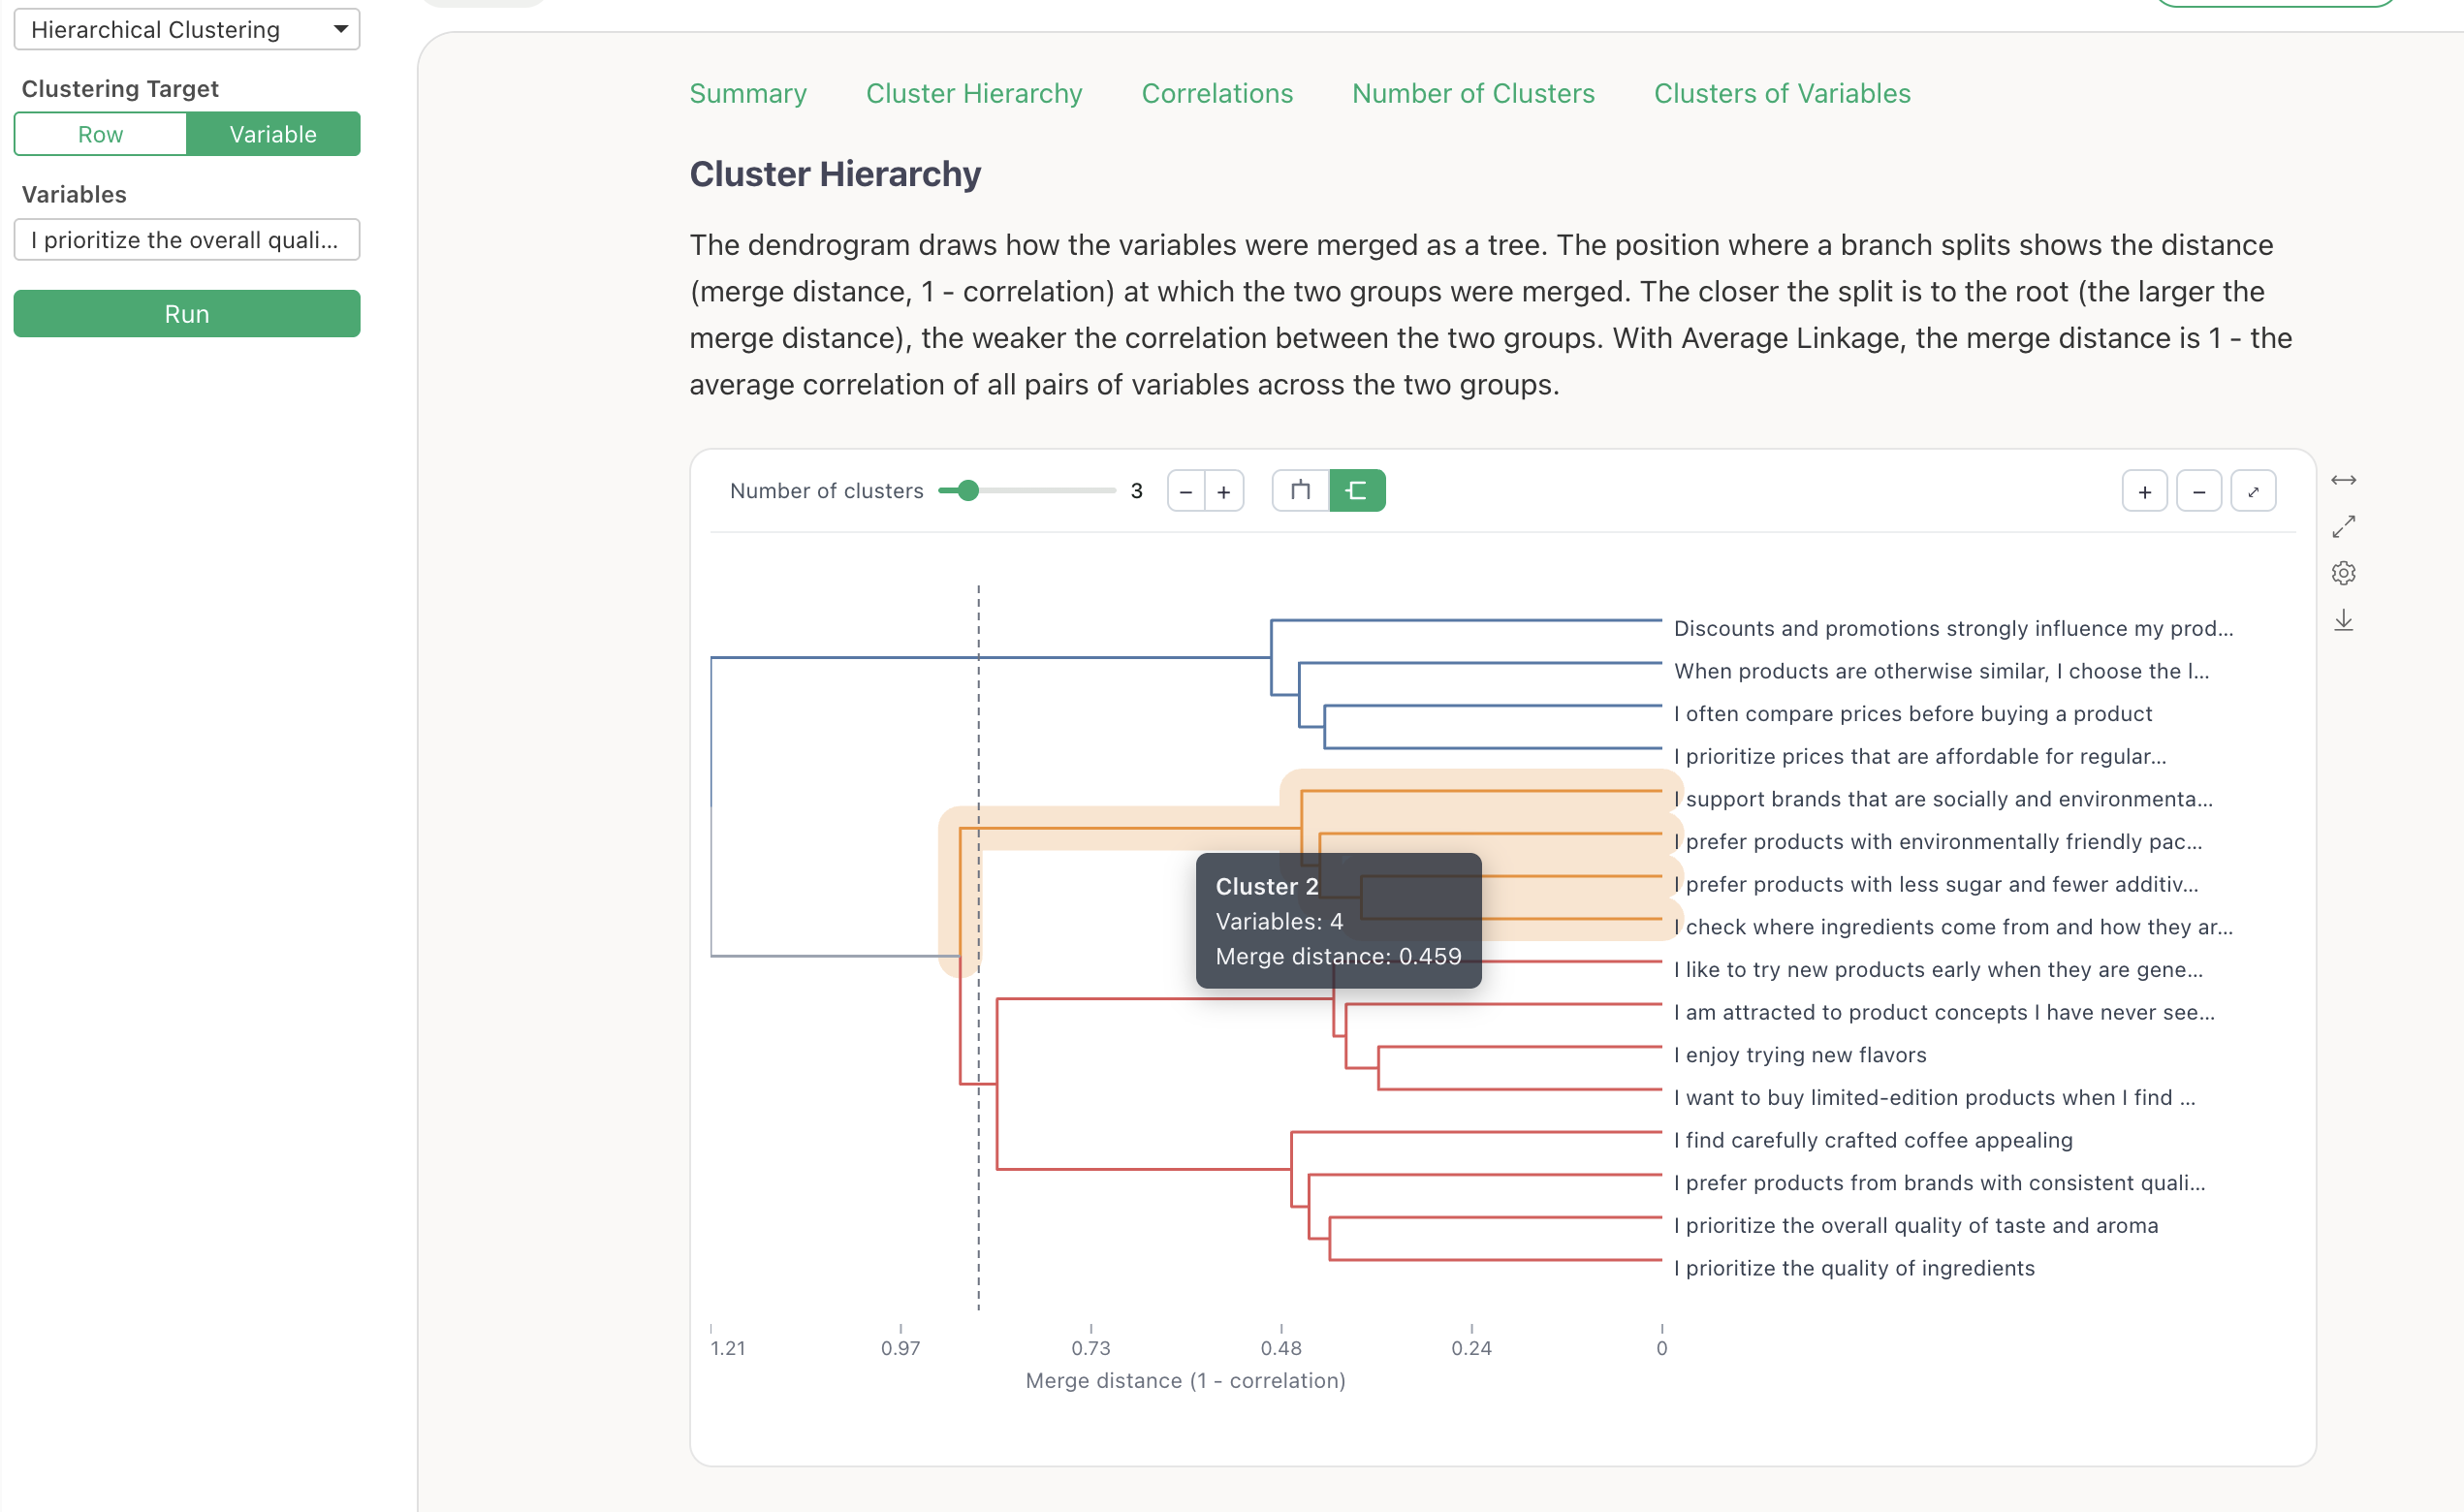
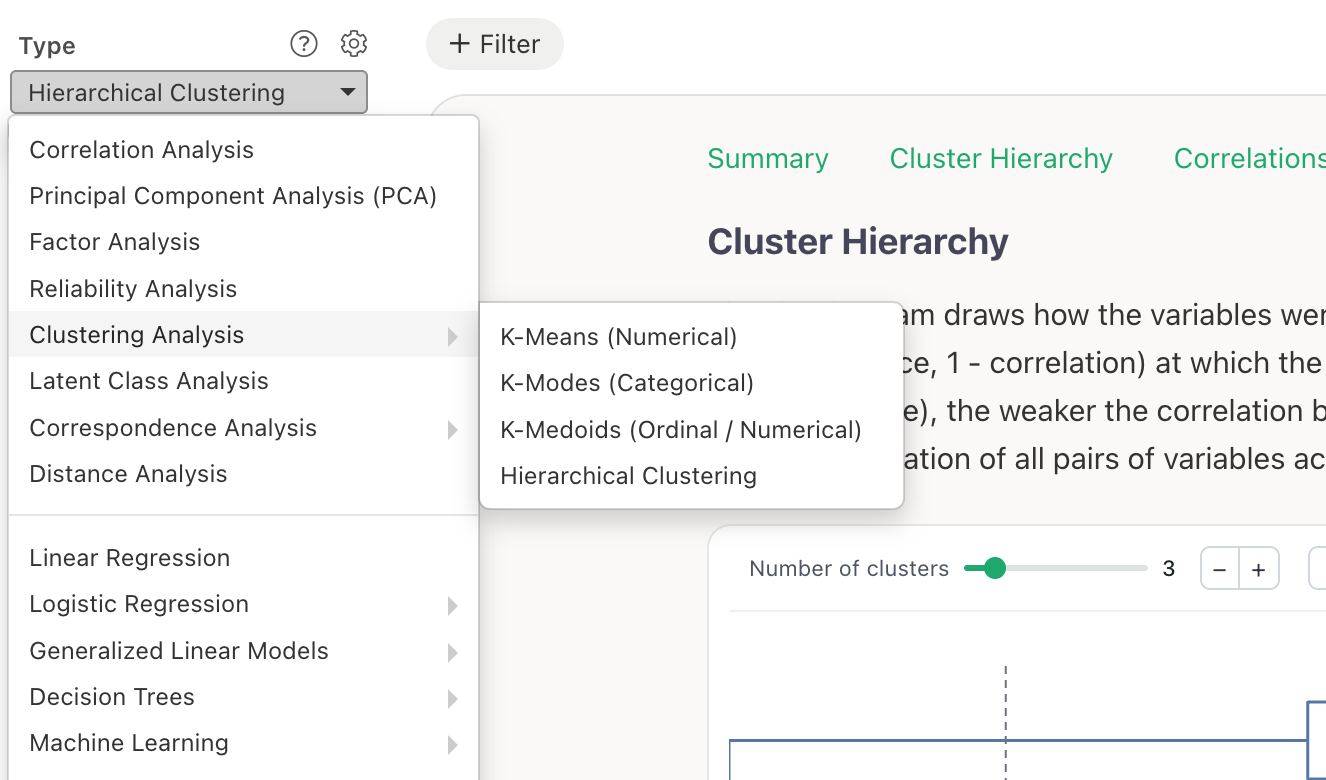
One of the biggest additions is Hierarchical Clustering, which lets you interactively explore how observations and variables are grouped based on their similarities.
We’ve also made survey analysis easier with built-in Net Promoter Score (NPS) calculations, improved group comparisons, and statistical test results displayed directly on charts.
Beyond analytics, this release introduces significant enhancements to dashboards, search, data wrangling, and everyday chart interactions.
Let’s take a look at what’s new!
2. Survey Analytics: Easier NPS Calculations and Group Comparisons
We’ve continued improving survey analytics in v16.4, making common calculations and comparisons faster and easier.
Calculate NPS Directly in Pivot Tables
Net Promoter Score (NPS) is a widely used metric for measuring customer loyalty and willingness to recommend a product or service.
It is typically calculated from responses on a 0–10 scale:
- Promoters: Scores of 9–10
- Passives: Scores of 7–8
- Detractors: Scores of 0–6
NPS is calculated as:
NPS = % Promoters − % Detractors
Previously, calculating NPS required additional steps to categorize respondents and calculate the percentages.
In v16.4, you can now calculate NPS directly from the Pivot Table menu.
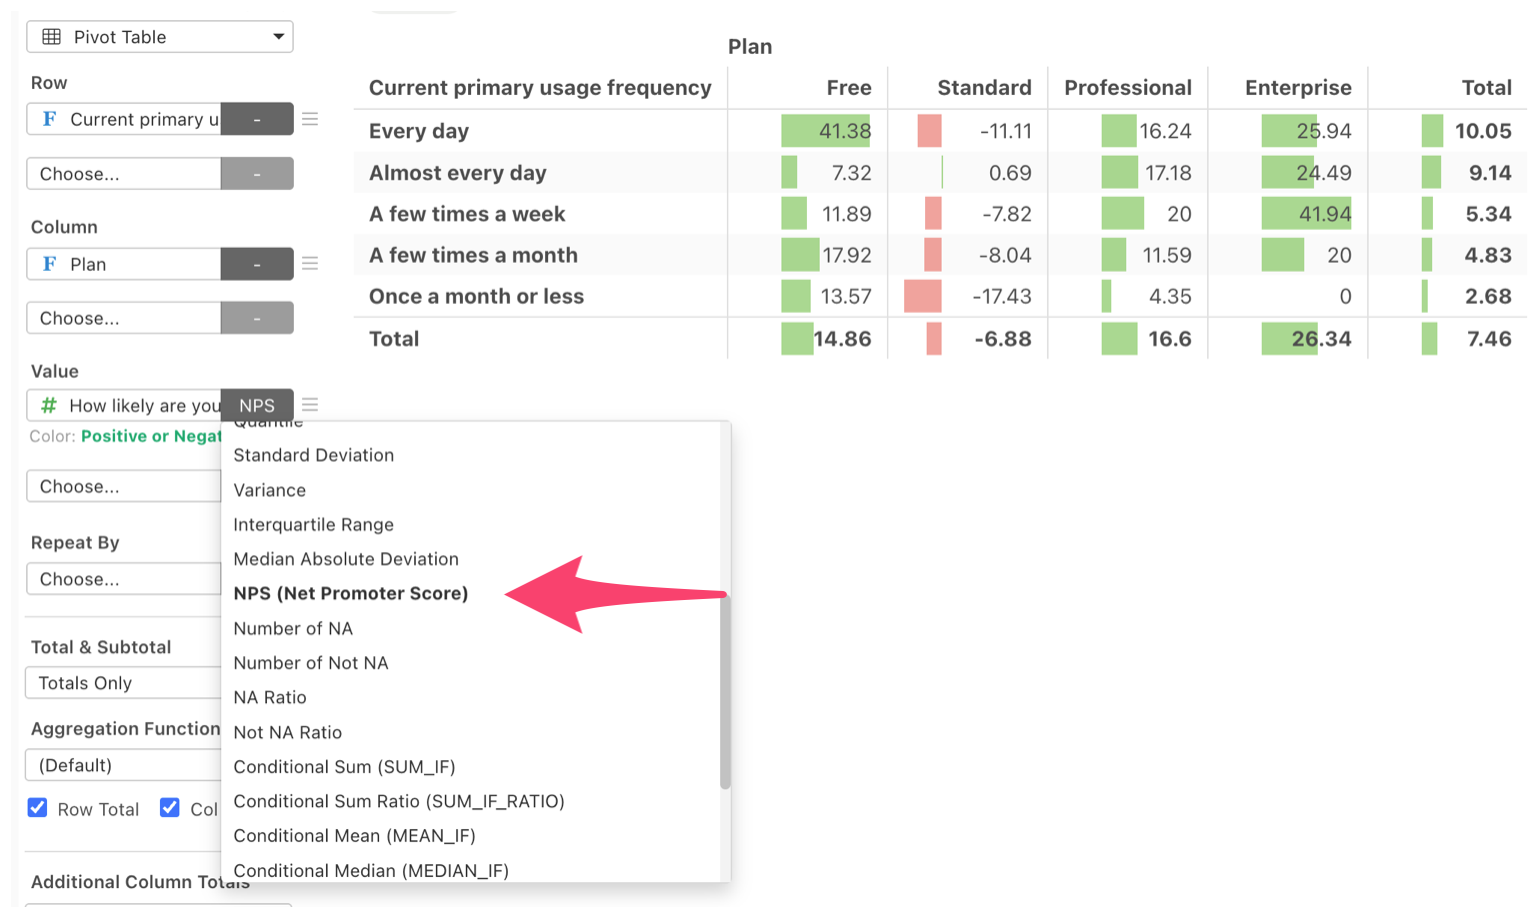
This makes it easy to compare NPS across customer segments, regions, age groups, or other categories without manually preparing the calculations.
Compare Overall Results with Individual Groups
Exploratory’s Repeat feature lets you create separate charts or tables for different groups, such as age groups, regions, or customer segments.
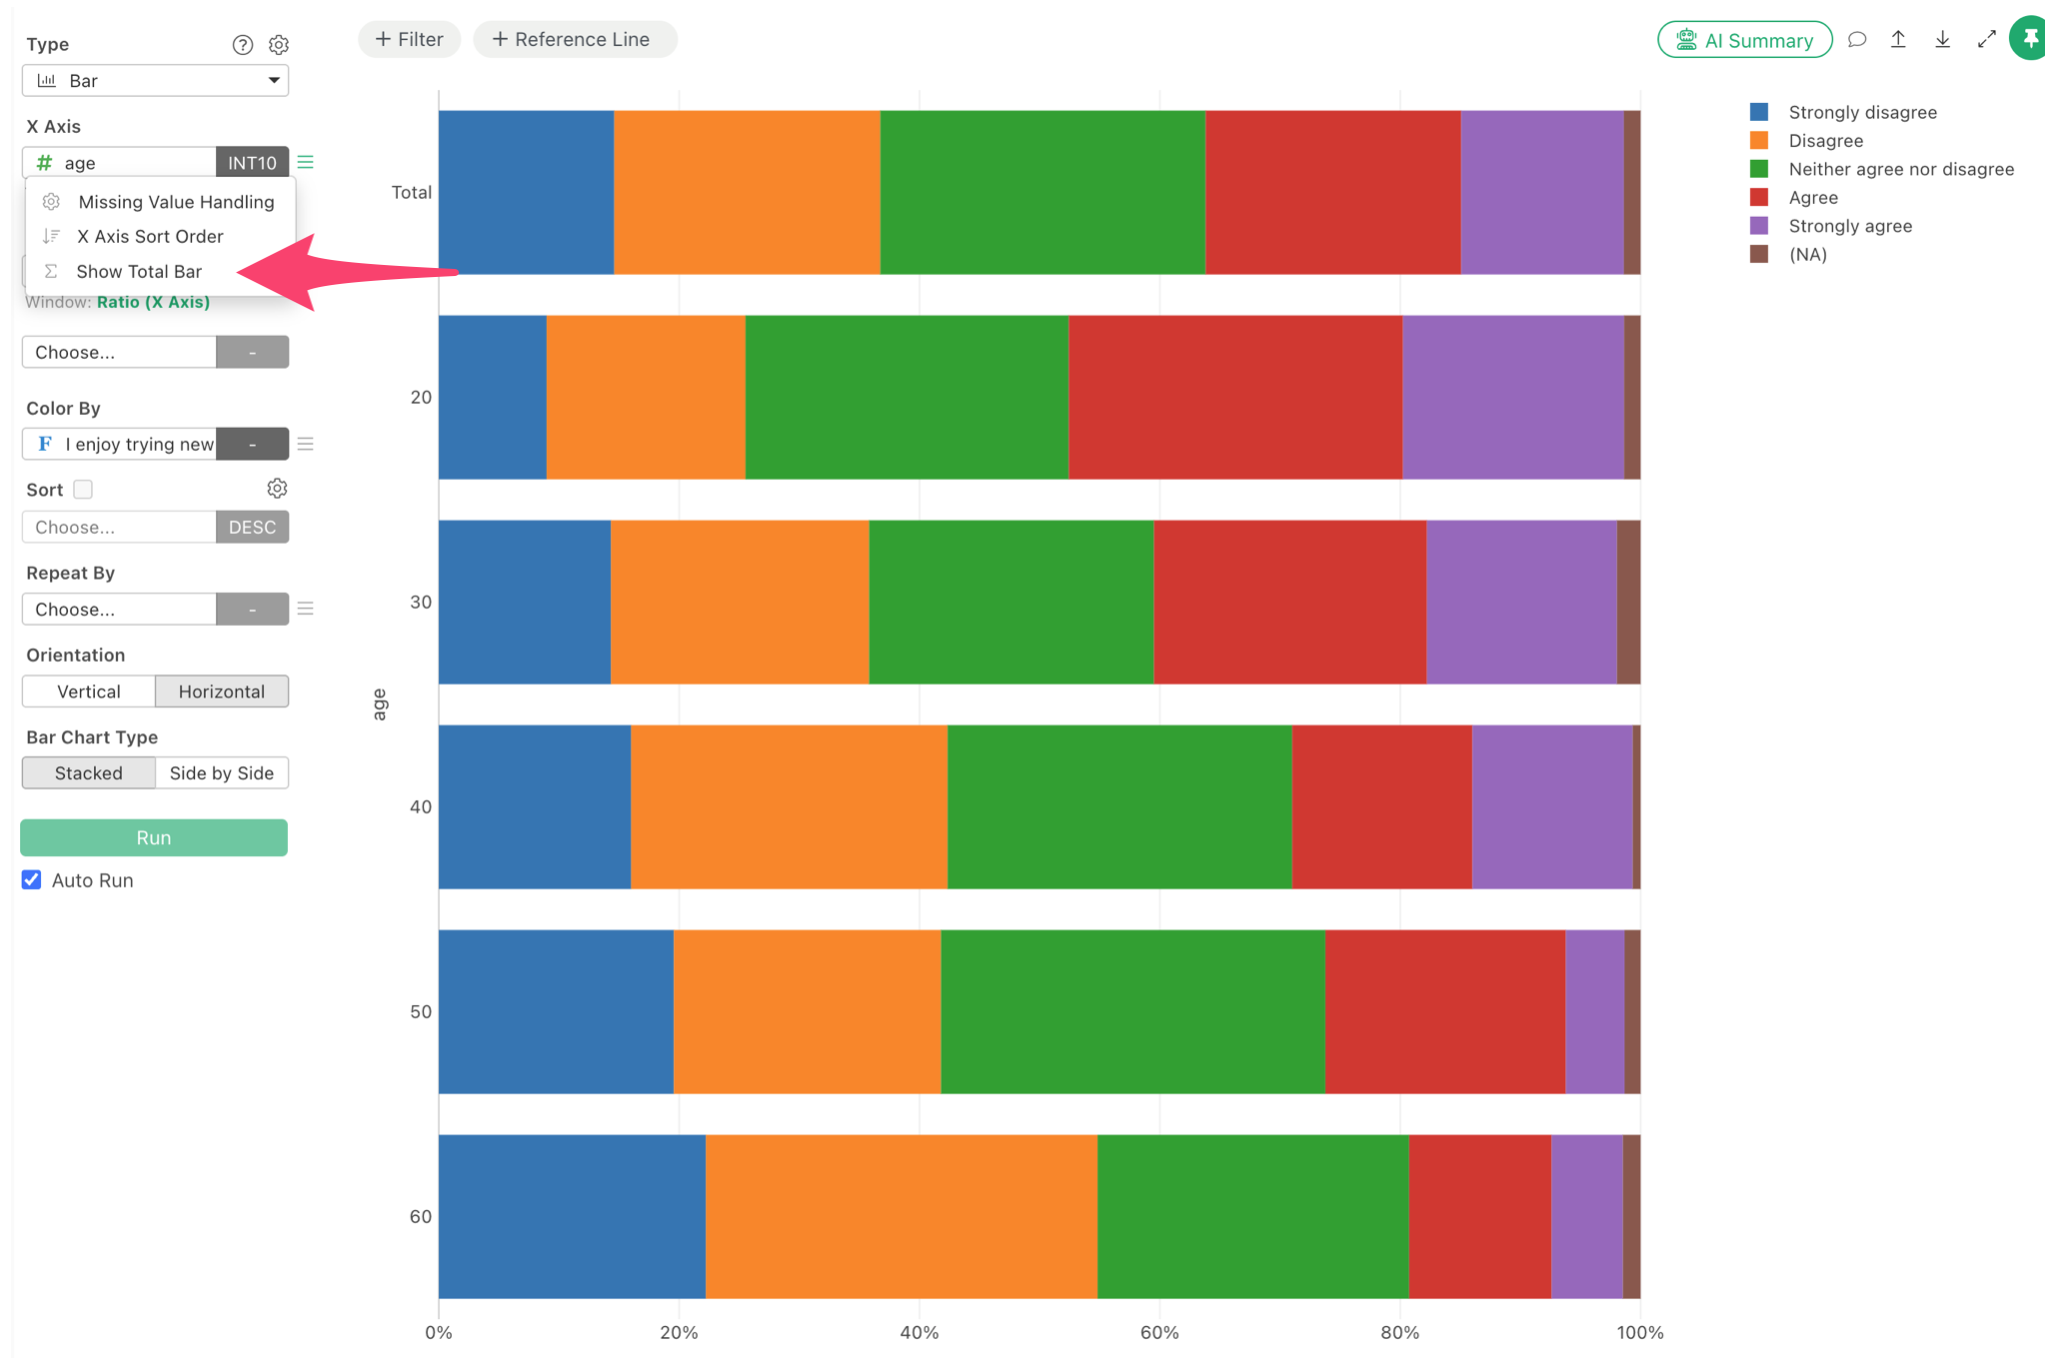
With v16.4, you can now include the overall results alongside the individual groups.
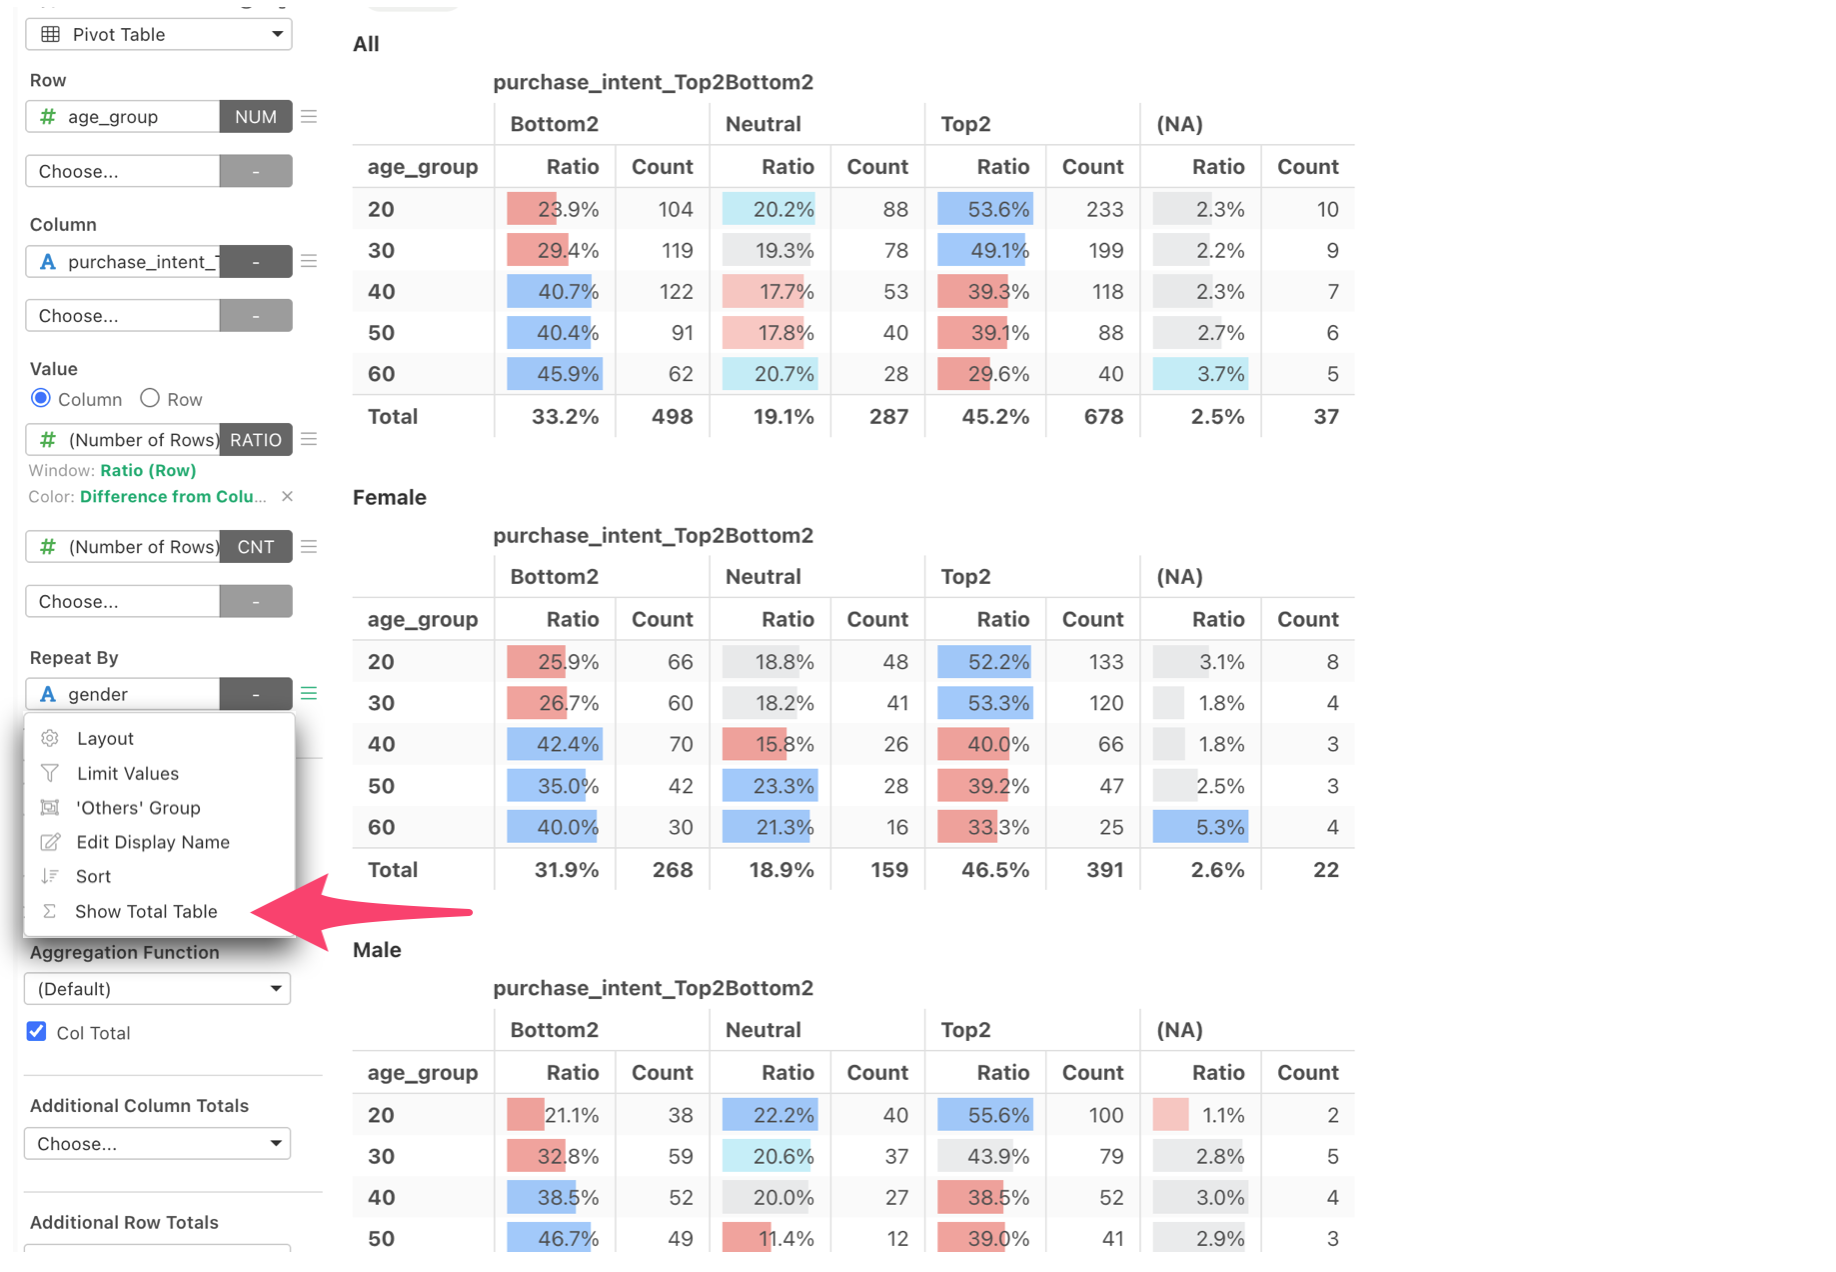
For example, when comparing customer satisfaction across age groups, you can display the overall distribution next to the distributions for customers in their 20s, 30s, and 40s.
This makes it much easier to understand how each group differs from the overall population without creating separate charts or tables.
The enhancement is not just for Pivot Tables, but also for other chart types like bar chart.
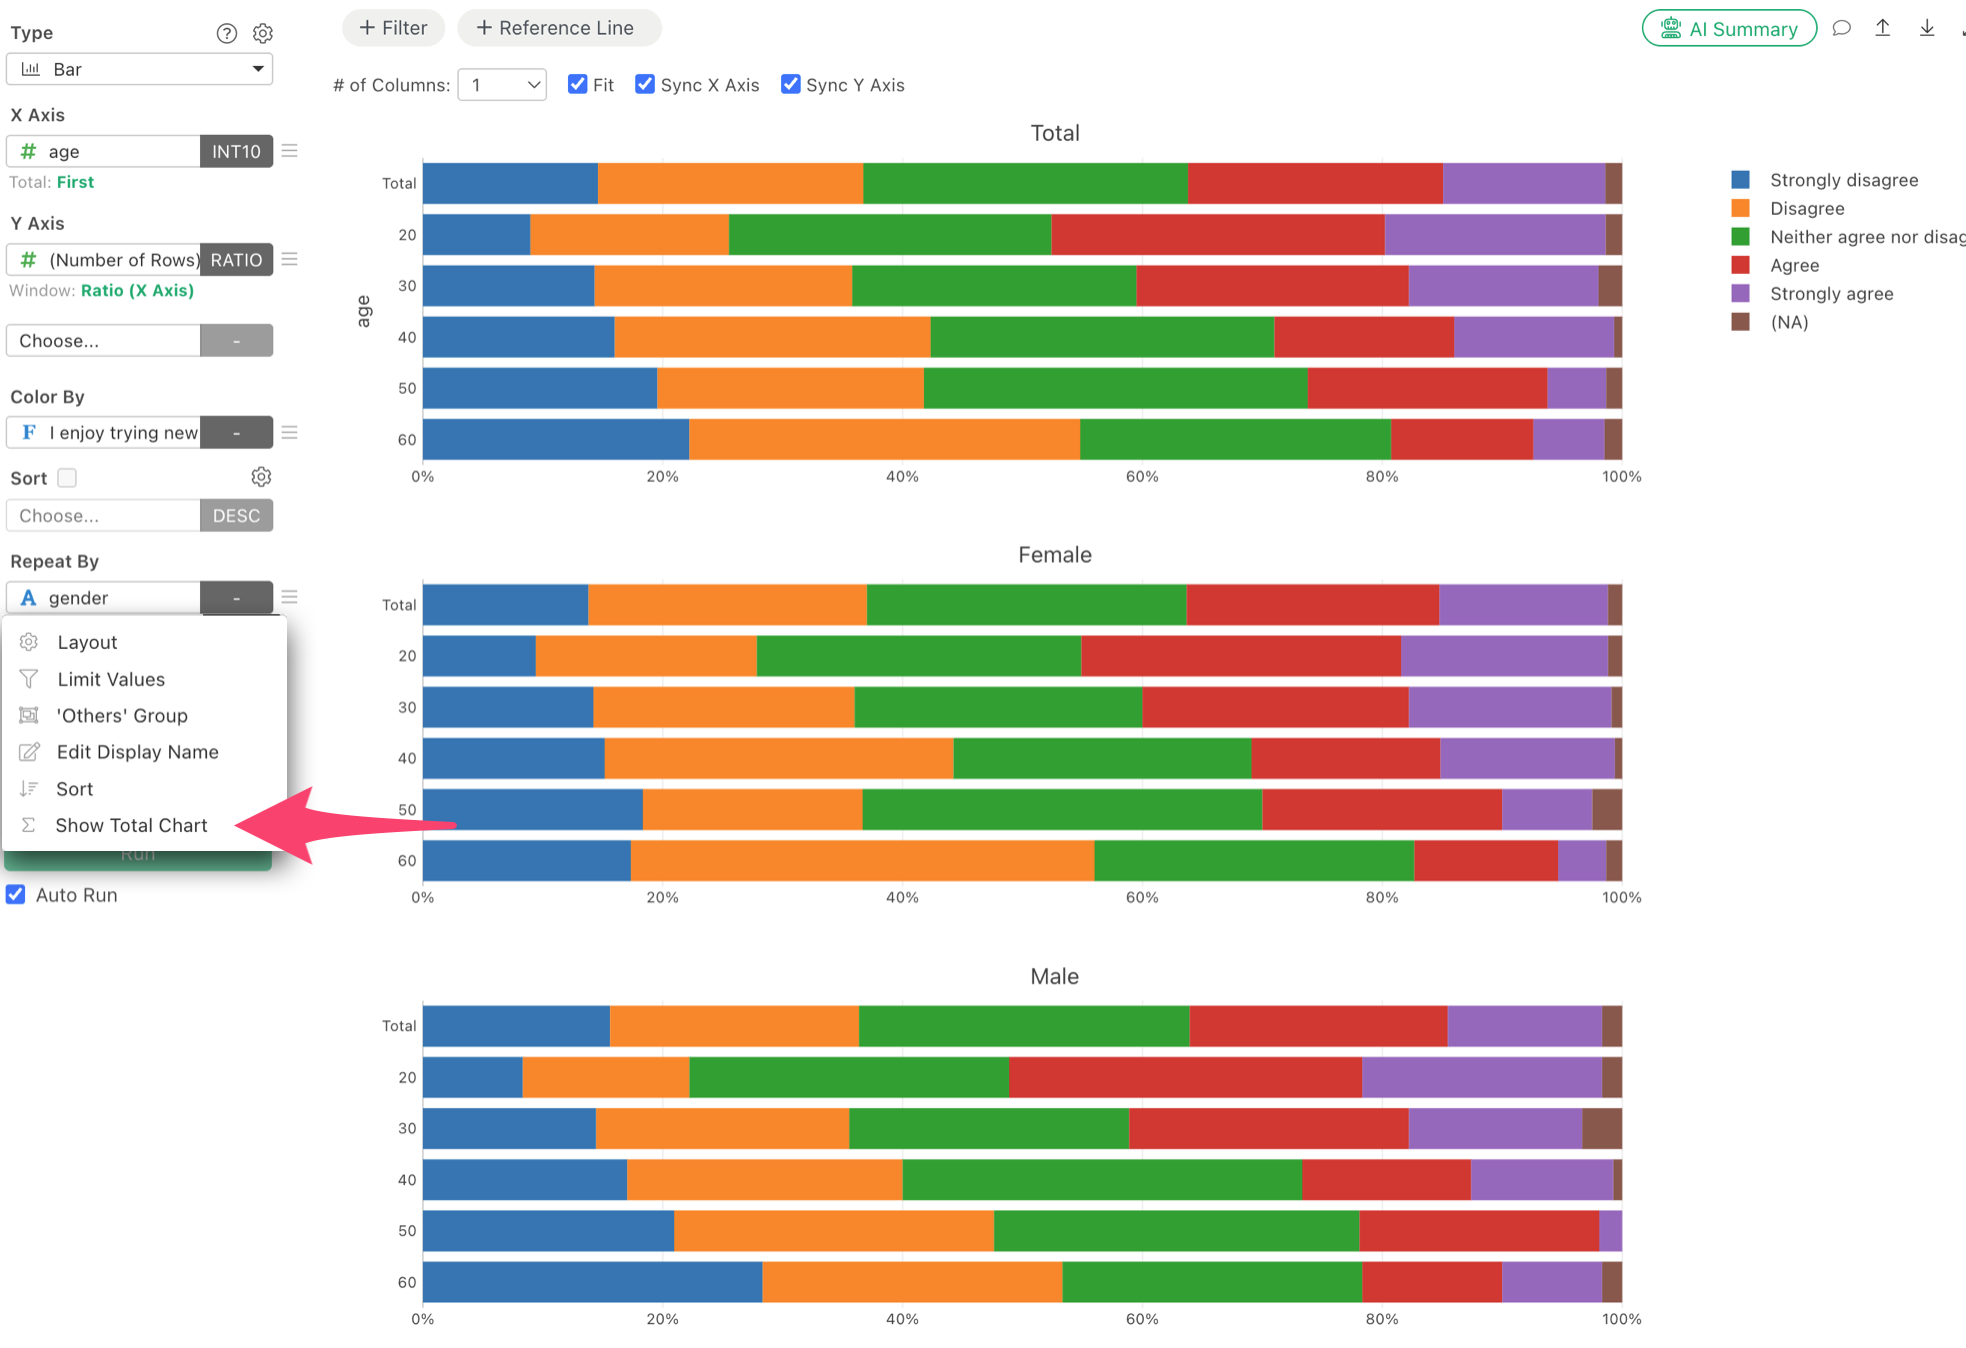
And you can even have the total bar inside the bar chart. Just select ‘Show Total Bar’ at the X-Axis menu.
3. Visualizations: More Powerful and Easier to Interpret
We’ve introduced several enhancements to help you communicate patterns, differences, and statistical findings more effectively.
Display Statistical Test Results on Box Plots
Box plots are useful for comparing data distributions across groups, but visual differences don’t necessarily indicate statistically significant differences.
In v16.4, you can now display statistical test results directly on box plots.
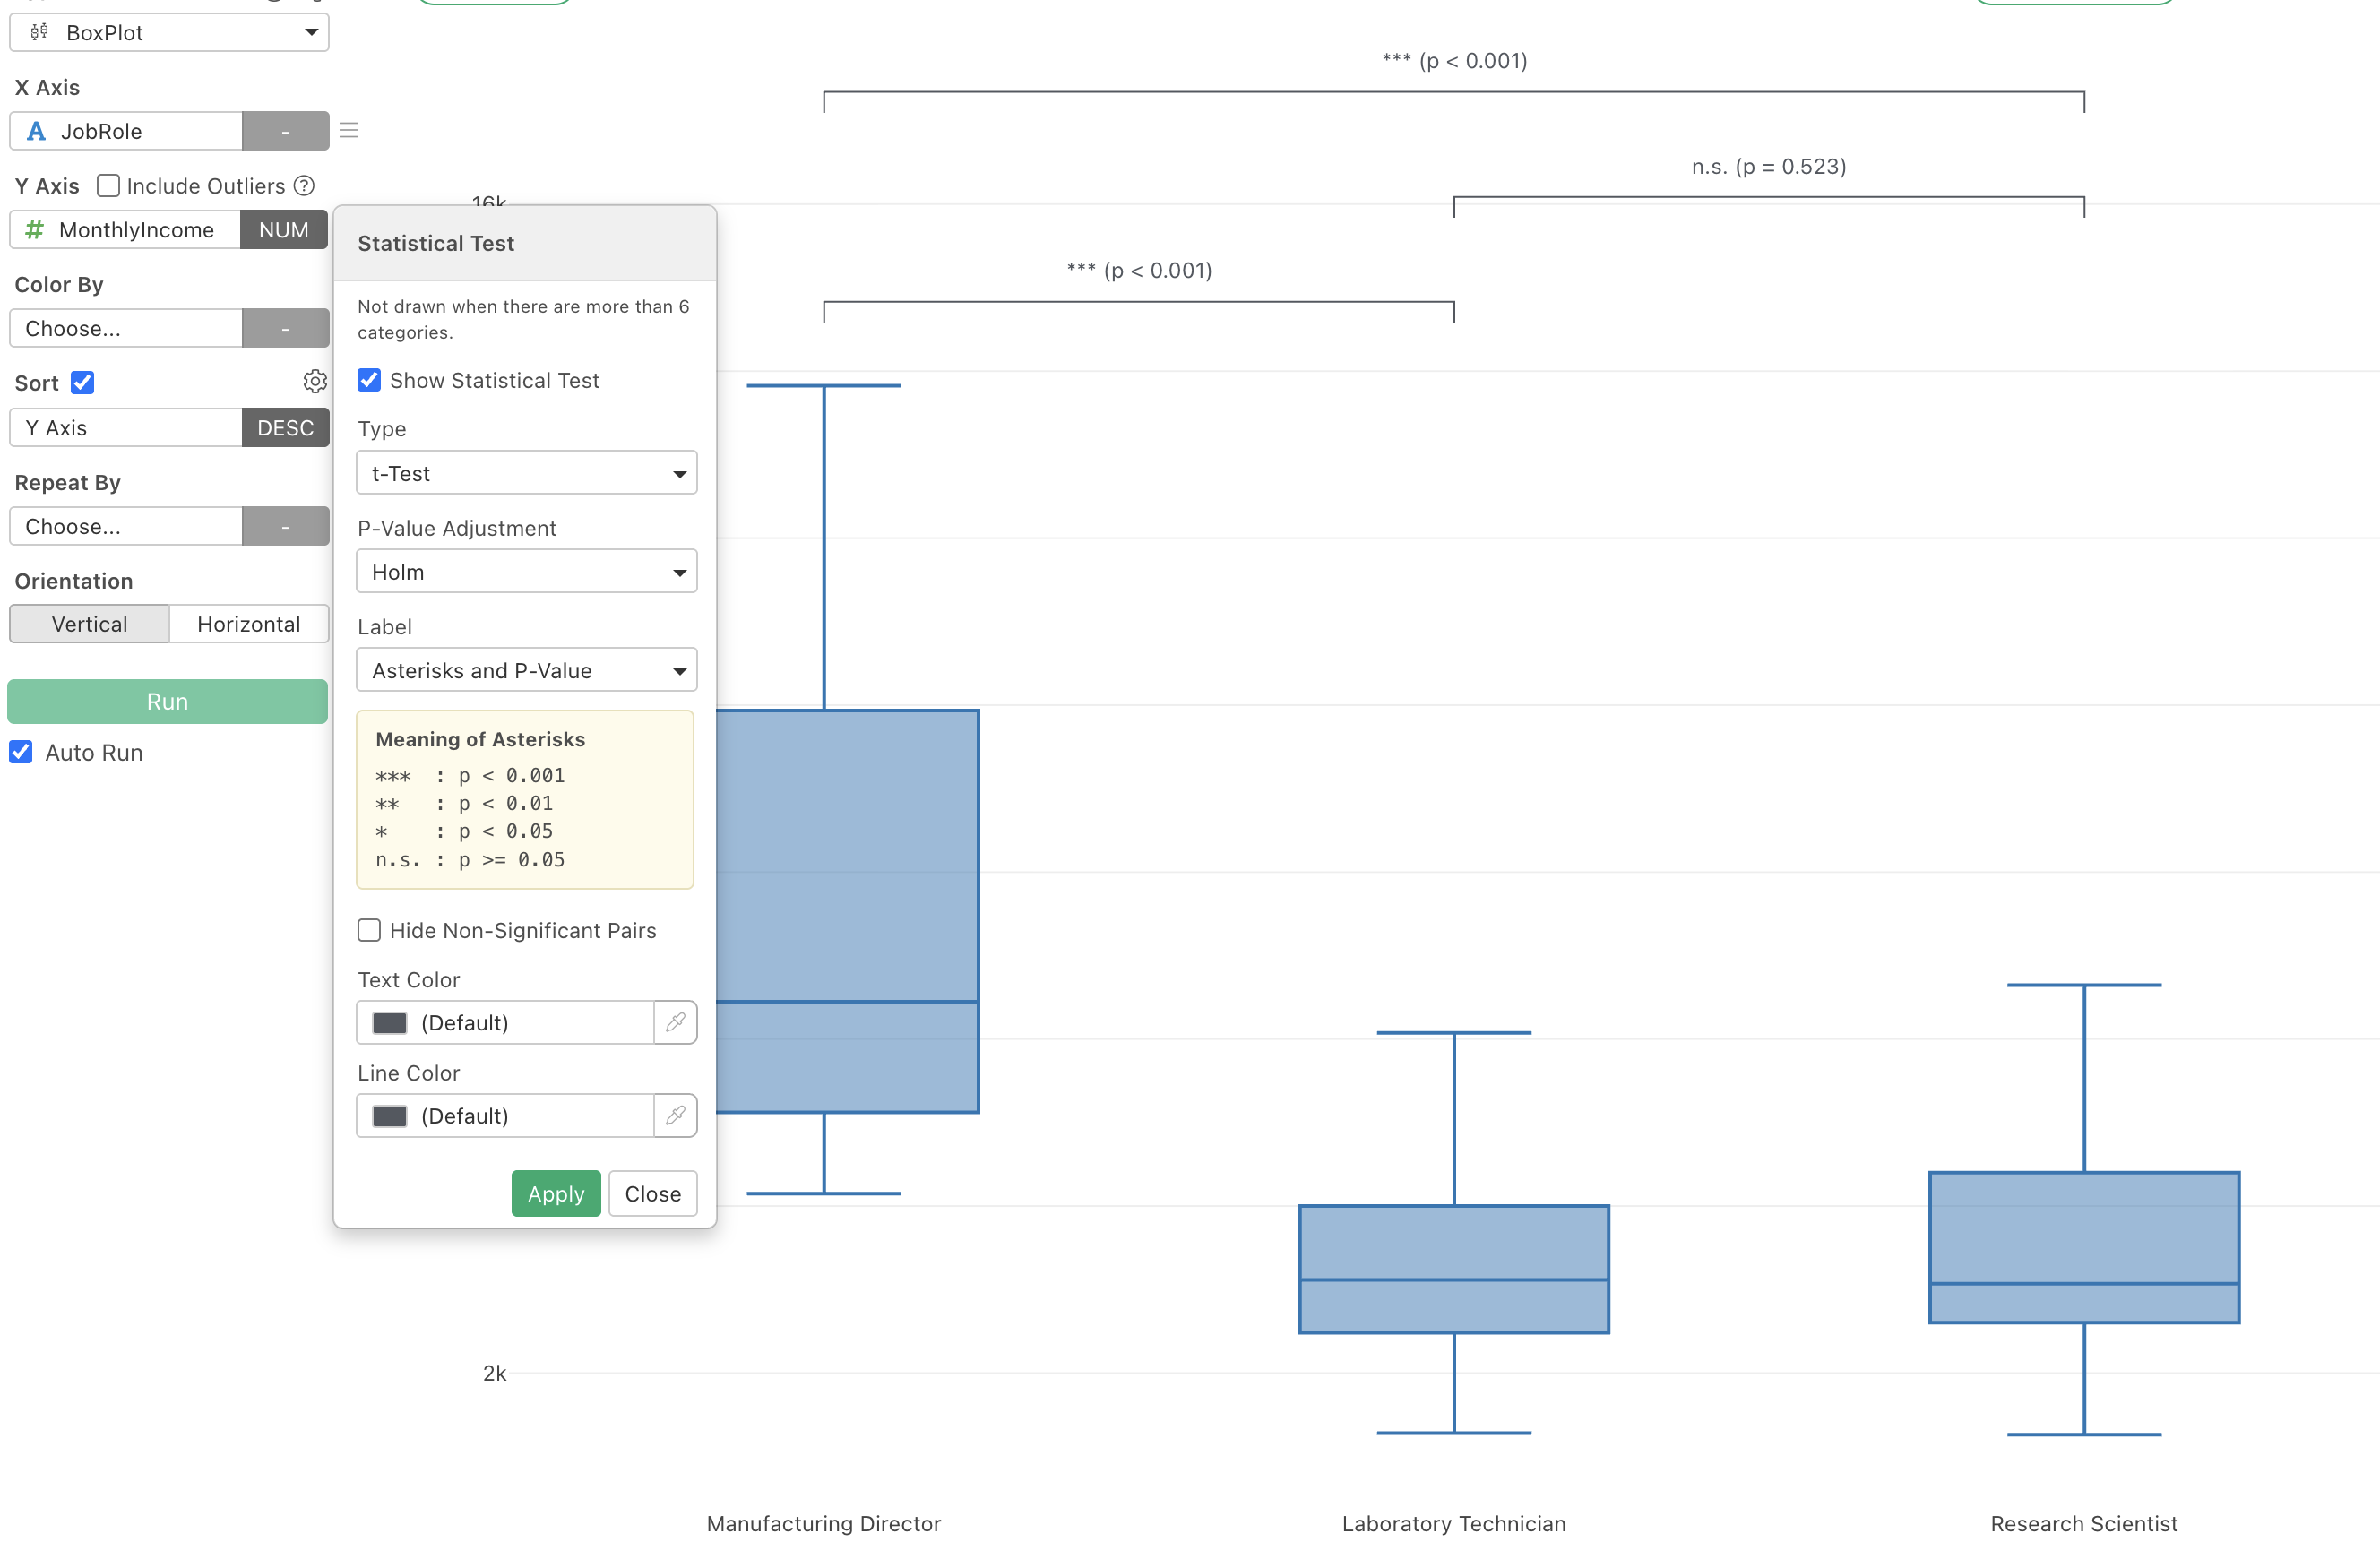
For example, you can show p-values from t-tests or Wilcoxon tests alongside the distributions you’re comparing.
This lets you examine both the distributions and statistical evidence in a single visualization, making your analysis easier to interpret and share.
Customize Marker Shapes in Scatter Plots
Scatter plots now support assigning a variable to Shape, allowing different categories to use distinct markers such as circles, triangles, and diamonds.
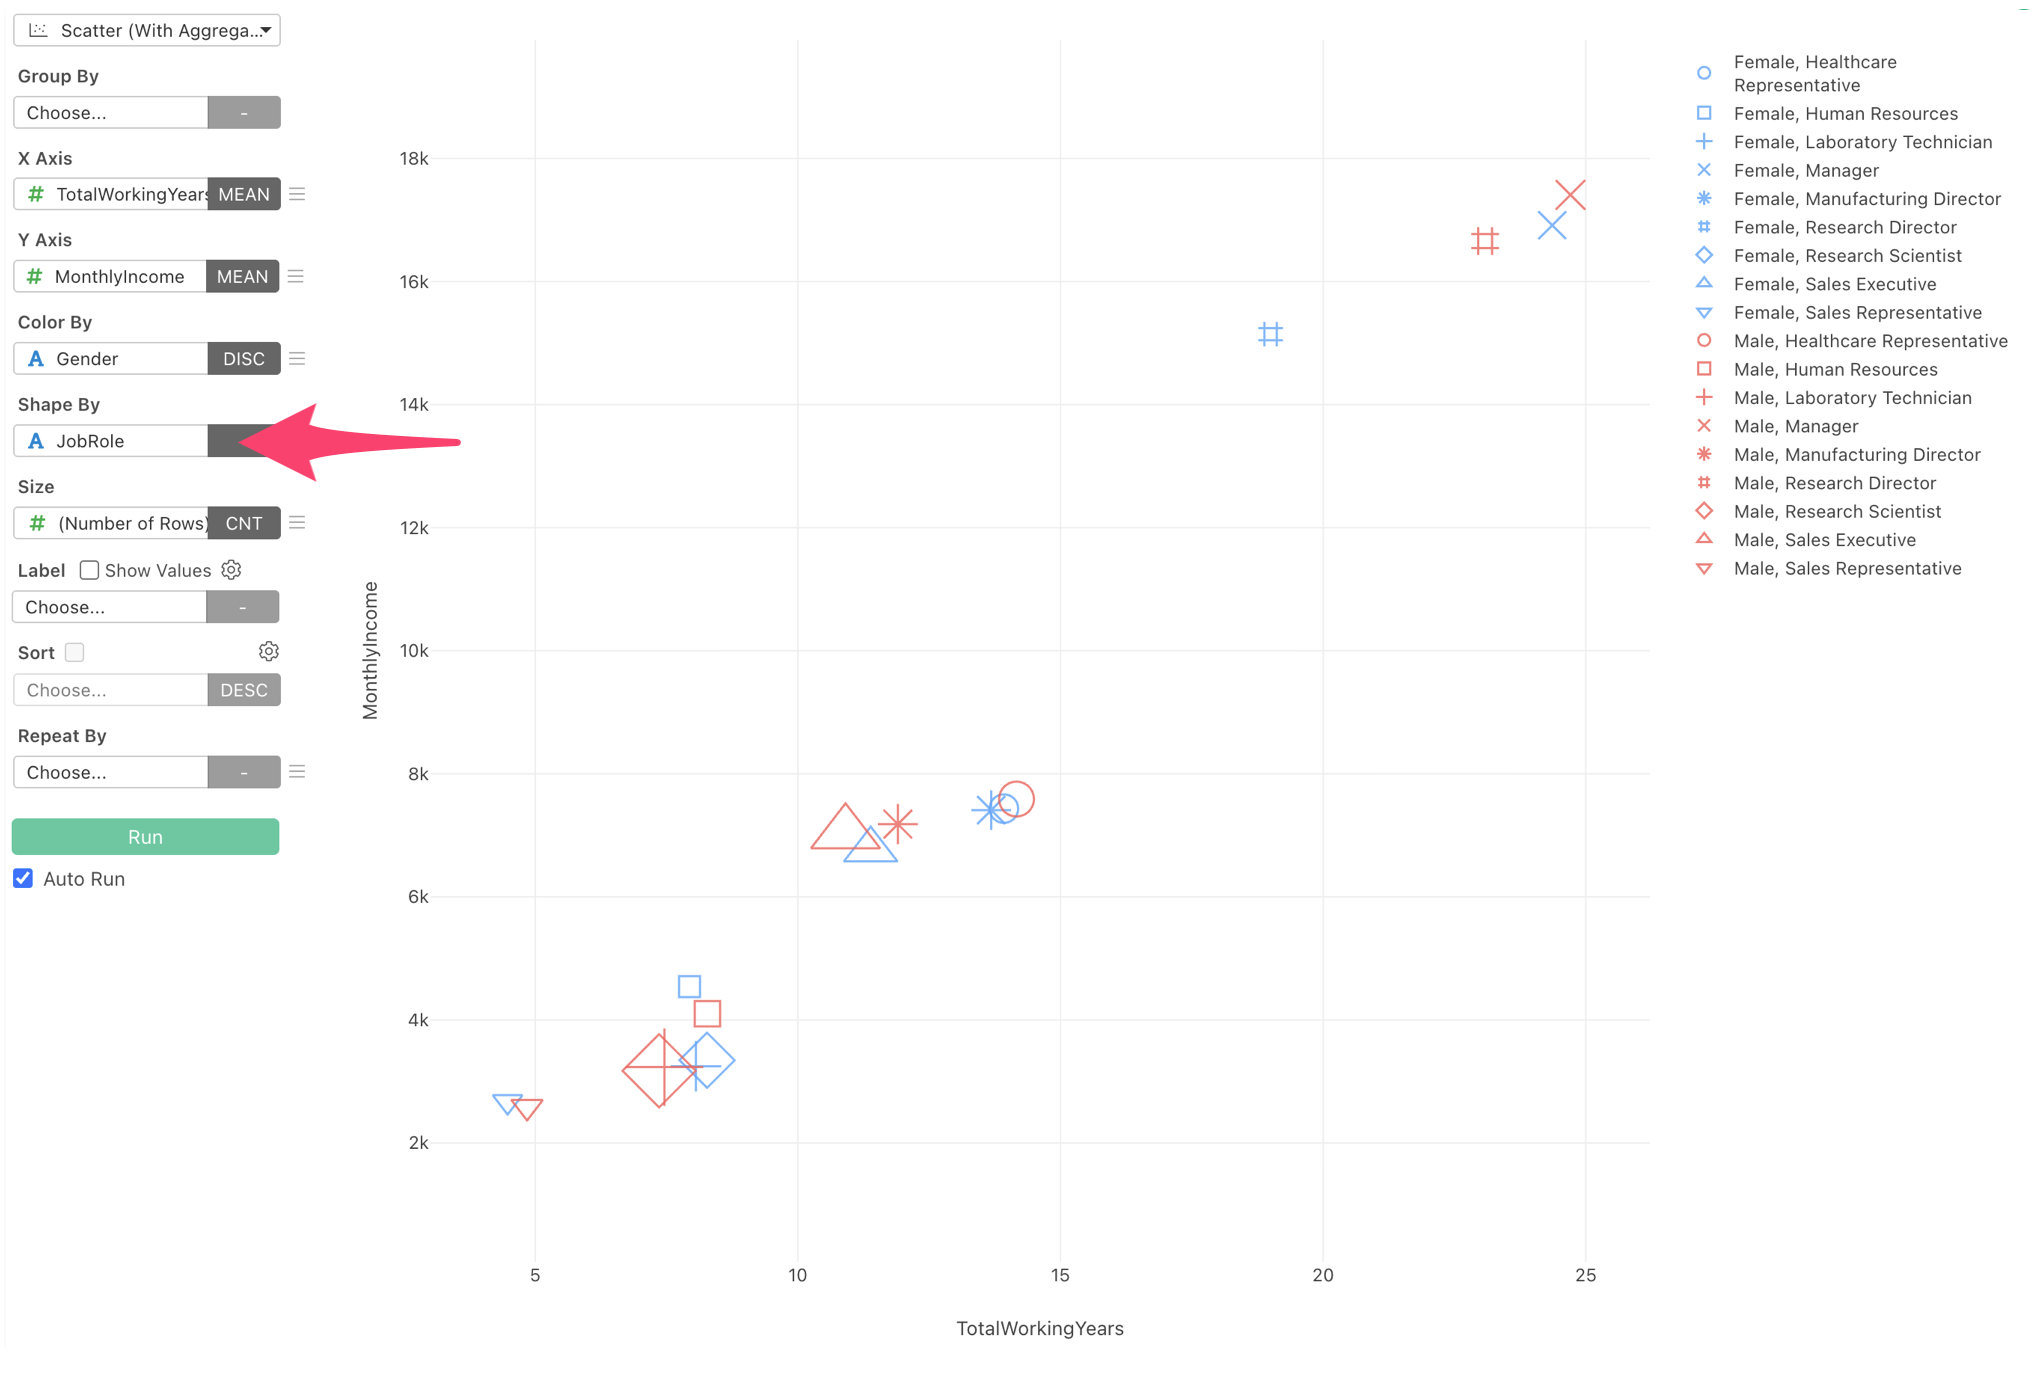
For example, when exploring the relationship between customer spending and purchase frequency, you can distinguish customer segments using different marker shapes.
Combined with existing color and size options, this provides another way to visualize multiple dimensions within a single chart.
Customize Line Chart Markers
Line charts now offer additional options to customize markers and shapes for individual lines.
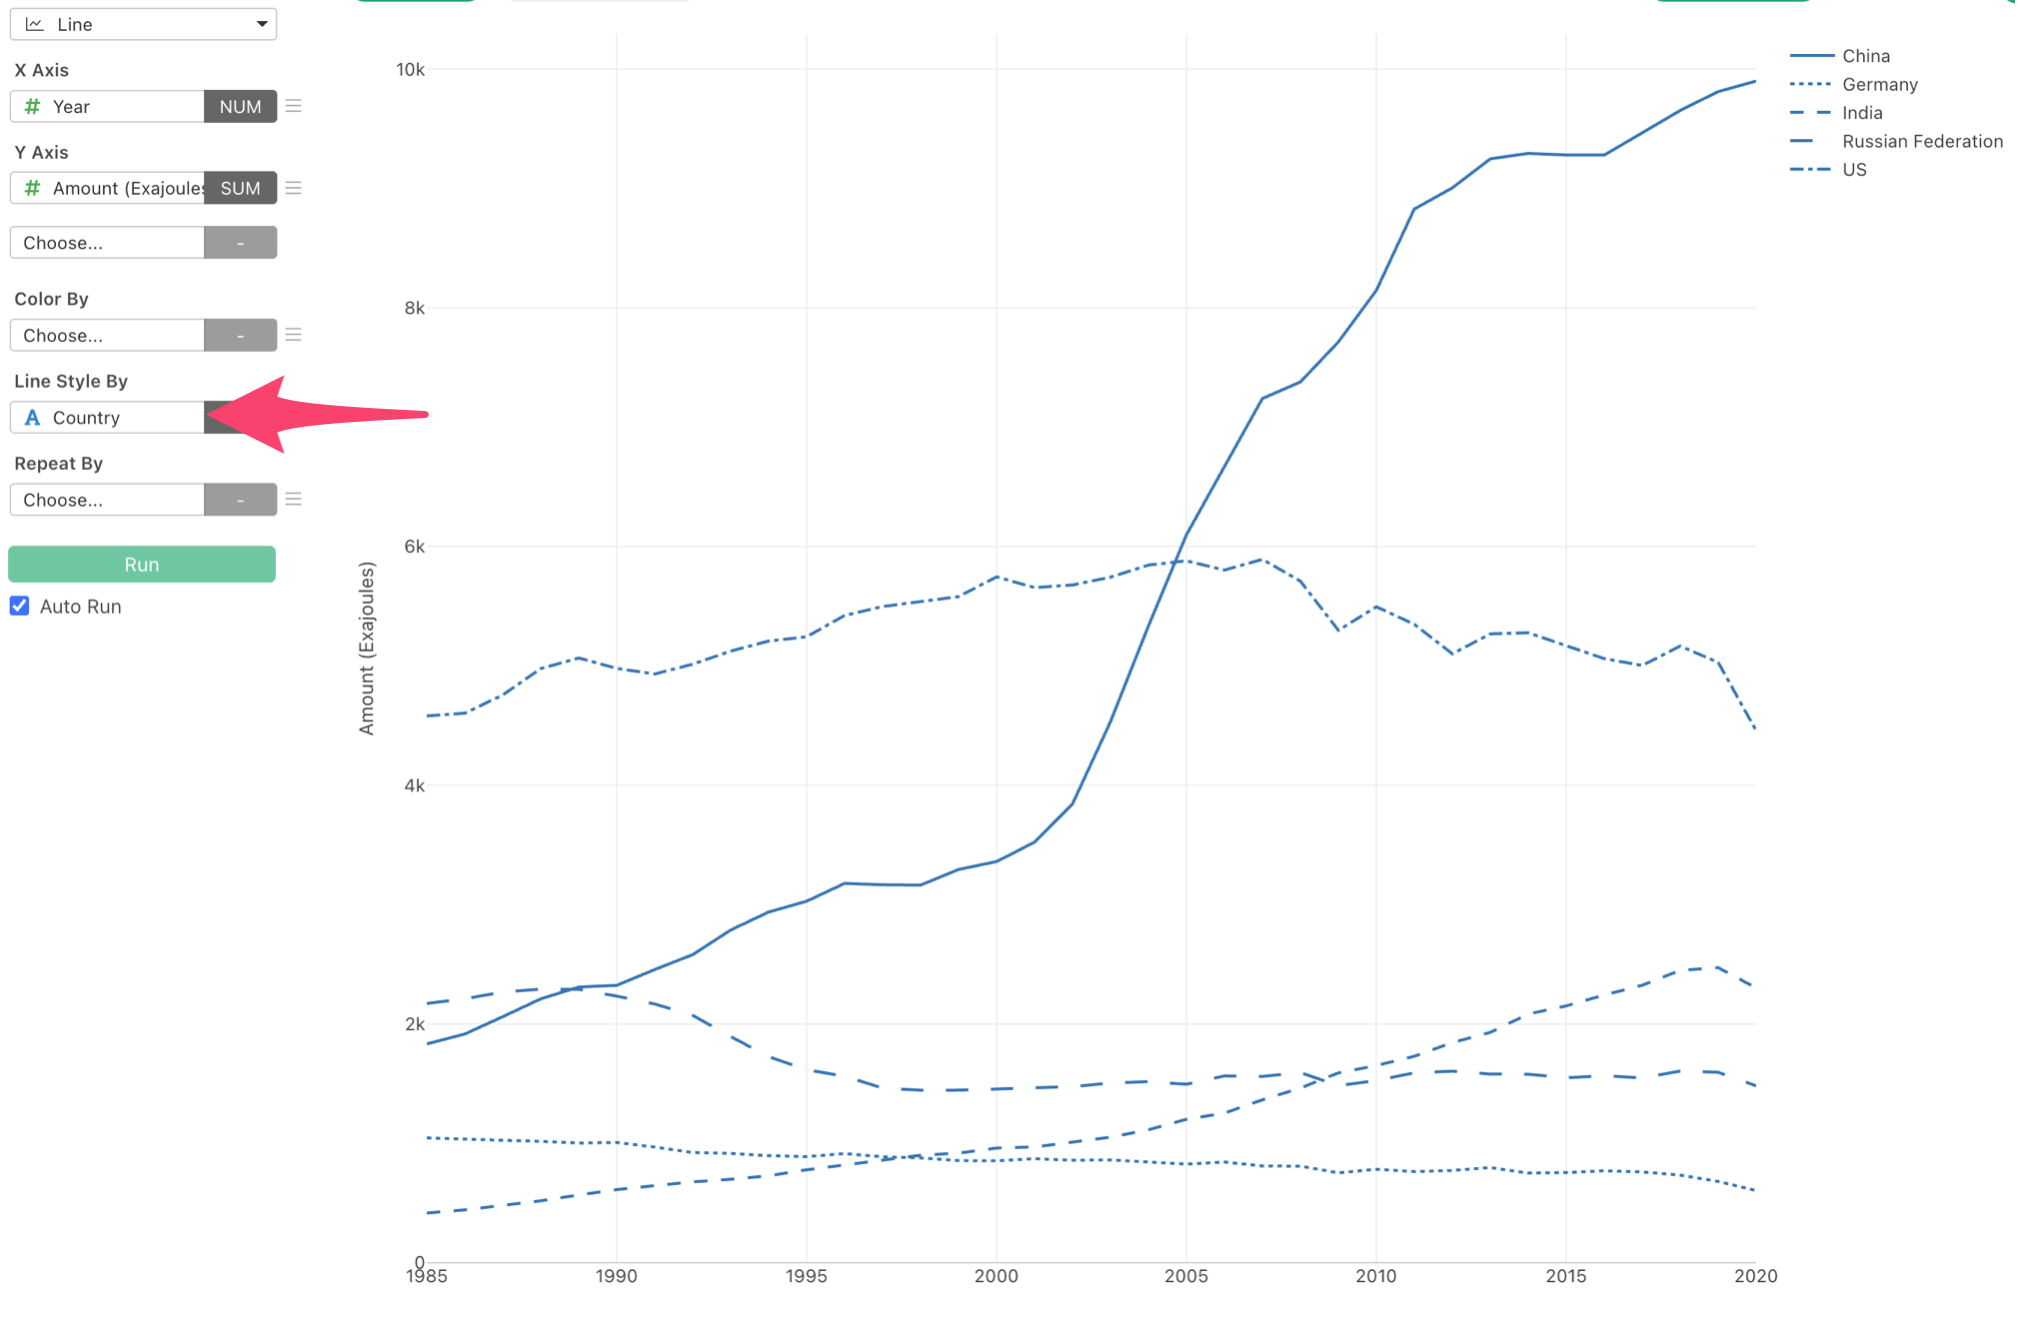
This helps distinguish multiple series more clearly, especially when charts are printed in black and white or when colors alone aren’t sufficient.
Improved Trendline Selection and Tooltips
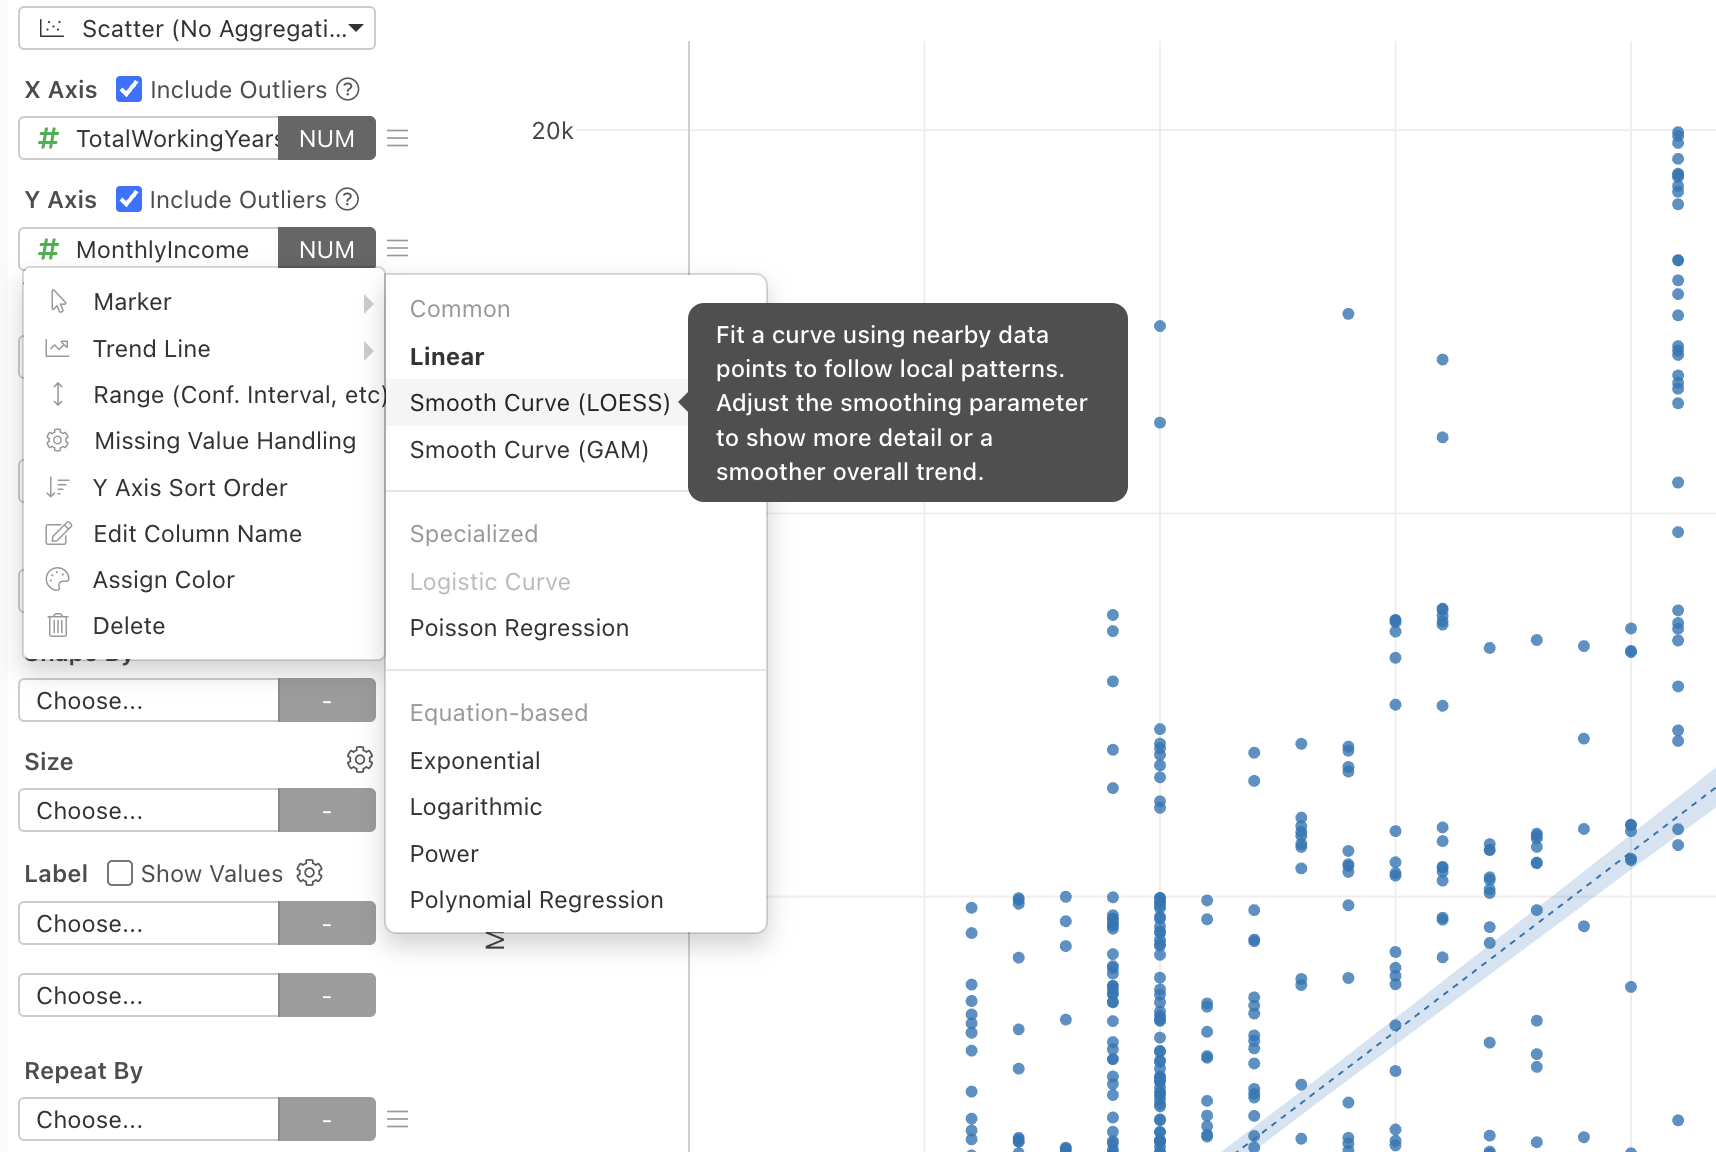
We’ve redesigned the trendline selection menu to make it easier to choose the right model.
Trendline types are now organized into structured categories, with explanatory tooltips to help you understand their purposes.
We’ve also improved the trendline hover tooltip.
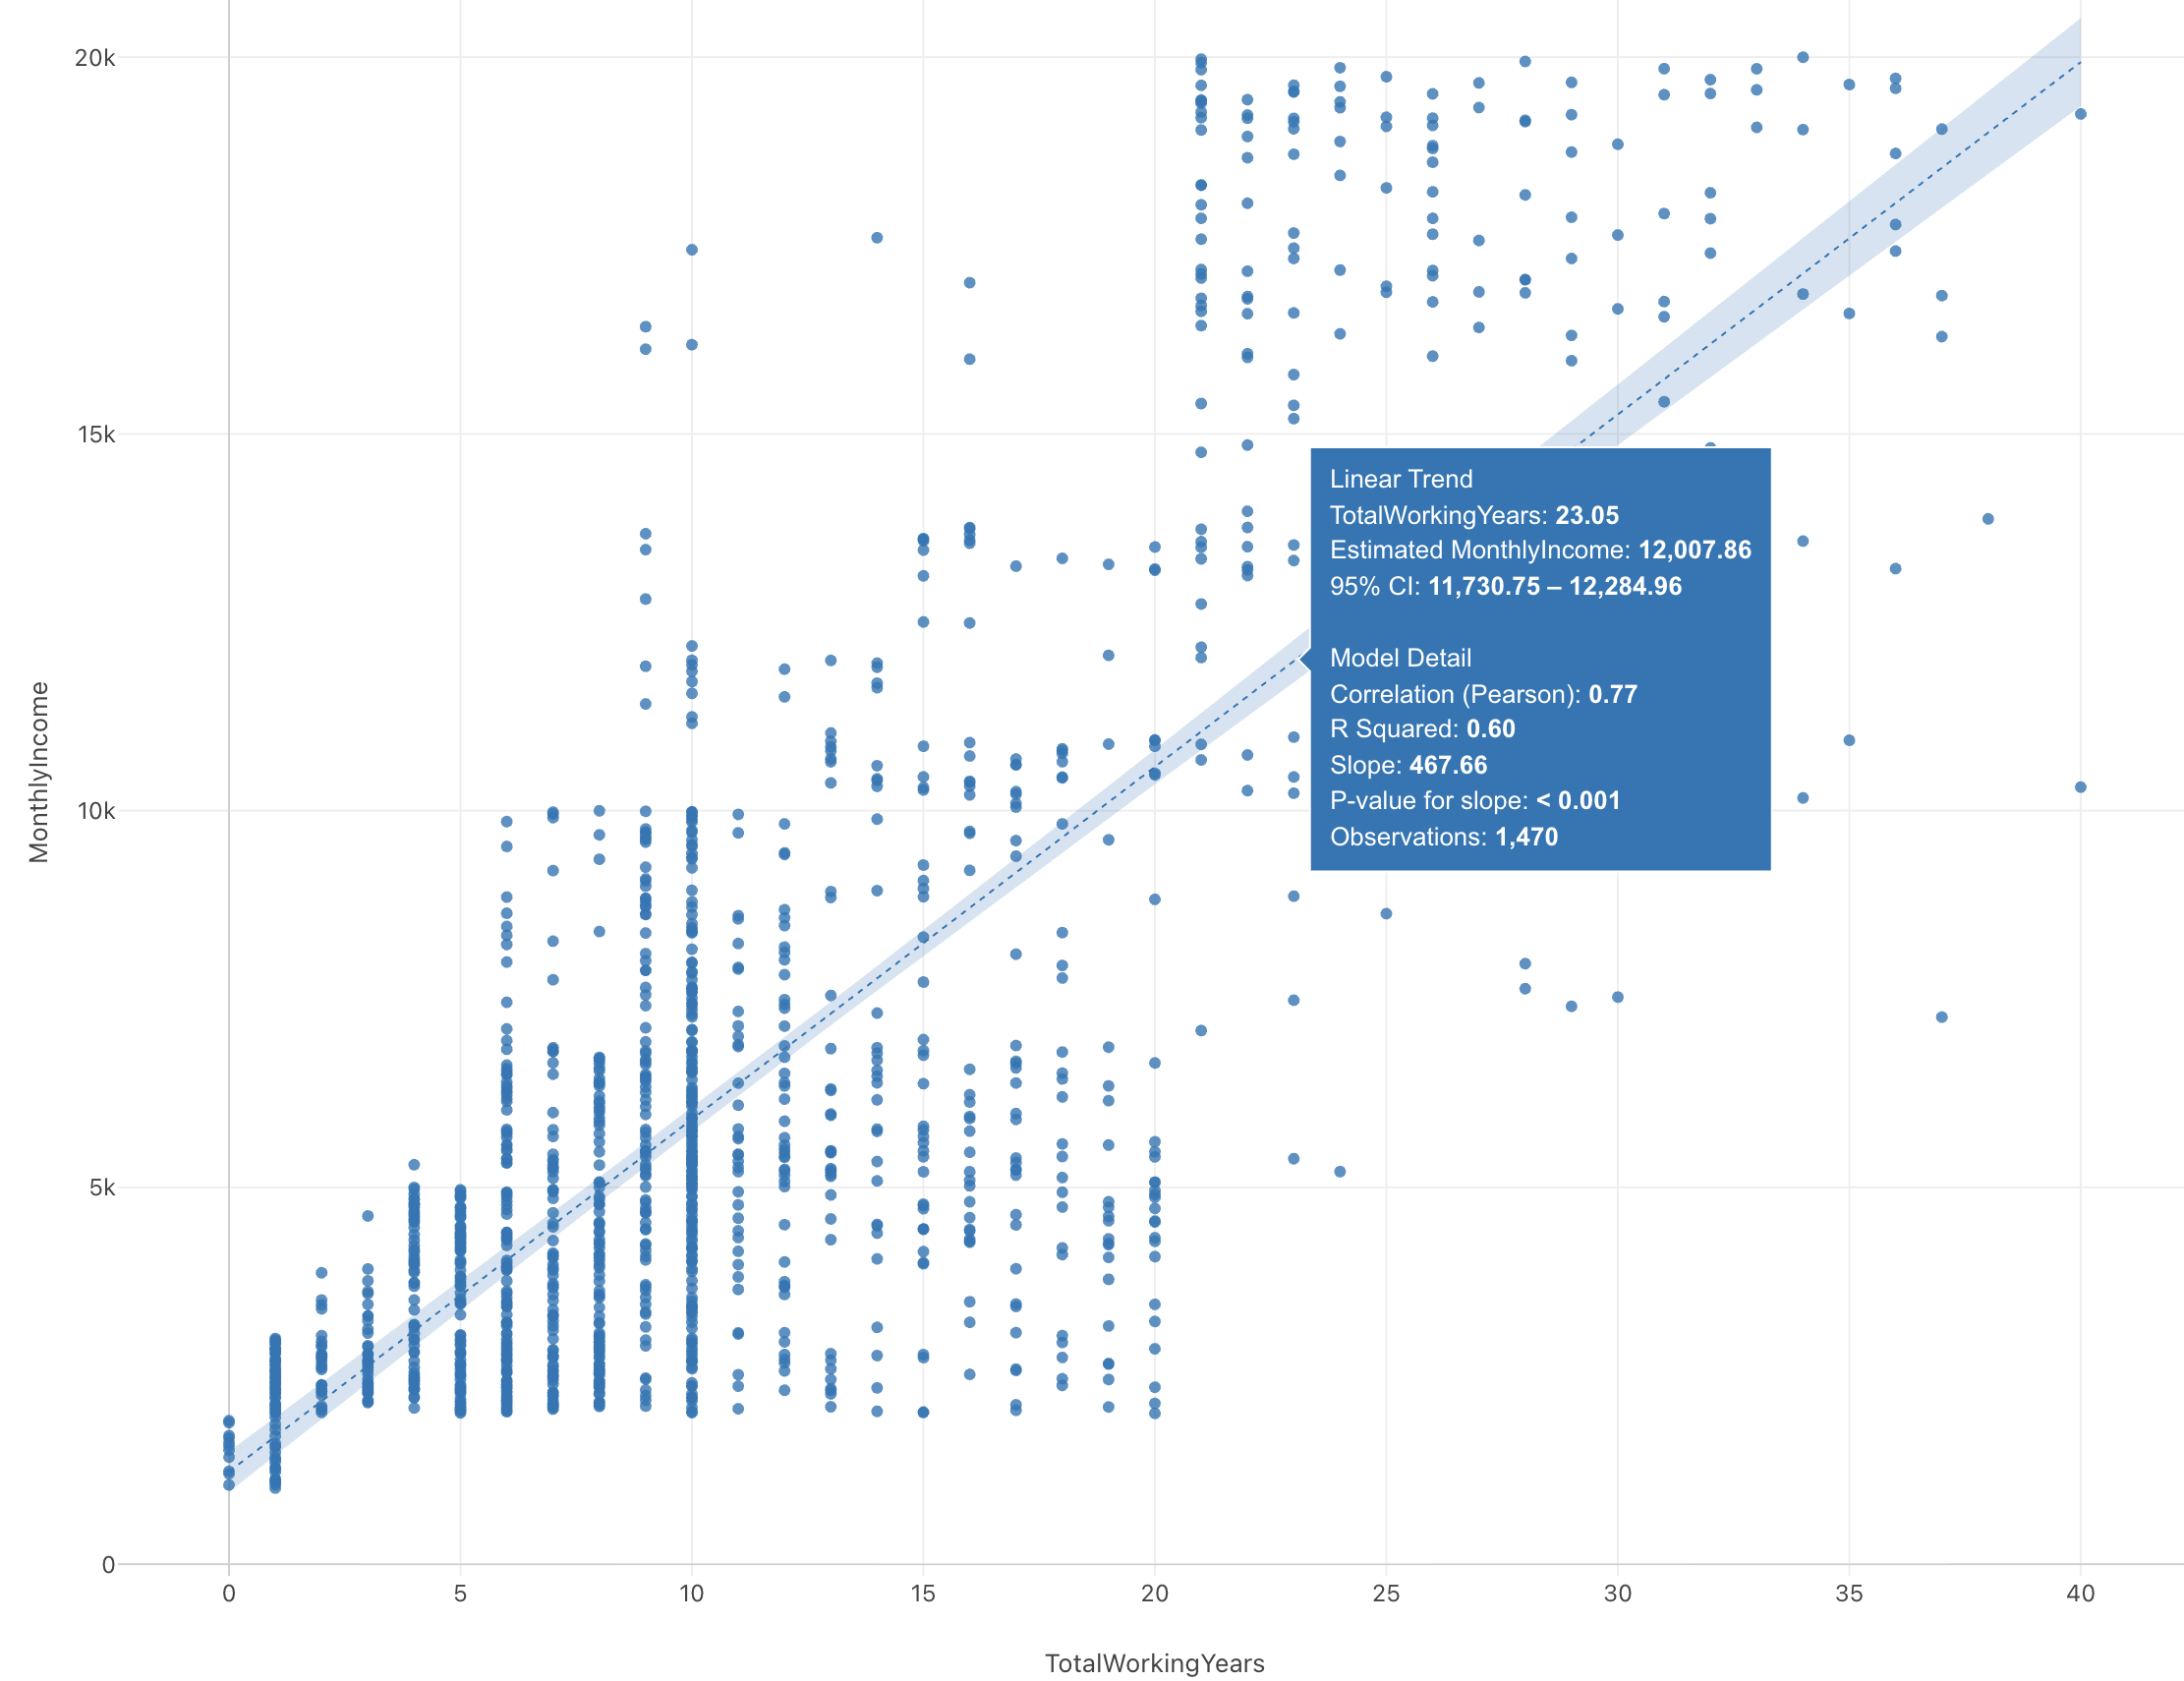
Information associated with the cursor position, such as predicted values and confidence intervals, is now clearly separated from model-level statistics such as R², coefficients, p-values, and observation counts, where applicable.
This makes it easier to understand both the model’s predictions and its overall statistical characteristics.
4. Dashboards: More Flexible Editing, Design, and Sharing
We’ve made significant improvements to Exploratory’s dashboards, giving you more control over how dashboards look, how they’re organized, and what you share.
Edit Dashboards Directly in Preview Mode
You can now edit dashboards directly in Preview mode.
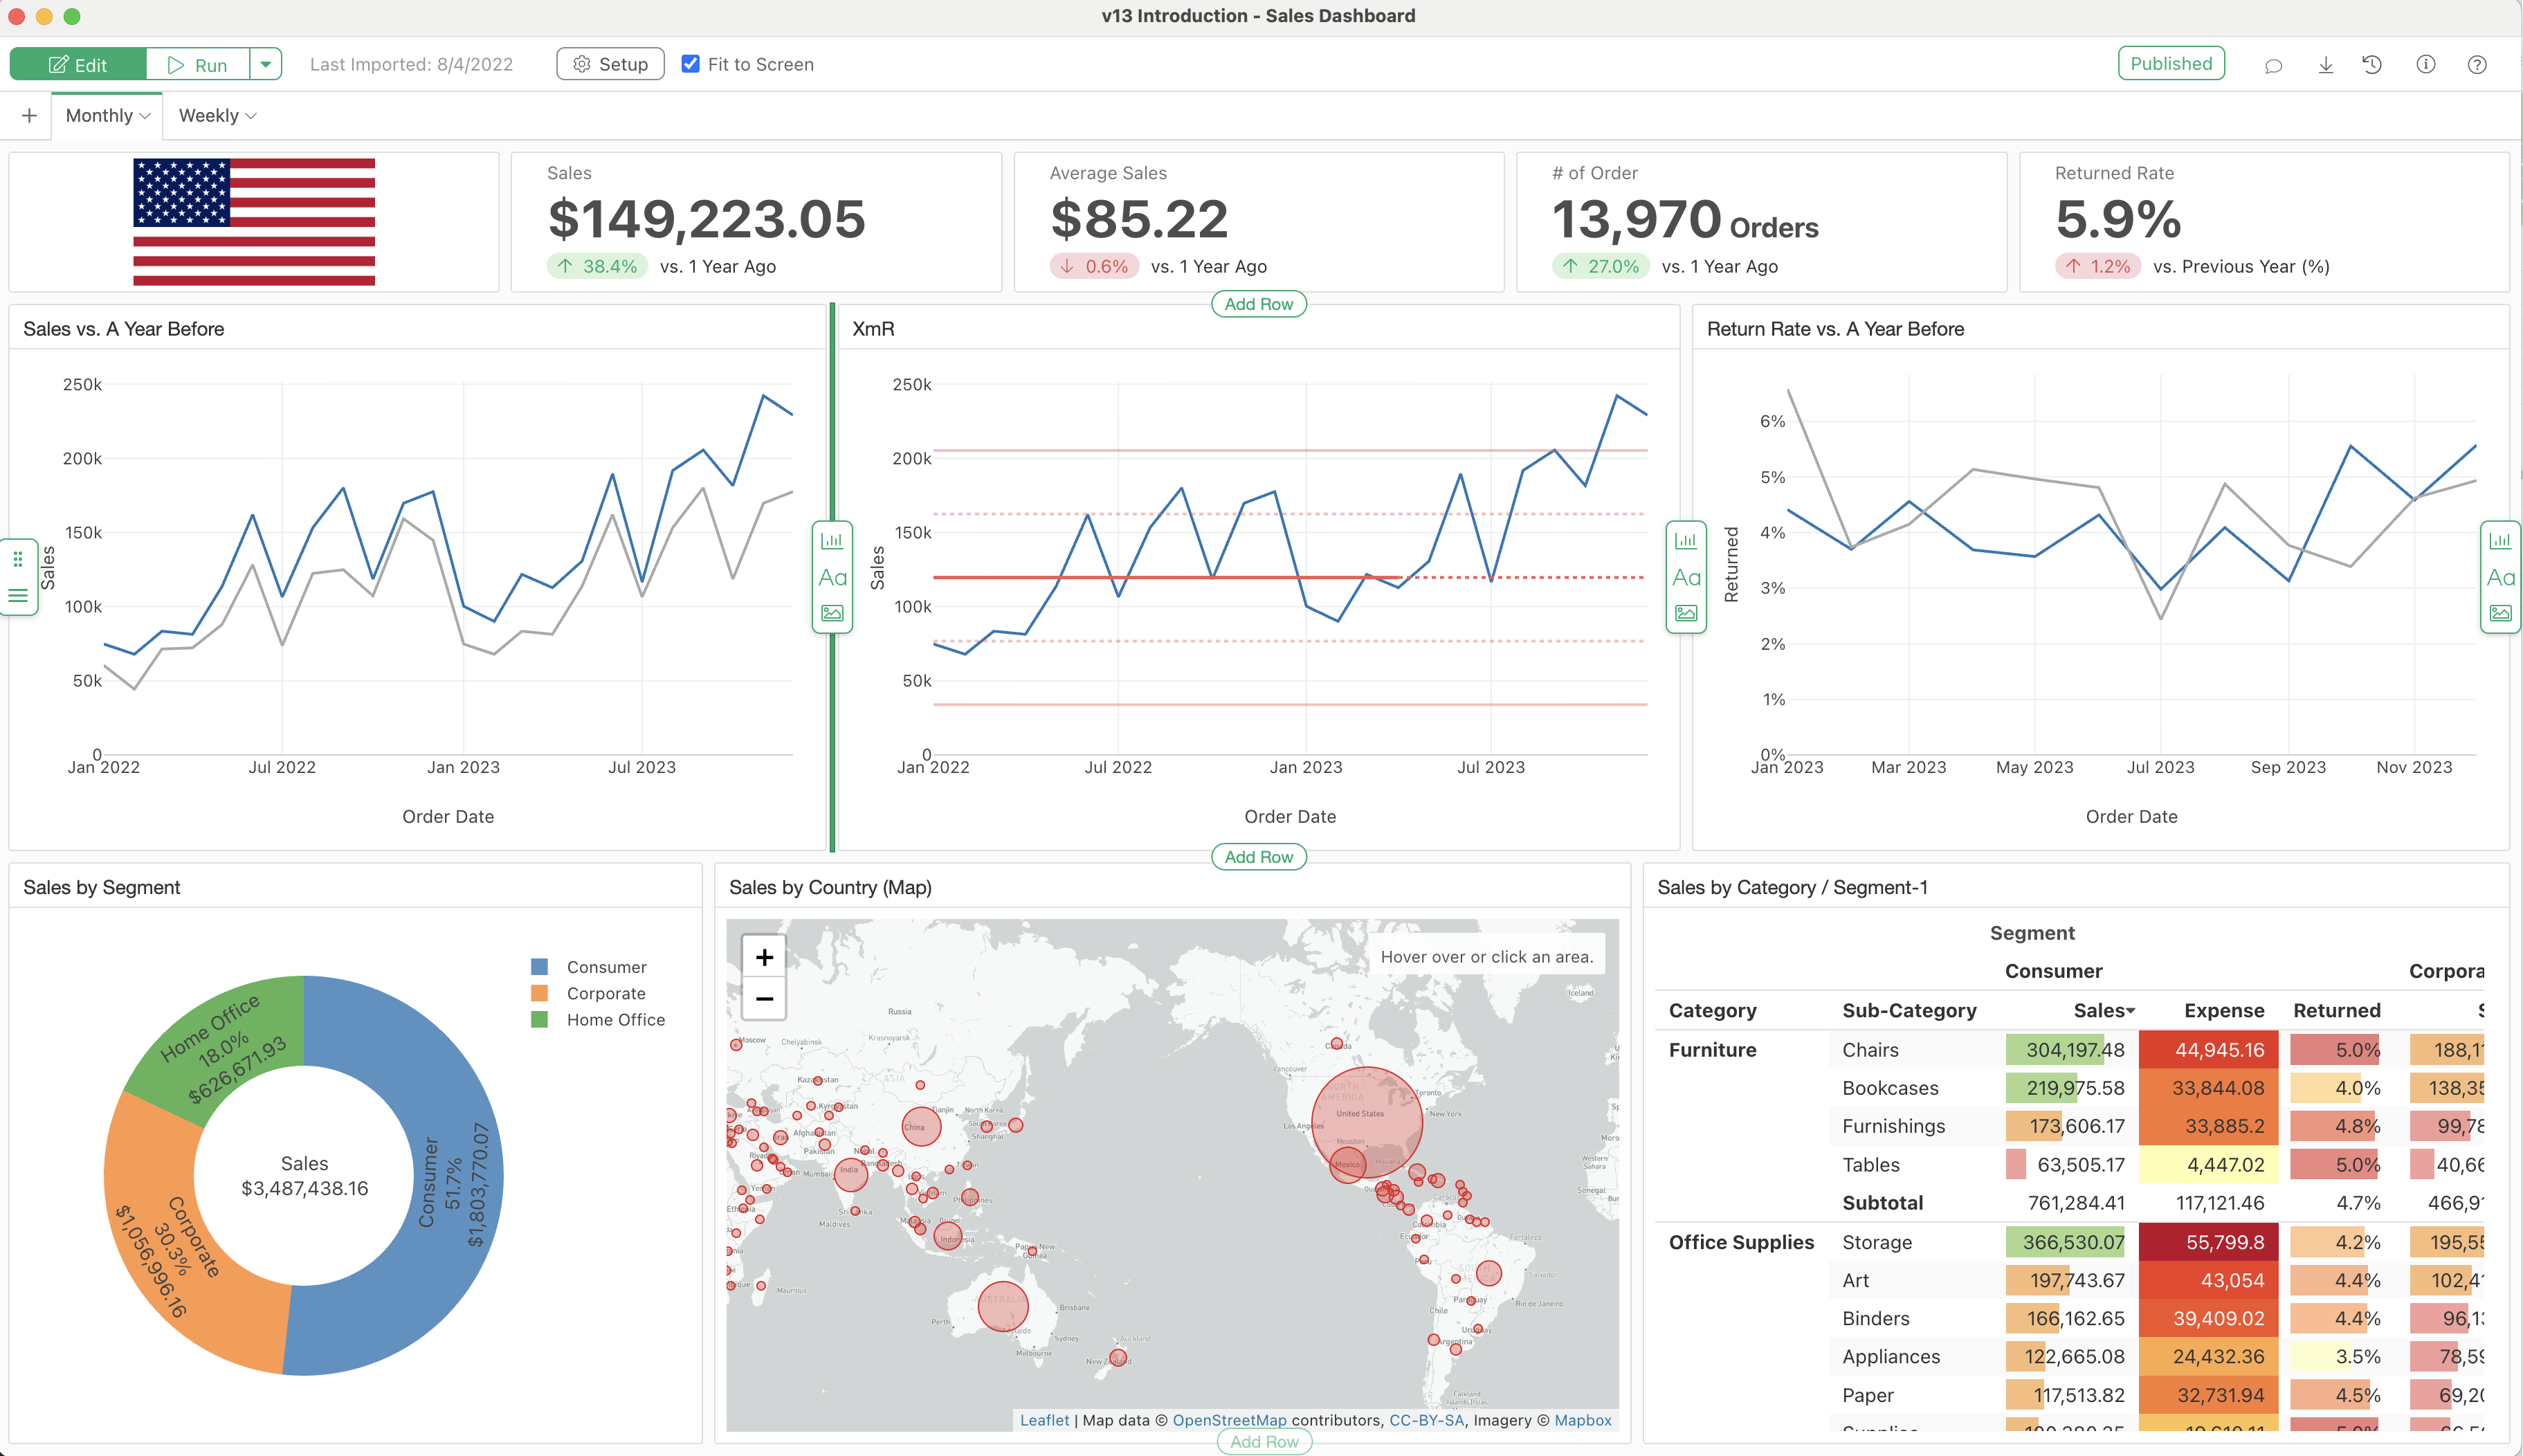
Instead of repeatedly switching between editing and previewing, you can make adjustments while seeing how your dashboard will appear.
This streamlines the process of refining layouts, arranging charts, and making design changes.
Add Images to Dashboards
Dashboards now support image components, allowing you to include company logos, product images, illustrations, and other visual elements.
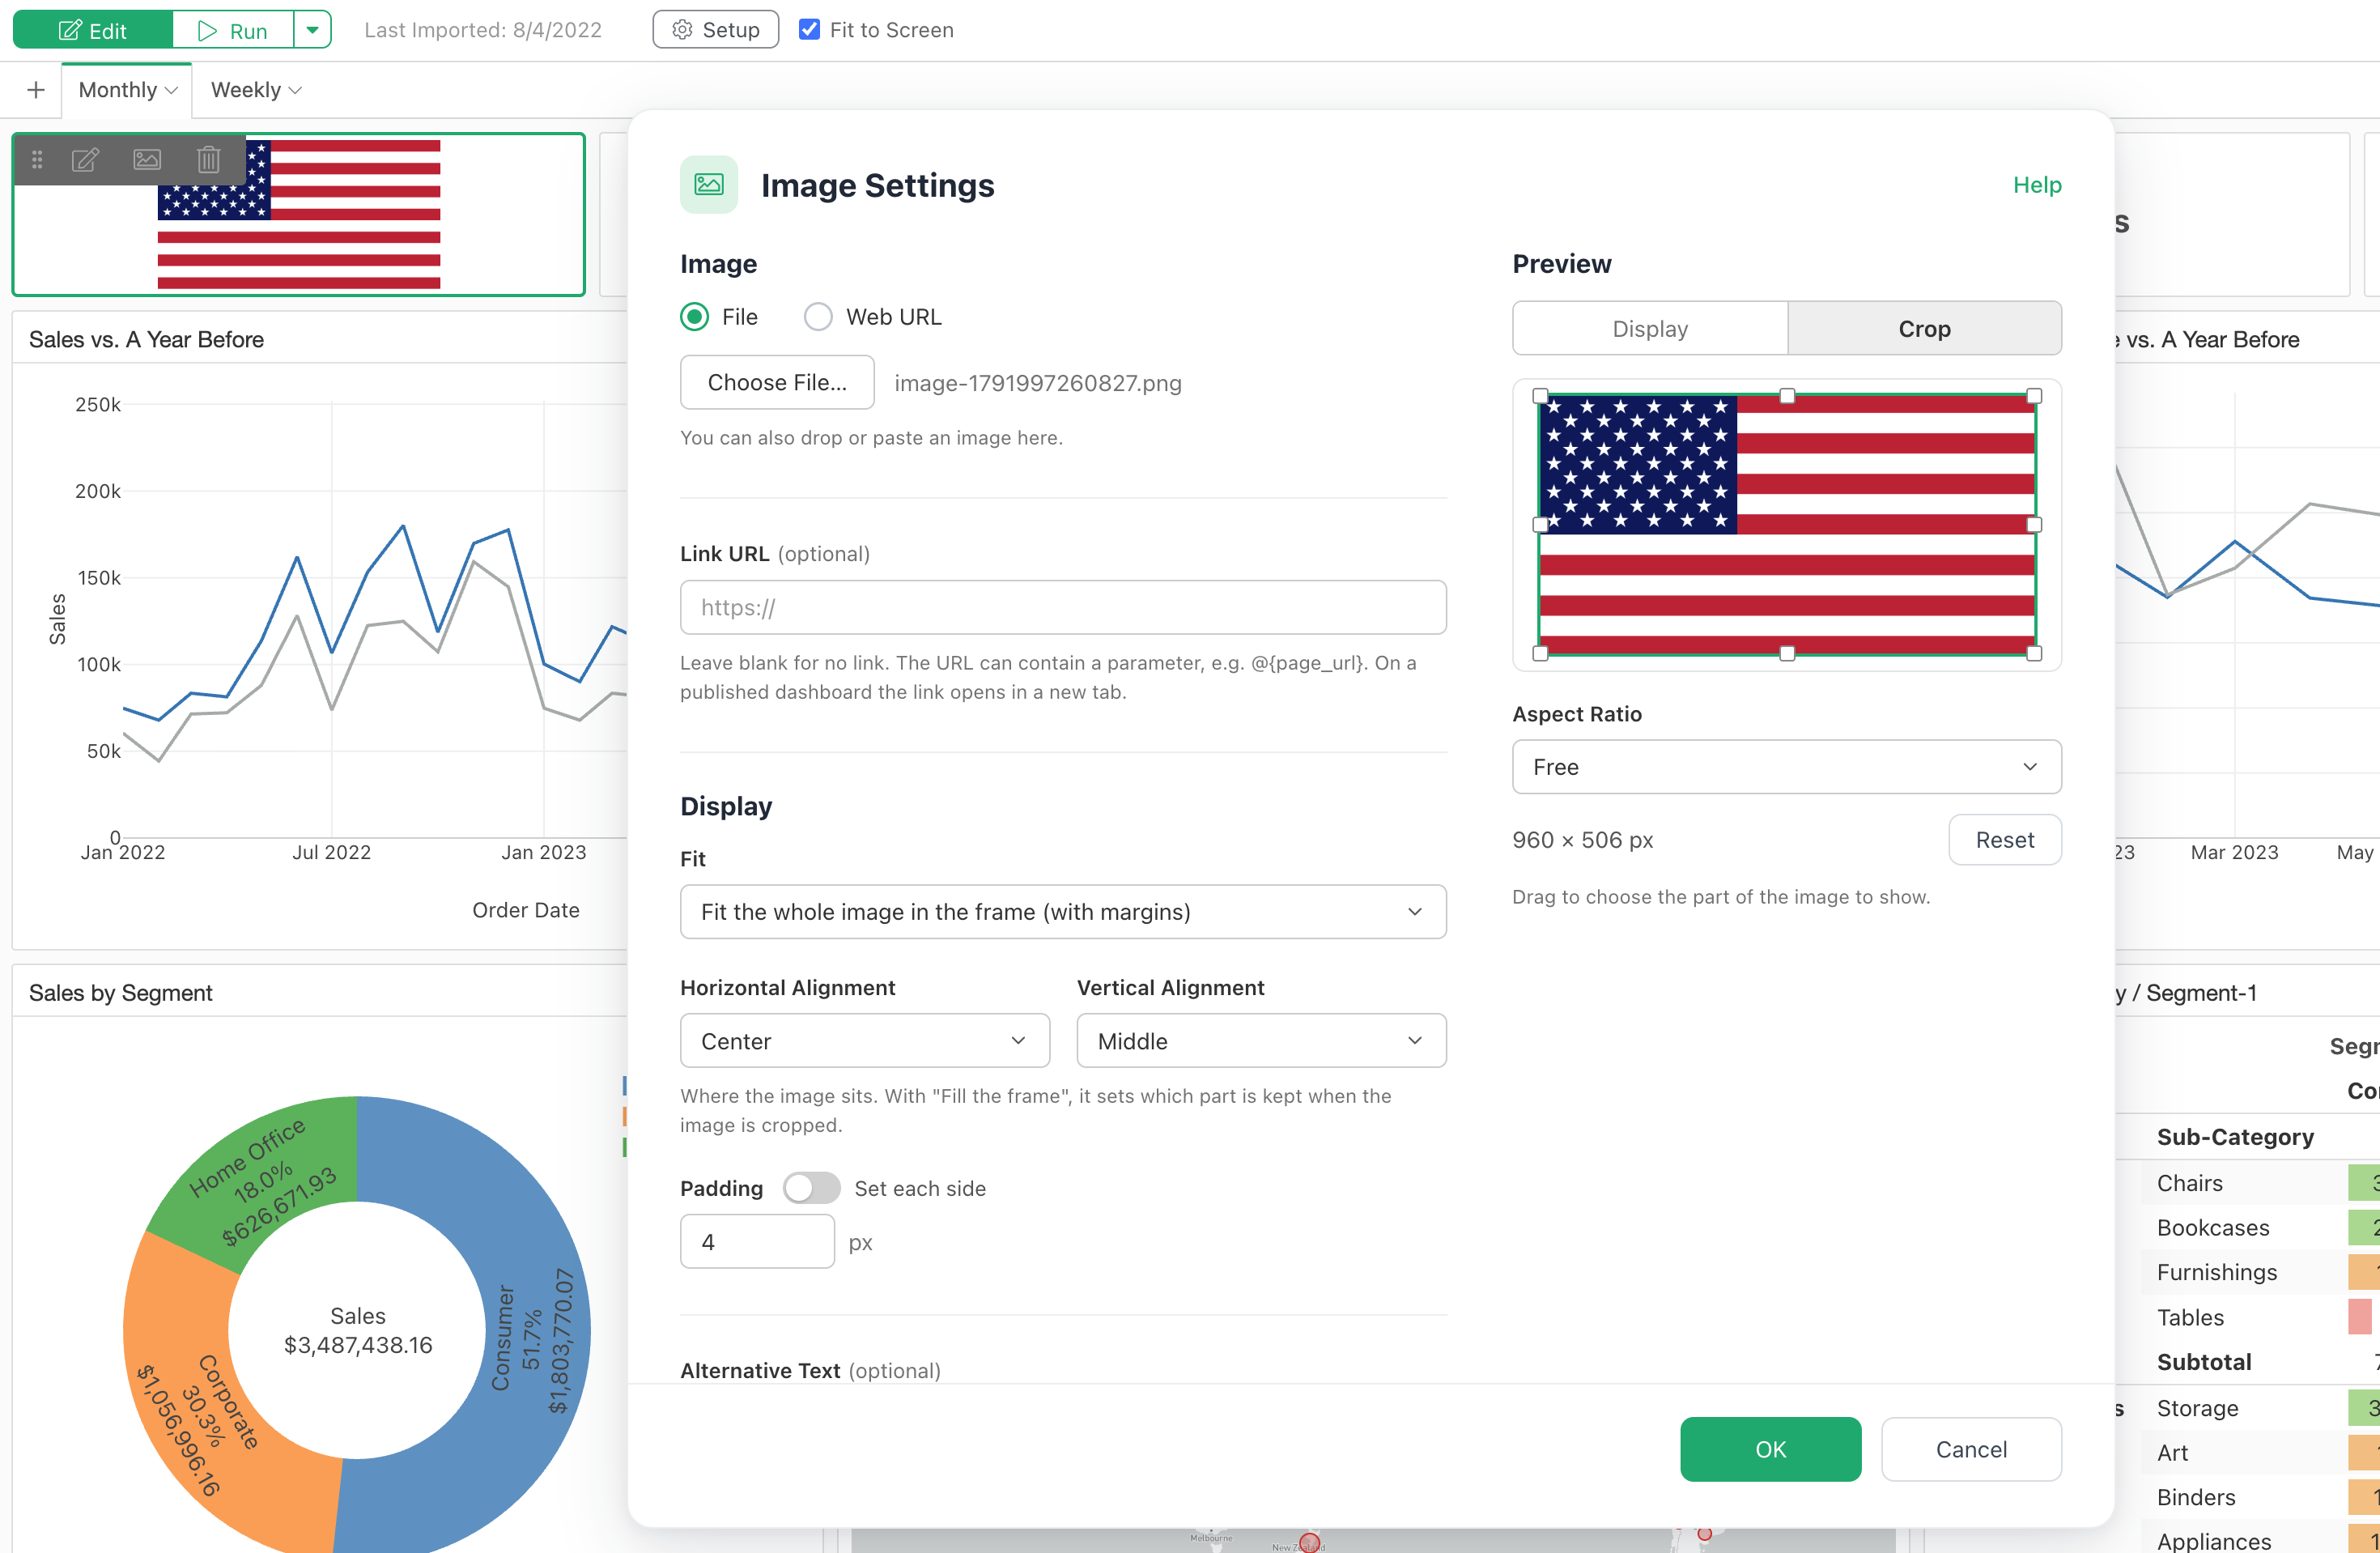
You can also use parameters within image URLs to dynamically change displayed images based on user selections.
For example, selecting a product from a dashboard parameter can automatically update the product image.
More Flexible Dashboard Navigation
Dashboard page tabs can now be positioned on the left or right side, in addition to the top.
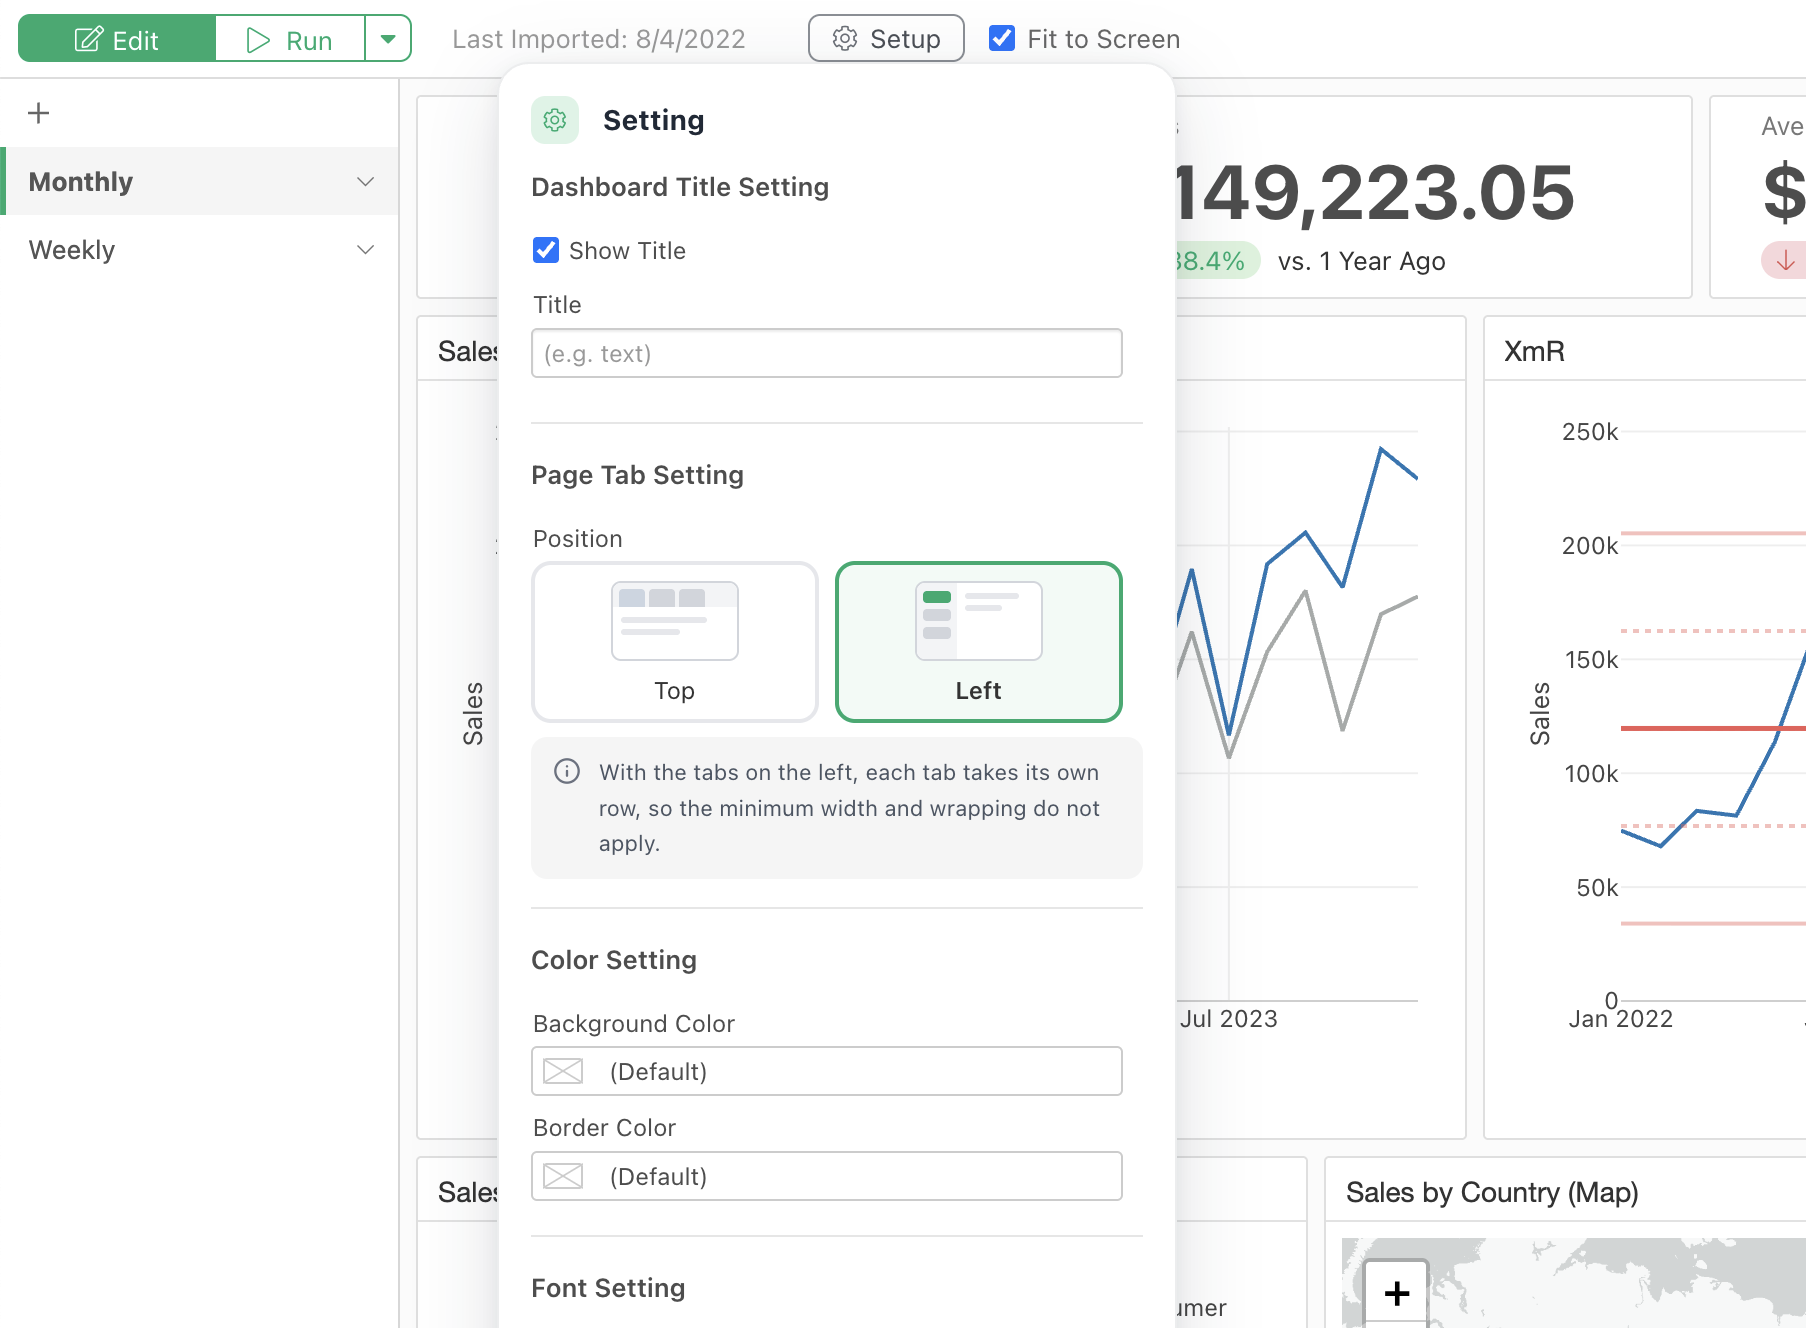
Vertical navigation is particularly useful for dashboards with many pages or long page titles.
We’ve also added support for displaying tabs across multiple rows, helping keep larger dashboards organized and easy to navigate.
Expanded Font Customization
You can now customize font families throughout your dashboards, with improved controls for titles and other text elements.
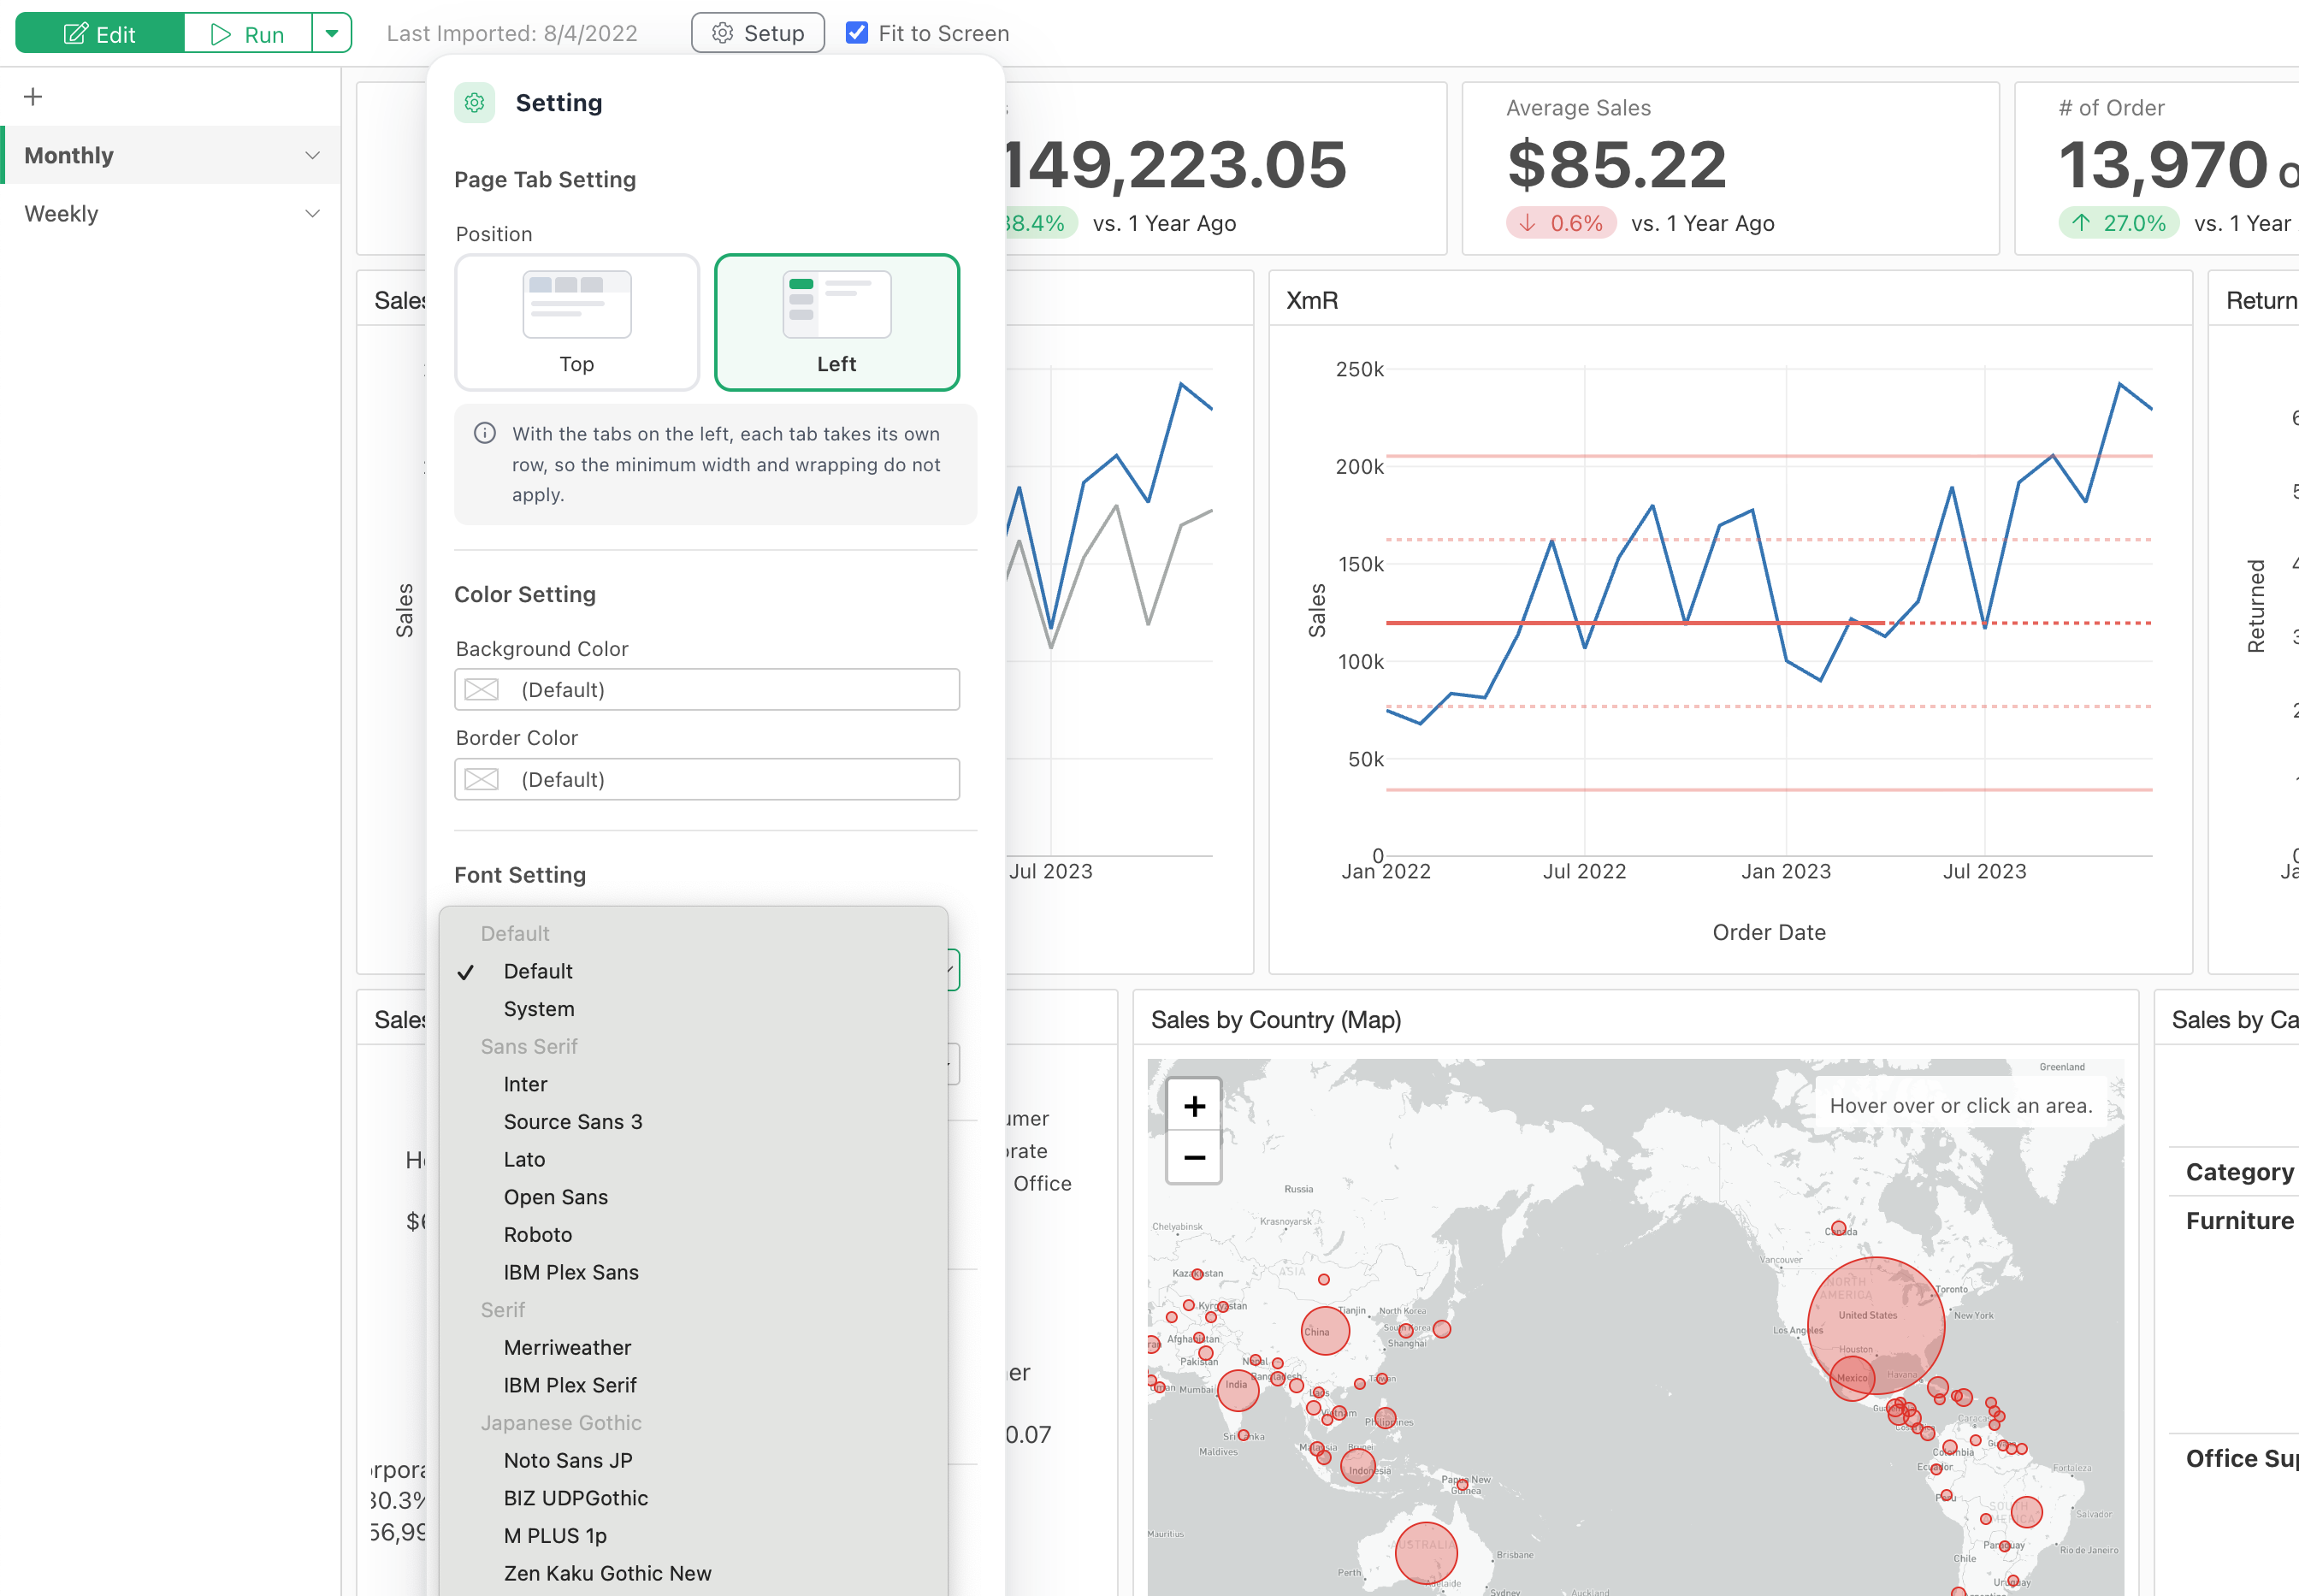
These enhancements help maintain consistent typography between Exploratory Desktop and published dashboards.
Choose Which Pages to Publish
When publishing a dashboard, you can now choose to hide specific pages or tabs.
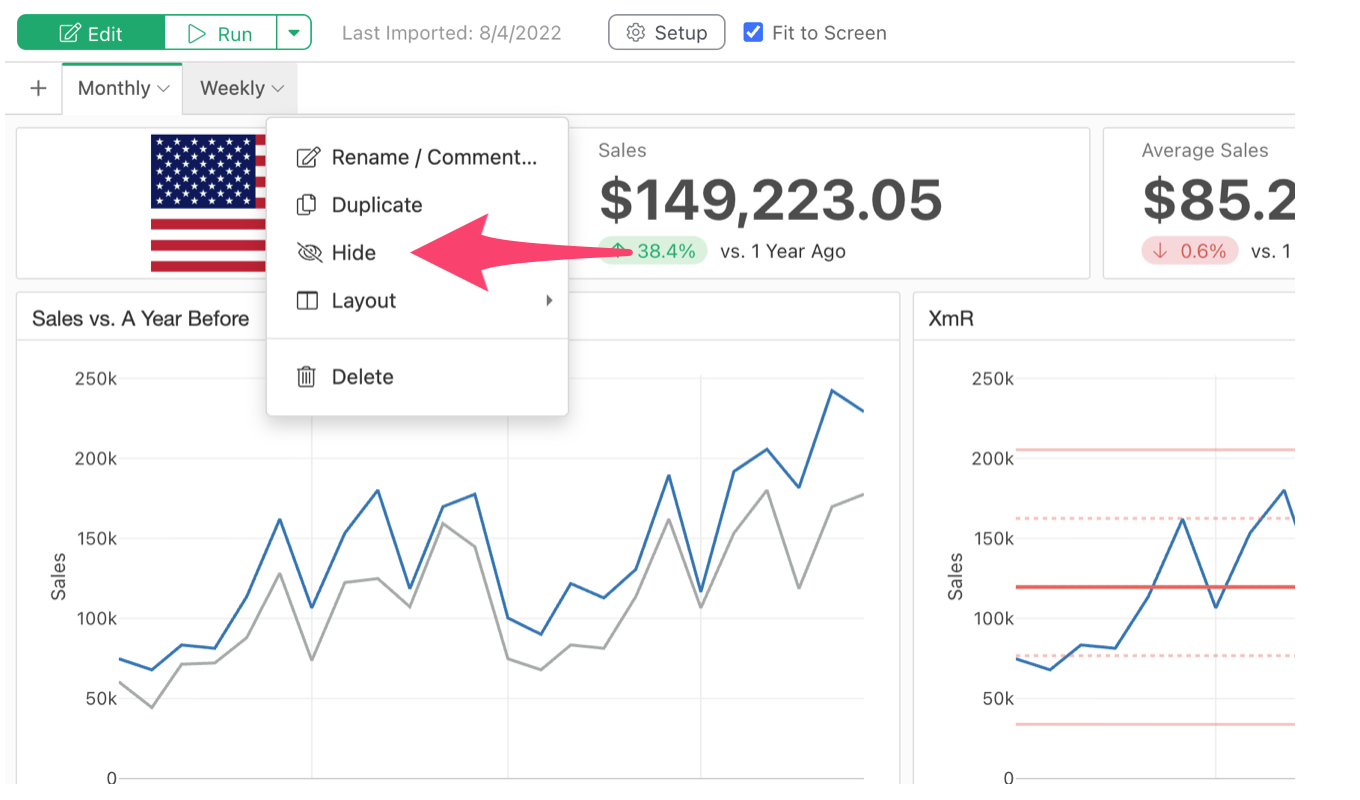
For example, you can keep work-in-progress or internal analysis pages out of the published navigation while sharing completed pages with your audience.
5. Search: Find Projects, Charts, and Analysis Steps Faster
As your Exploratory workspace grows, finding a specific project, chart, or data wrangling step can become increasingly challenging.
In v16.4, we’ve completely revamped the desktop search experience to help you locate what you need faster.
Search Across Projects
A new search dialog on the project list page lets you find projects using keywords and structured filters.
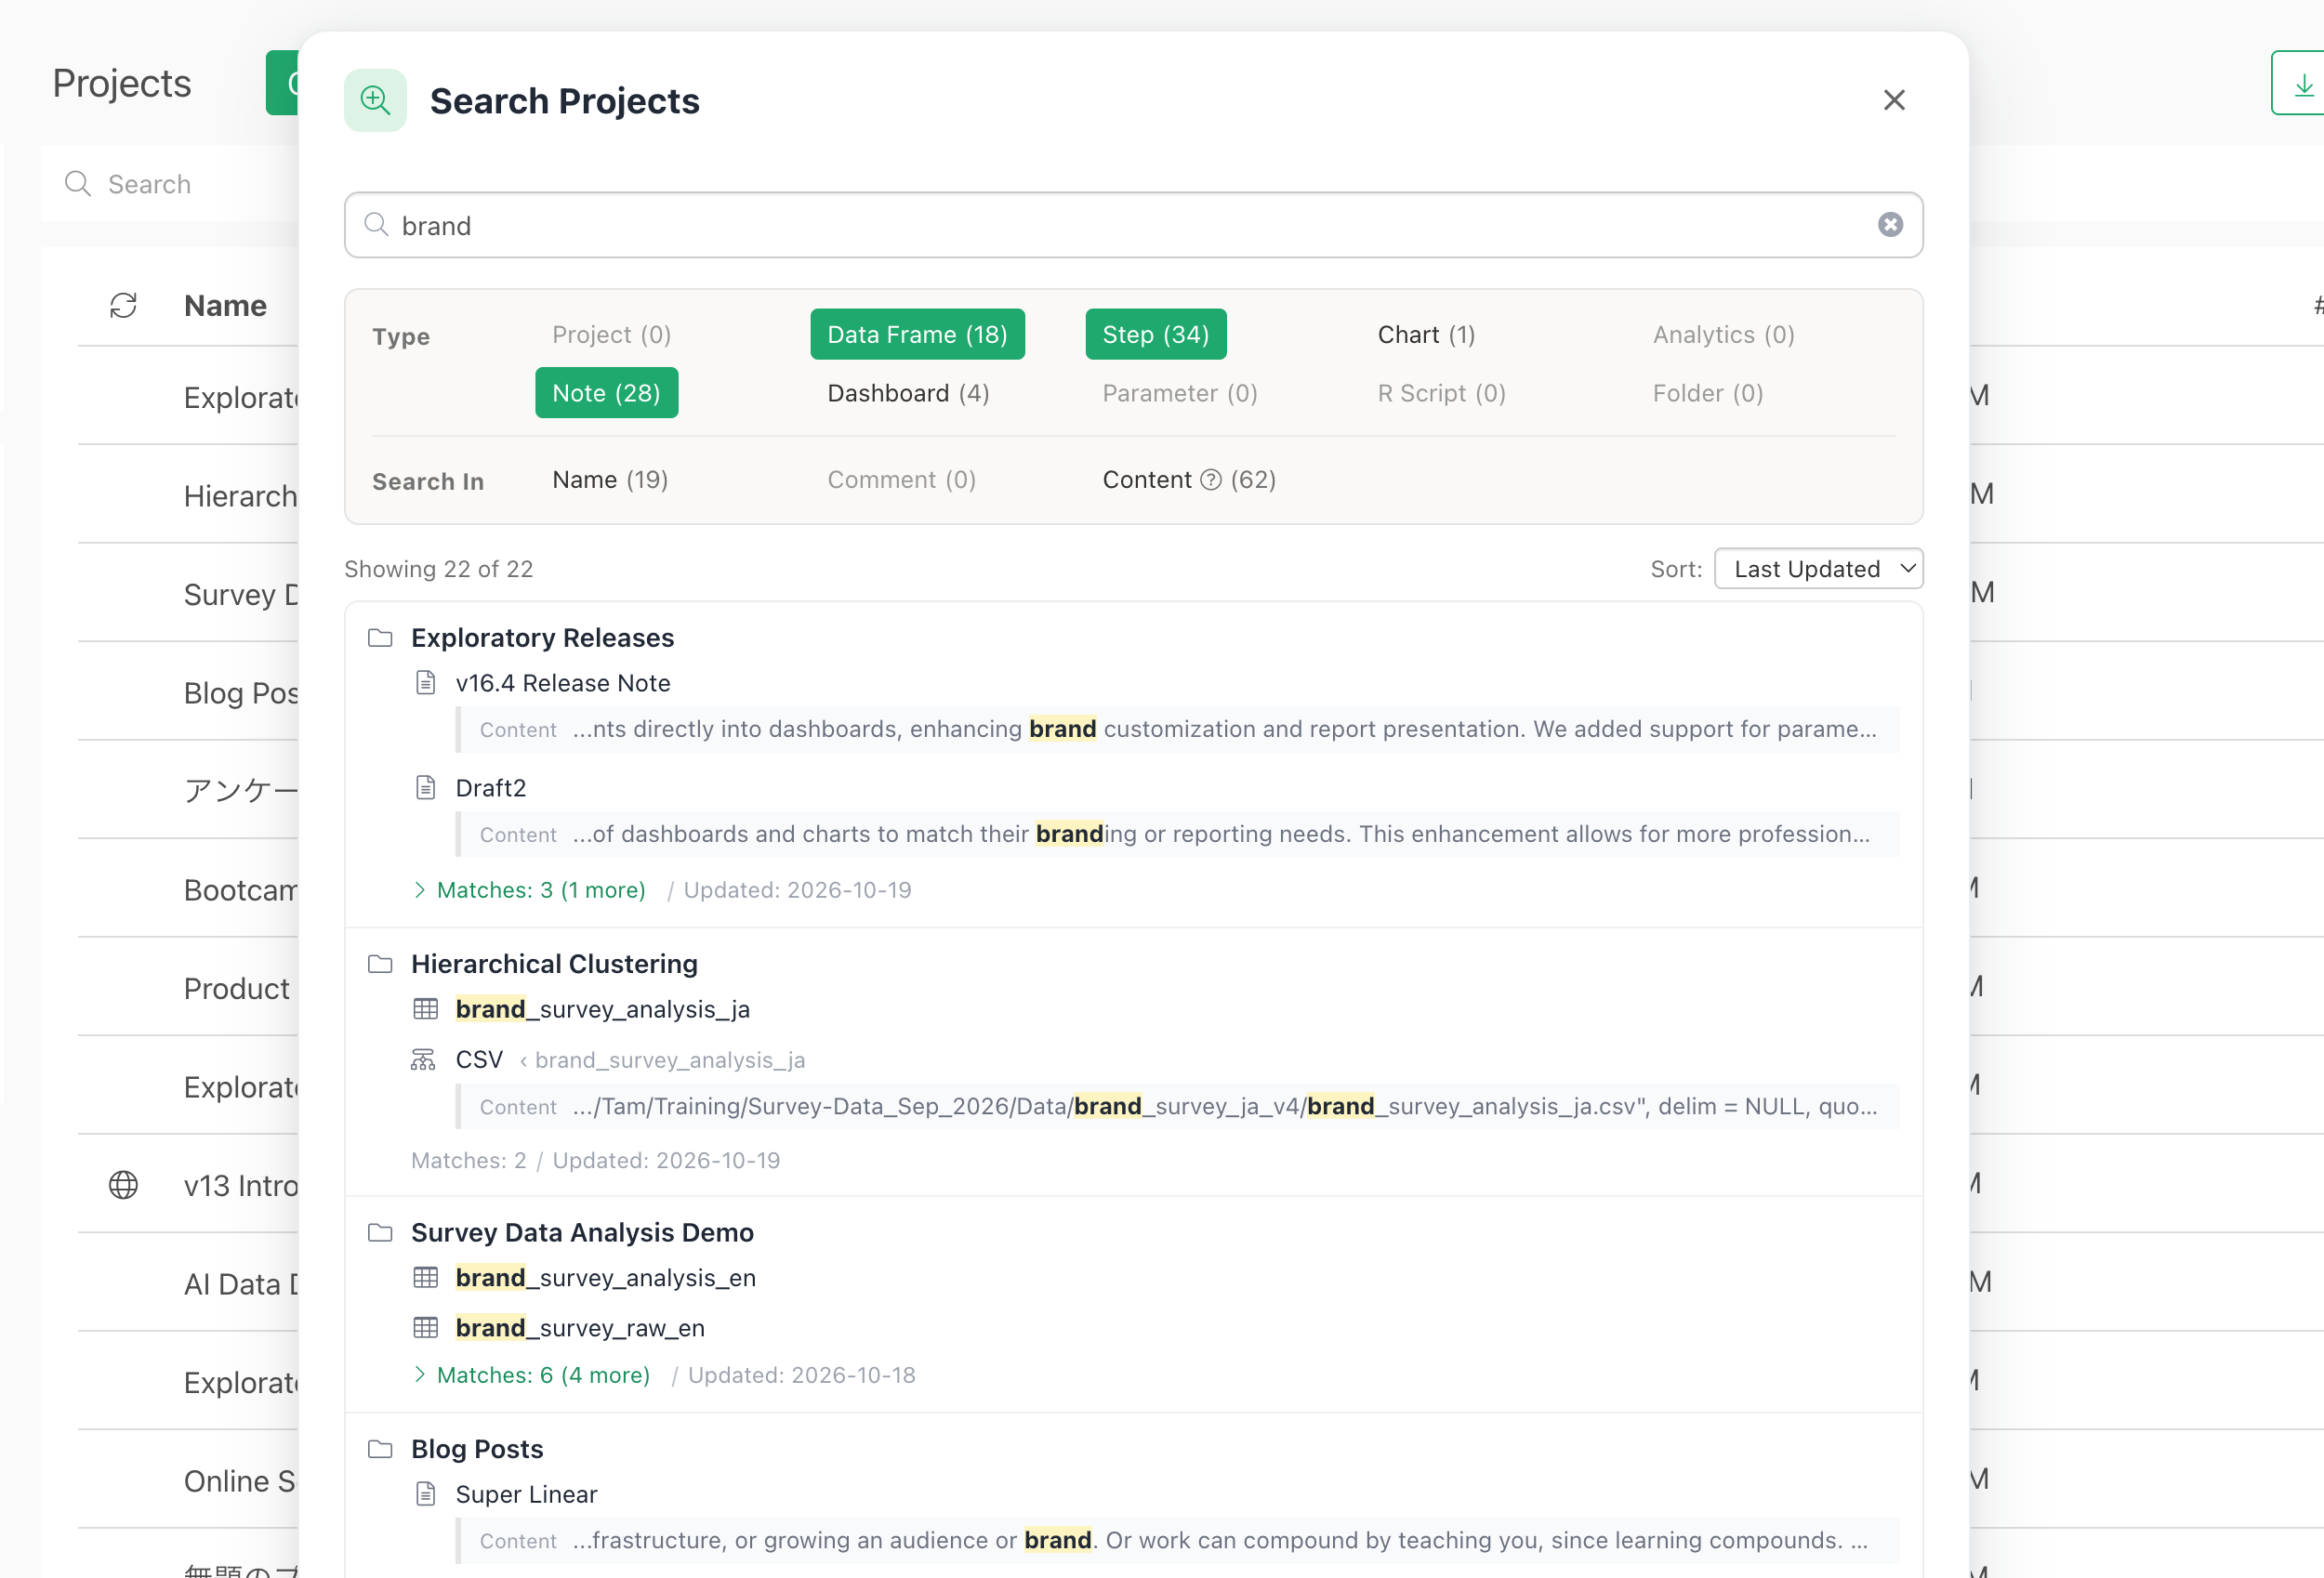
This makes navigating large collections of projects much easier.
Search Within Projects
You can now search across a wide range of content within a project, including:
- Data wrangling steps
- Notes and their contents
- Scripts
- Charts and other project components
Search results include highlighted keyword matches and contextual snippets, helping you identify exactly where a term appears.
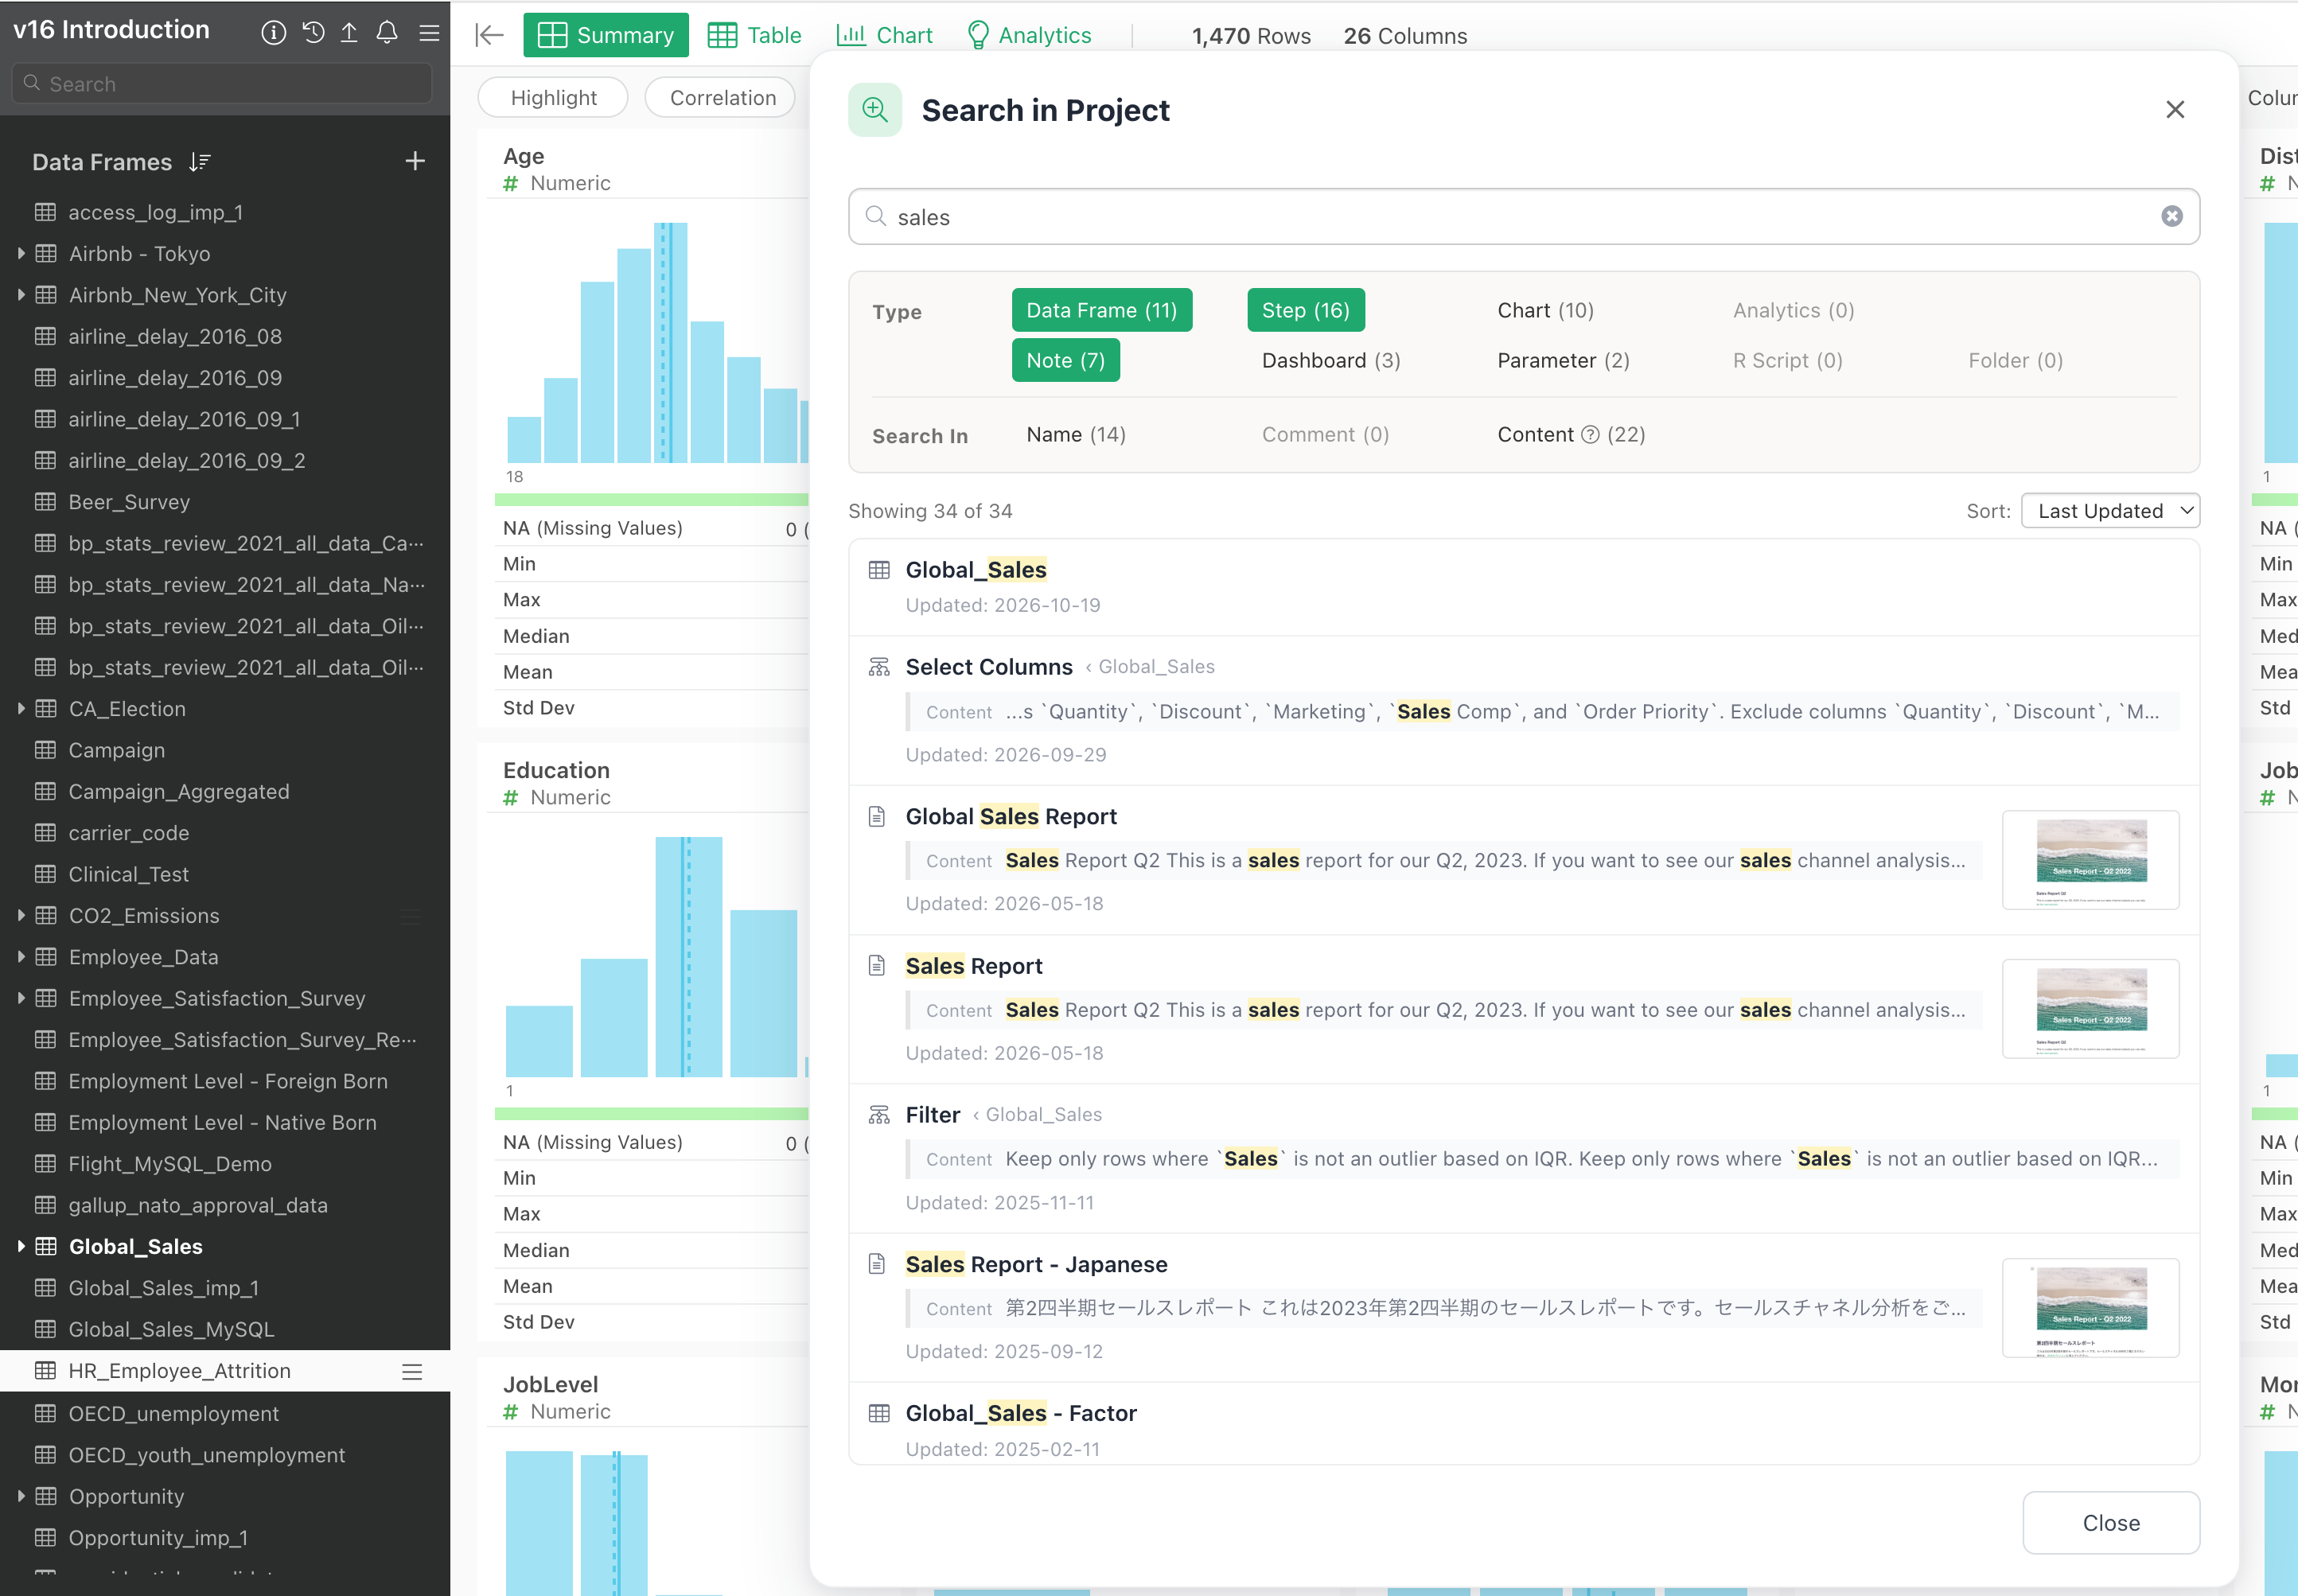
You can also jump directly from a result to the corresponding chart, step, or note.
For example, if you remember creating a calculation for customer retention but don’t recall where it was, you can search for the relevant keywords and quickly locate the step.
With improved indexing and relevance ranking, finding and reusing previous analytical work is now much easier.
6. Data Wrangling: Better Workflow Visualization and Performance
We’ve also improved the experience of understanding, documenting, and navigating your data wrangling workflows.
Export Step Diagrams
Exploratory automatically records data wrangling operations as a sequence of steps, making it possible to review how data has been transformed.
The Step Diagram visualizes these operations and their relationships.
In v16.4, you can now export Step Diagrams as images or files.
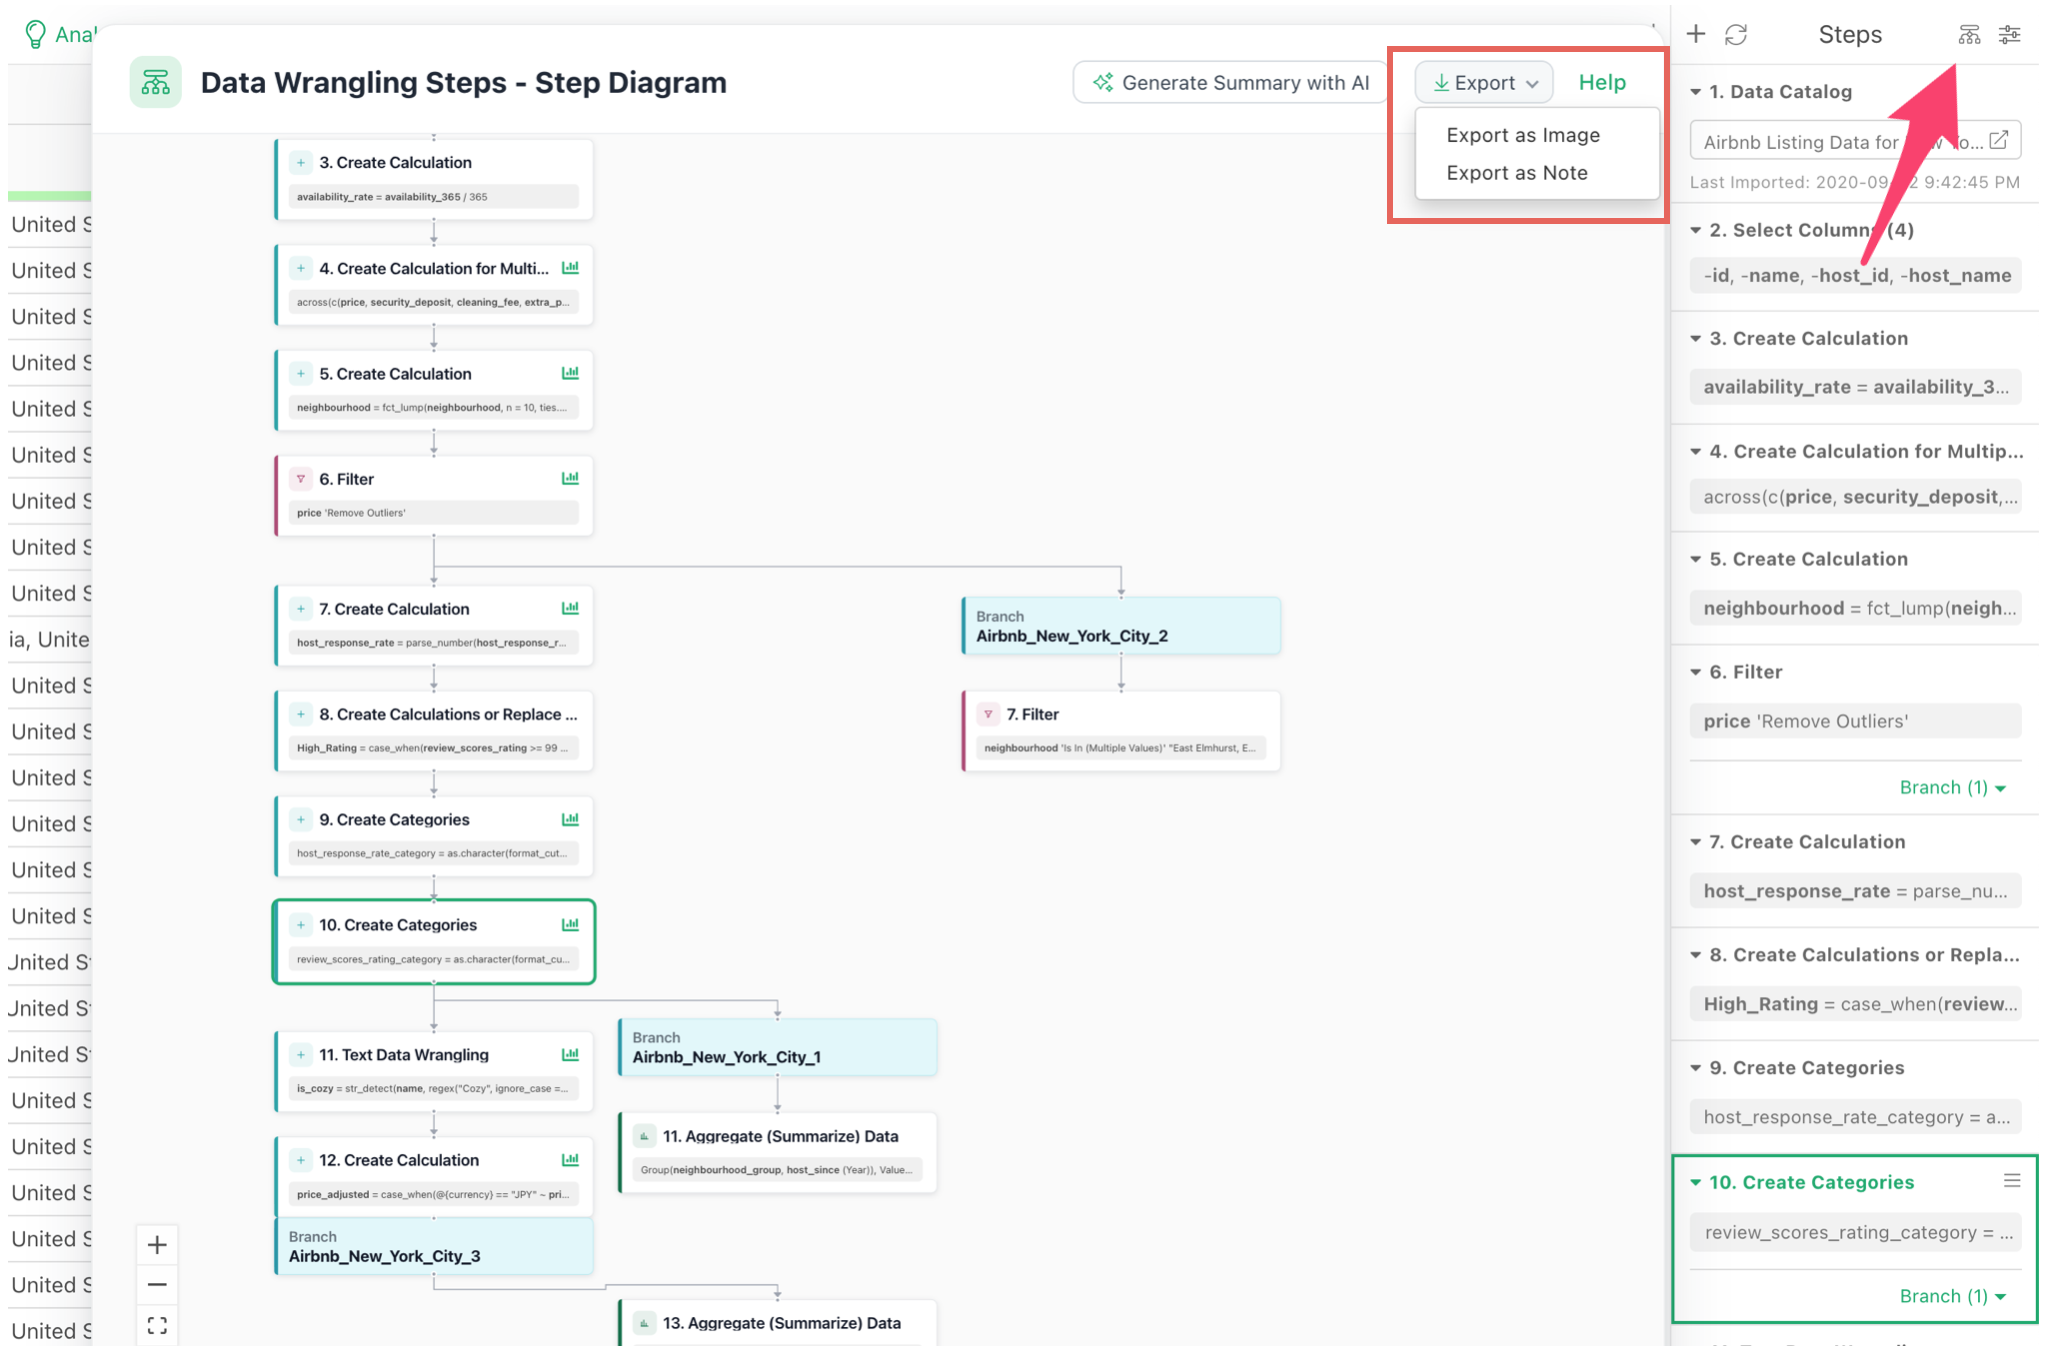
This is especially useful when documenting analytical workflows, explaining data transformations to colleagues, or sharing how a dataset was prepared.
Improved Step Diagram Layout and Zoom
We’ve improved the positioning of boxes and connecting arrows in Step Diagrams, particularly around join operations and workflows involving multiple data frames.
The initial zoom behavior has also been enhanced to display more surrounding steps when opening a diagram.
This makes it easier to understand the broader workflow without manually zooming out.
Start Working with Large Datasets Faster
When importing a dataset, you can now choose whether Exploratory initially displays the Summary View or Table View.
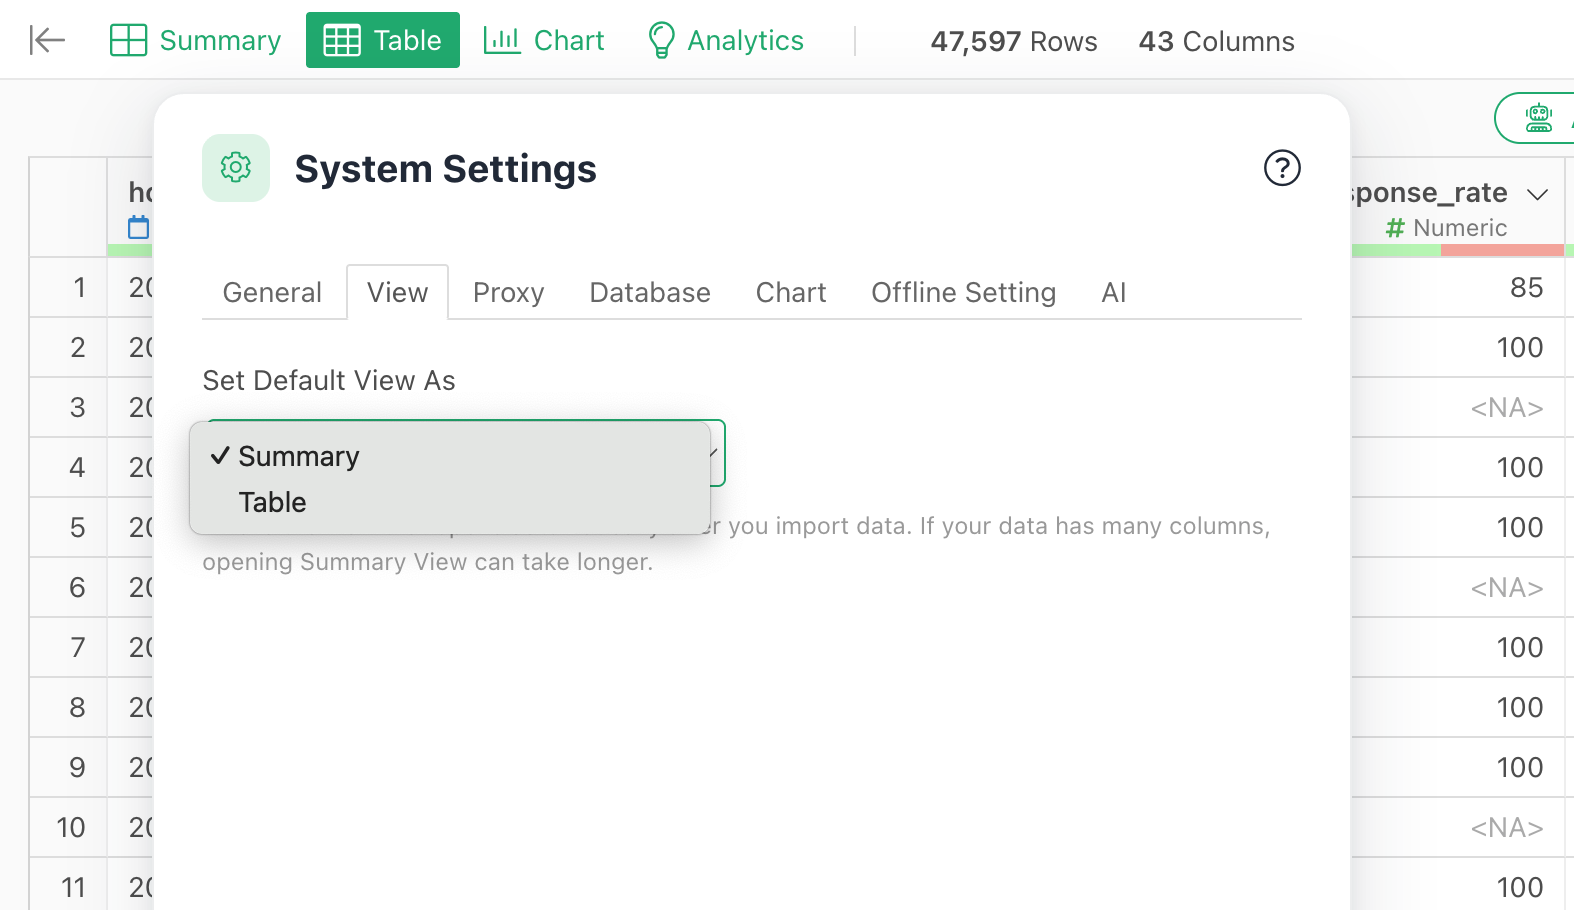
For large datasets, selecting Table View allows you to start inspecting and working with the data without waiting for summary statistics to be calculated.
This can make a noticeable difference when working with datasets containing many rows or columns.
7. More Improvements to Everyday Chart Interactions
In addition to the major features above, v16.4 includes several smaller enhancements that make everyday analysis more convenient.
Swap Chart Variables with Drag and Drop
You can now drag and drop variables between chart shelves, including X Axis, Y Axis, Color, and Repeat.
This makes it faster to explore different visualizations without repeatedly selecting variables.
Move Repeat Labels to the Top
You can now position Repeat labels above individual charts rather than below them.
This improves readability when comparing multiple charts side by side.
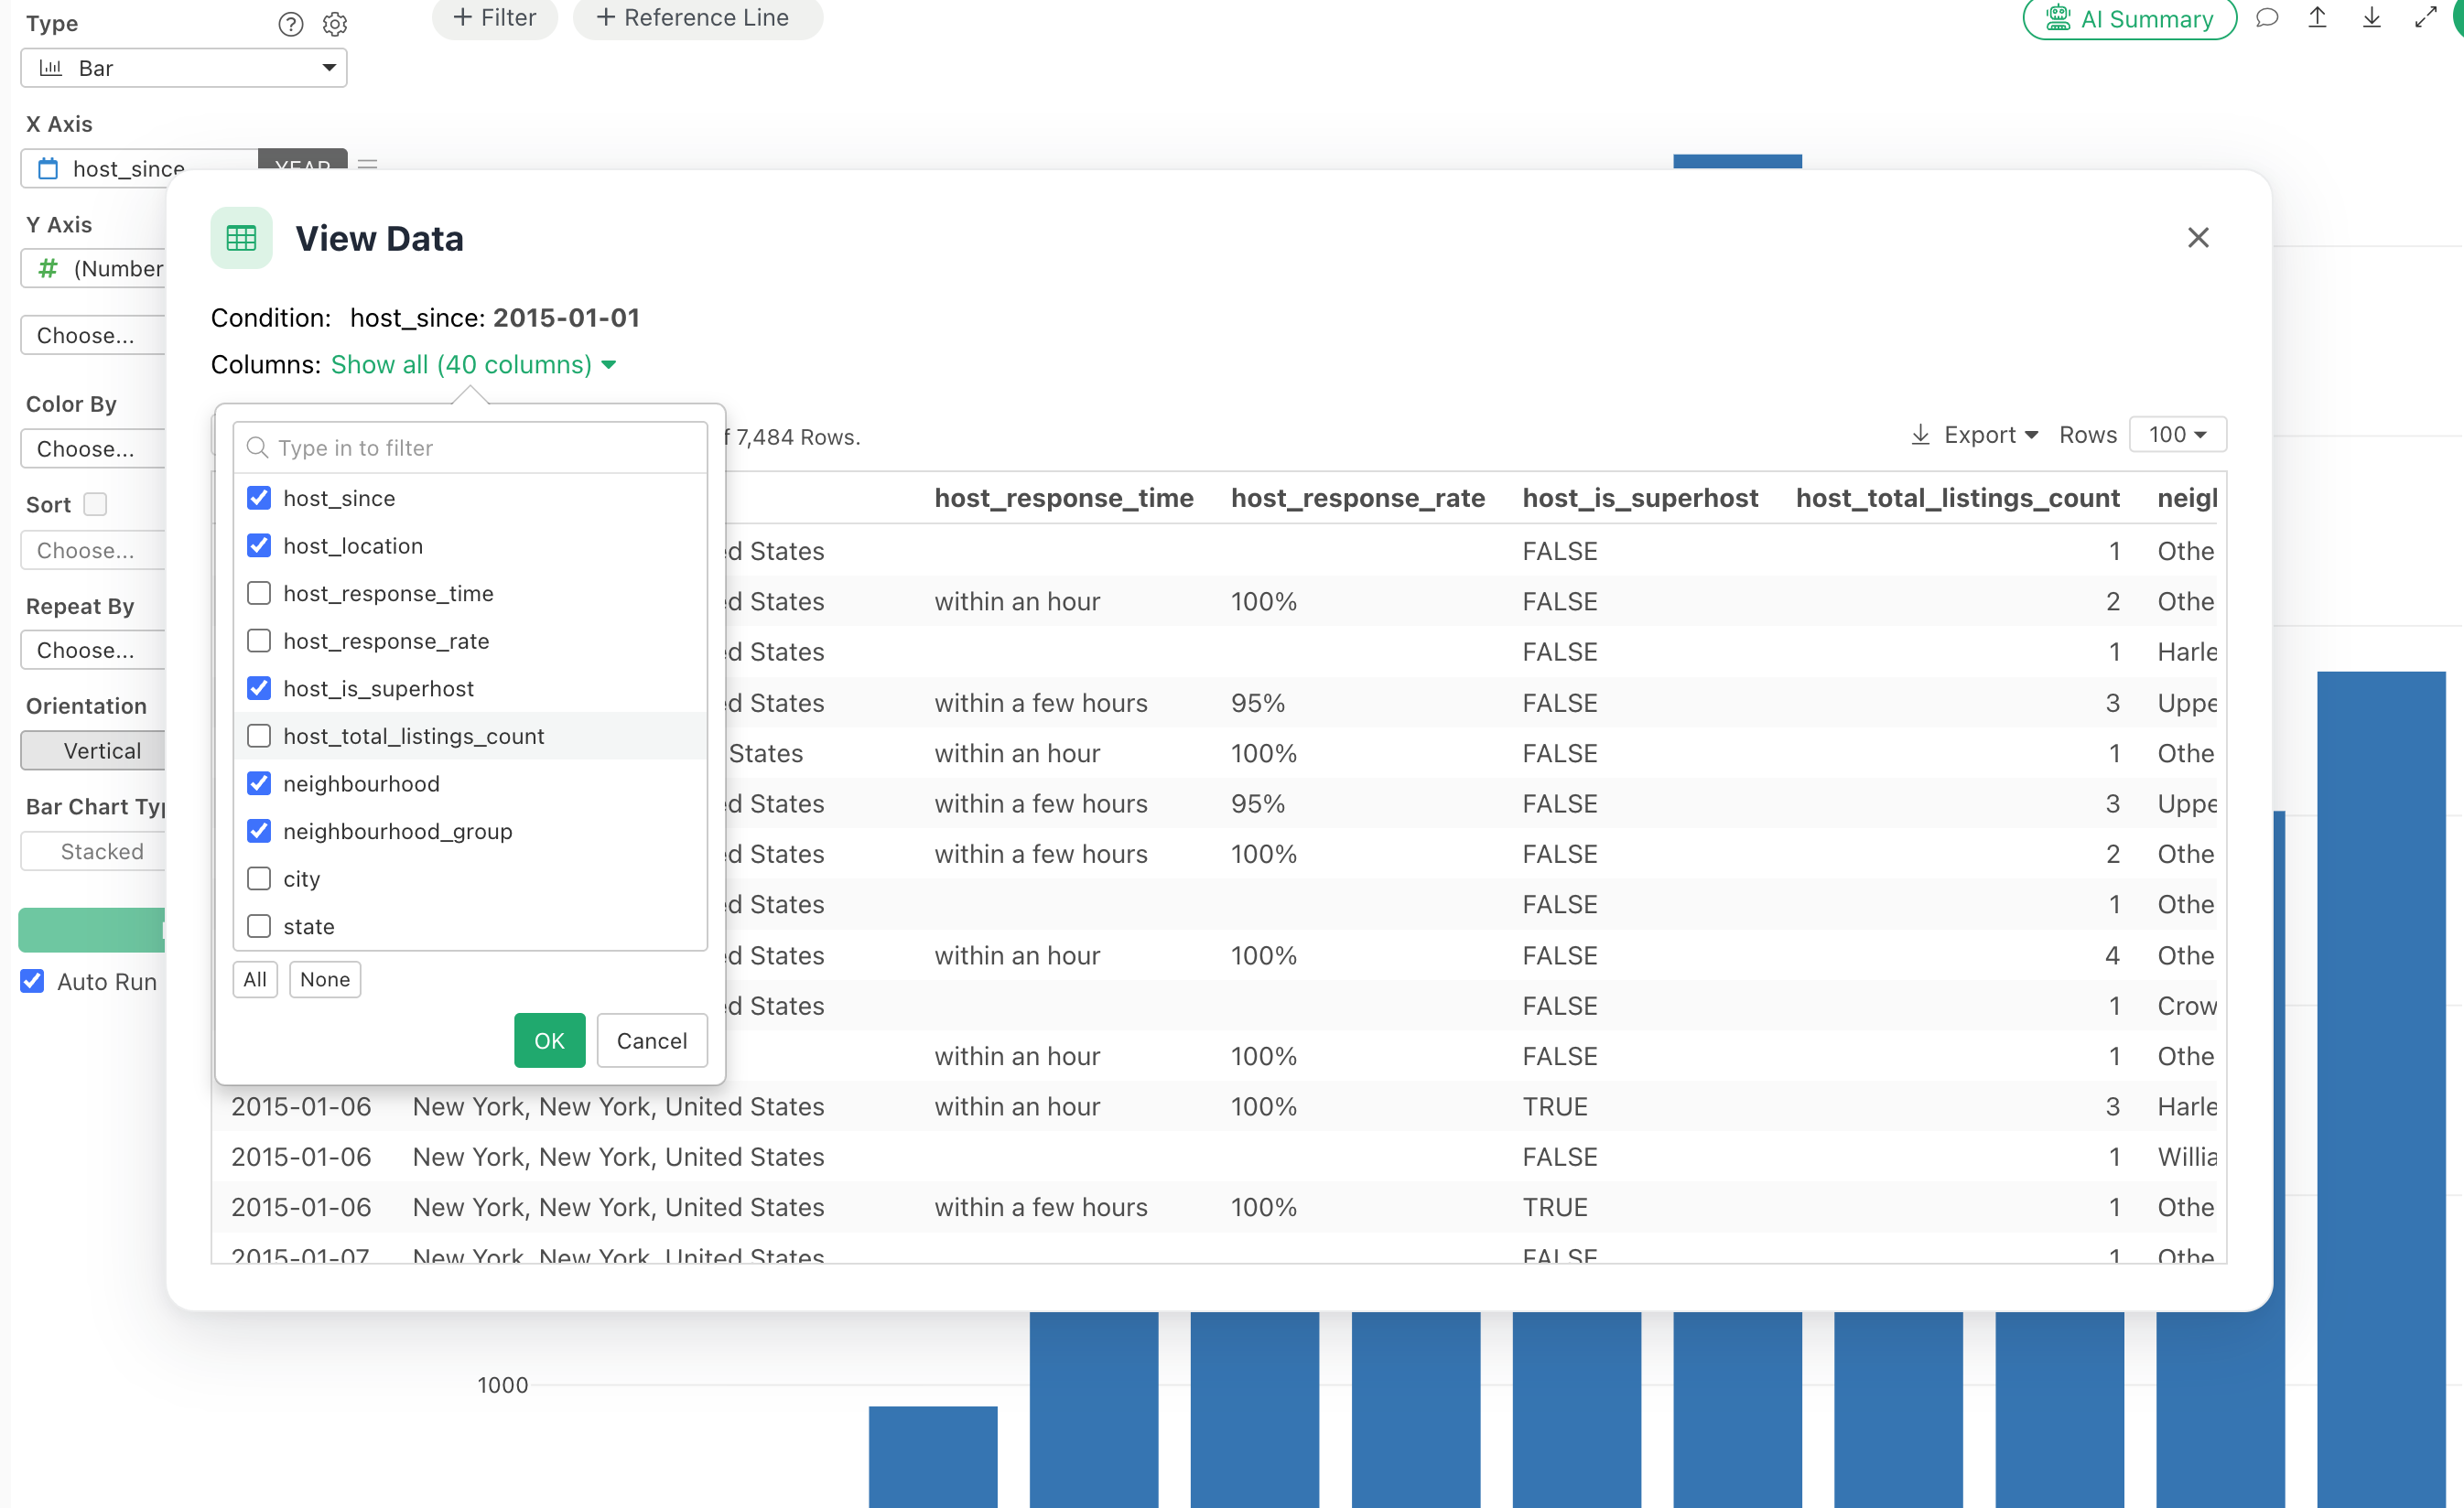
Enhanced Show Details Dialog
The Show Details dialog now supports resizing column widths through drag and drop.
You can also select which columns to display, making it easier to focus on relevant information and keep unnecessary columns out of the view.
Conclusion: Deeper and More Efficient Way to Analyze Data
Exploratory v16.4 brings improvements across the entire analytics workflow.
With Hierarchical Clustering, you can explore complex relationships and discover meaningful structures in your data.
New survey analytics features, statistical annotations, and visualization options help you analyze results and communicate findings more effectively.
Meanwhile, enhanced dashboards, faster search, and improved workflow visualization make it easier to organize, maintain, and share your analytical work.
At Exploratory, our goal is to help analysts take control of the entire analytics workflow, from data access and wrangling to visualization, statistical analysis, and sharing insights.
Try Exploratory v16.4
Please download the latest version and try it out.
👉 Download Exploratory
https://exploratory.io/download
If you don’t have an account yet, you can start a 30-day free trial here.
👉 Start Free Trial