What Is Exploratory?
Exploratory is a data science platform that enables analysts and business users to perform data wrangling, visualization, statistical analysis, machine learning, and AI-assisted analysis through an intuitive graphical interface.
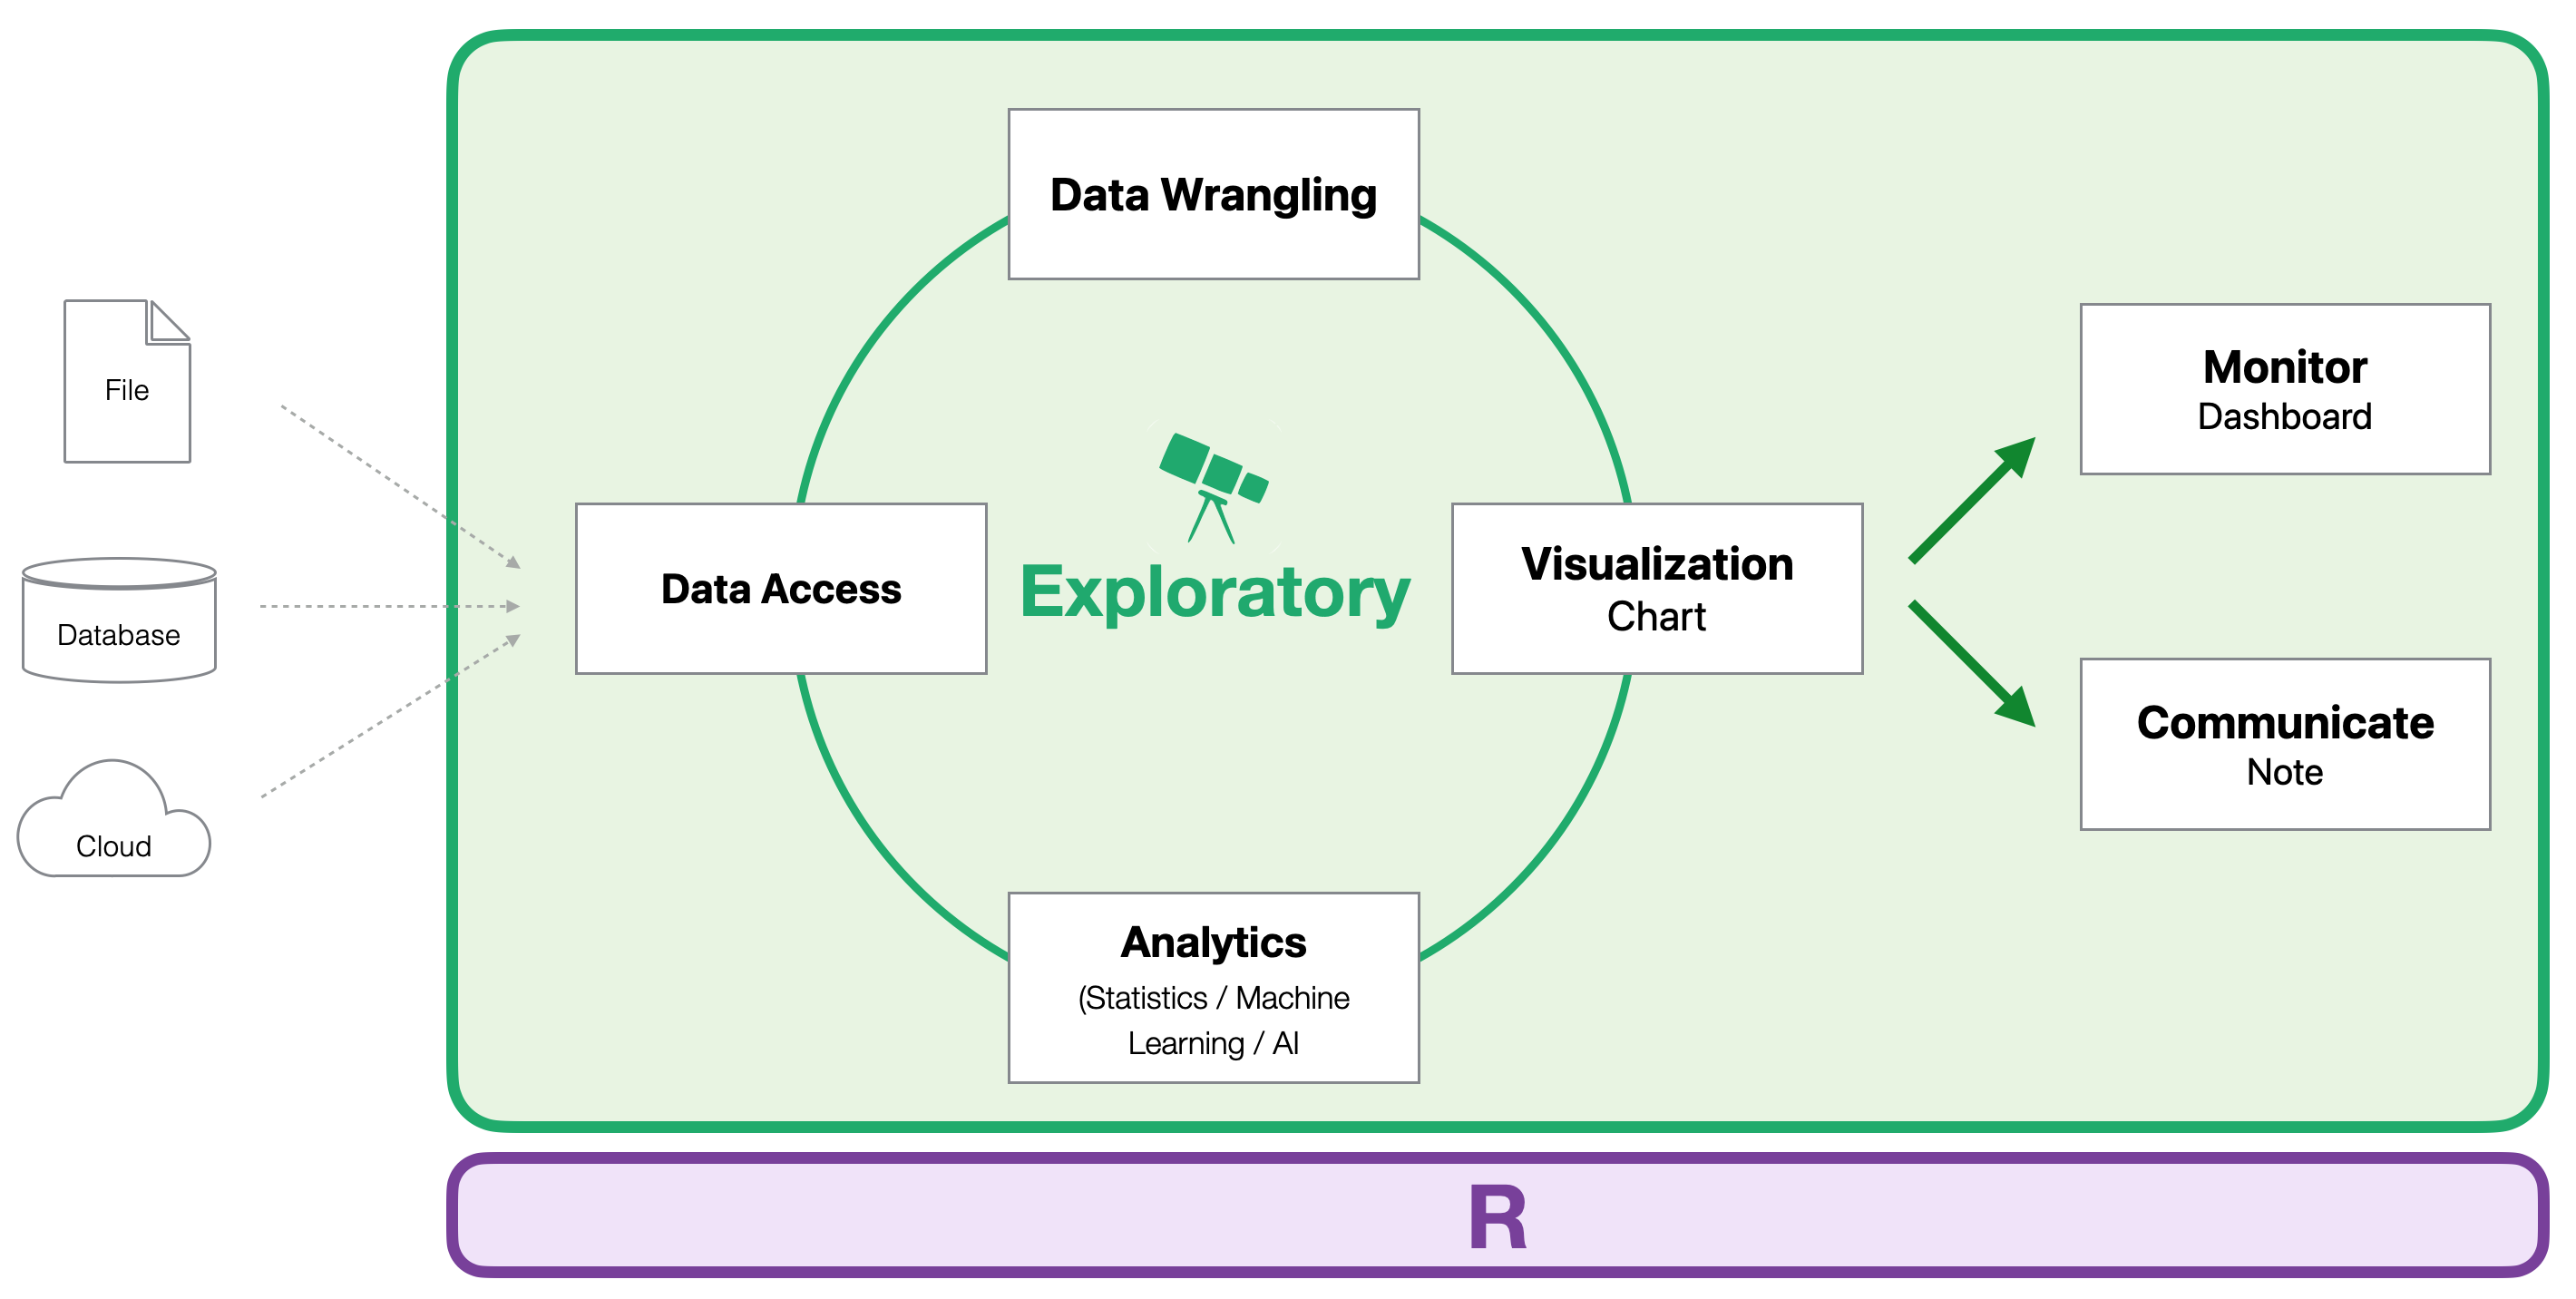
Exploratory uses the open-source statistical computing environment R as its analytics engine. This allows users to take advantage of R’s powerful capabilities for data wrangling and statistical analysis while performing much of their analytical work without writing code.
Exploratory is not just a tool for importing data or creating charts.
Its key strength is that it brings together data access, data wrangling, exploration, visualization, statistical analysis, machine learning, and sharing into a single reusable analytics workflow.
What Can You Do with Exploratory?
In real-world data analysis, the actual statistical analysis or machine learning model is often only one part of the work.
You need to collect data, remove unnecessary rows, join multiple datasets, create calculated columns, aggregate data, build charts, analyze the results, and communicate what you found.
Exploratory allows you to perform this entire process within the same environment.
Connect to Data
Exploratory can import data not only from files such as CSV and Excel, but also from databases, cloud services, APIs, and many other data sources.
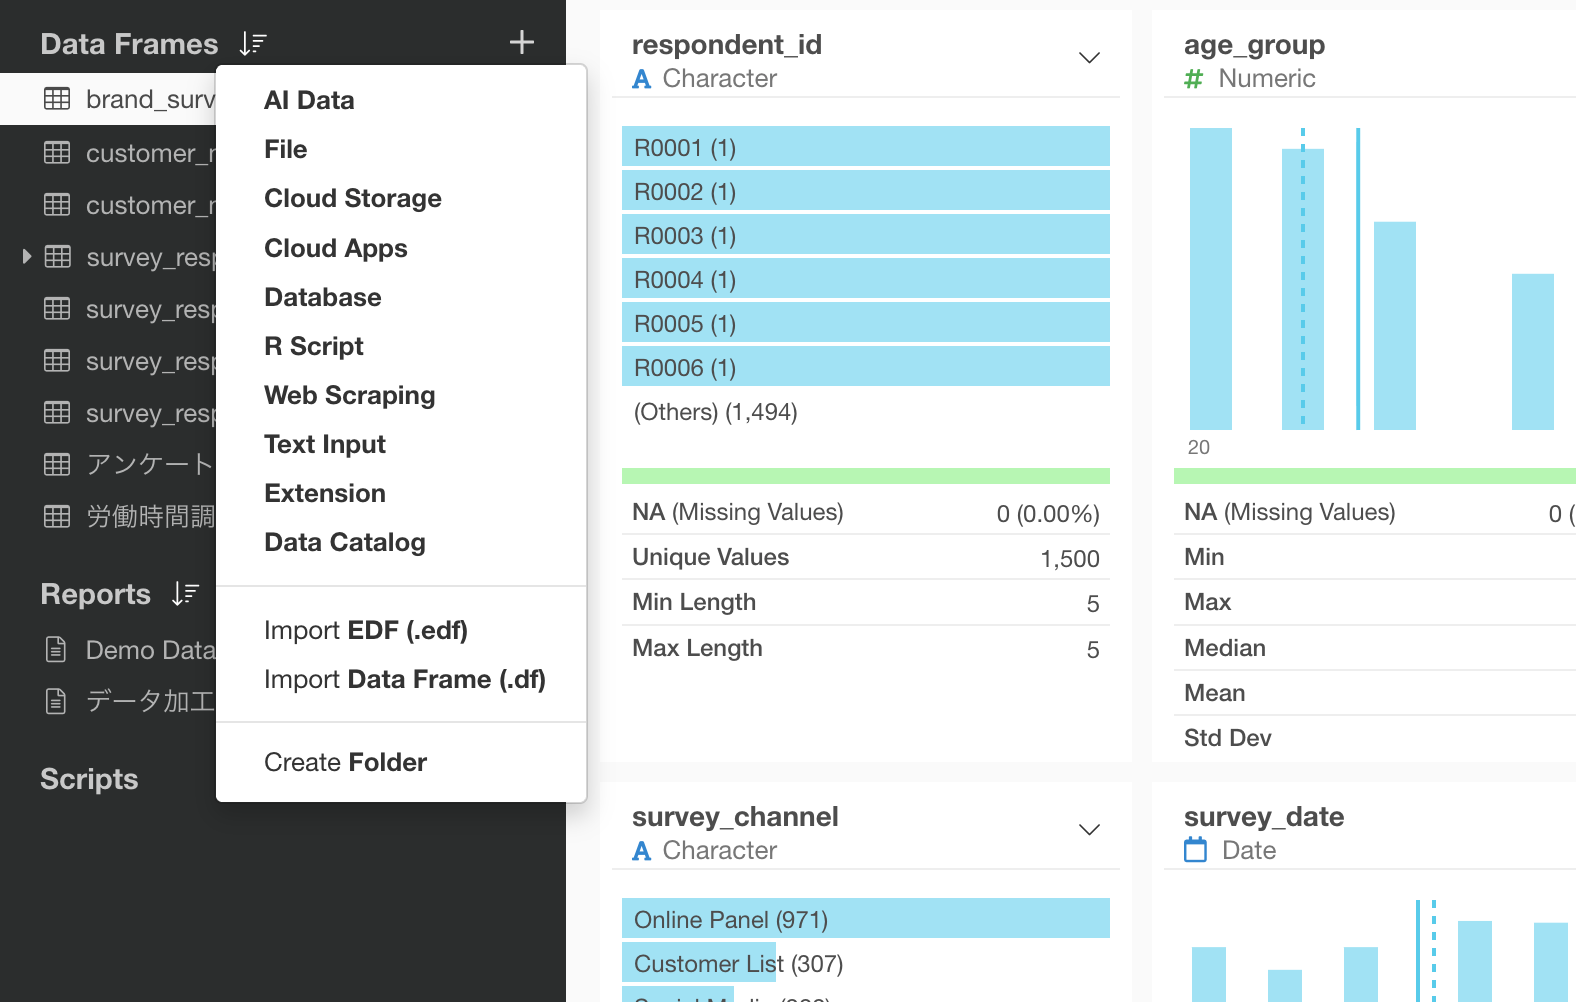
If a data source can be accessed from R, you can also use an R script when necessary to retrieve the data.
This means you do not always need to prepare your data in another tool before bringing it into Exploratory.
You can bring together data from multiple sources and incorporate it directly into a single analytics workflow.
Wrangle and Transform Data
A large portion of real-world data analysis is spent preparing and transforming data before the actual analysis begins.
With Exploratory, you can perform tasks such as:
- Filter rows based on conditions
- Join multiple datasets
- Aggregate data by groups
- Reshape data between wide and long formats
- Create calculated columns
- Handle missing values
- Transform dates and text
- Reshape survey data into formats that are easier to analyze
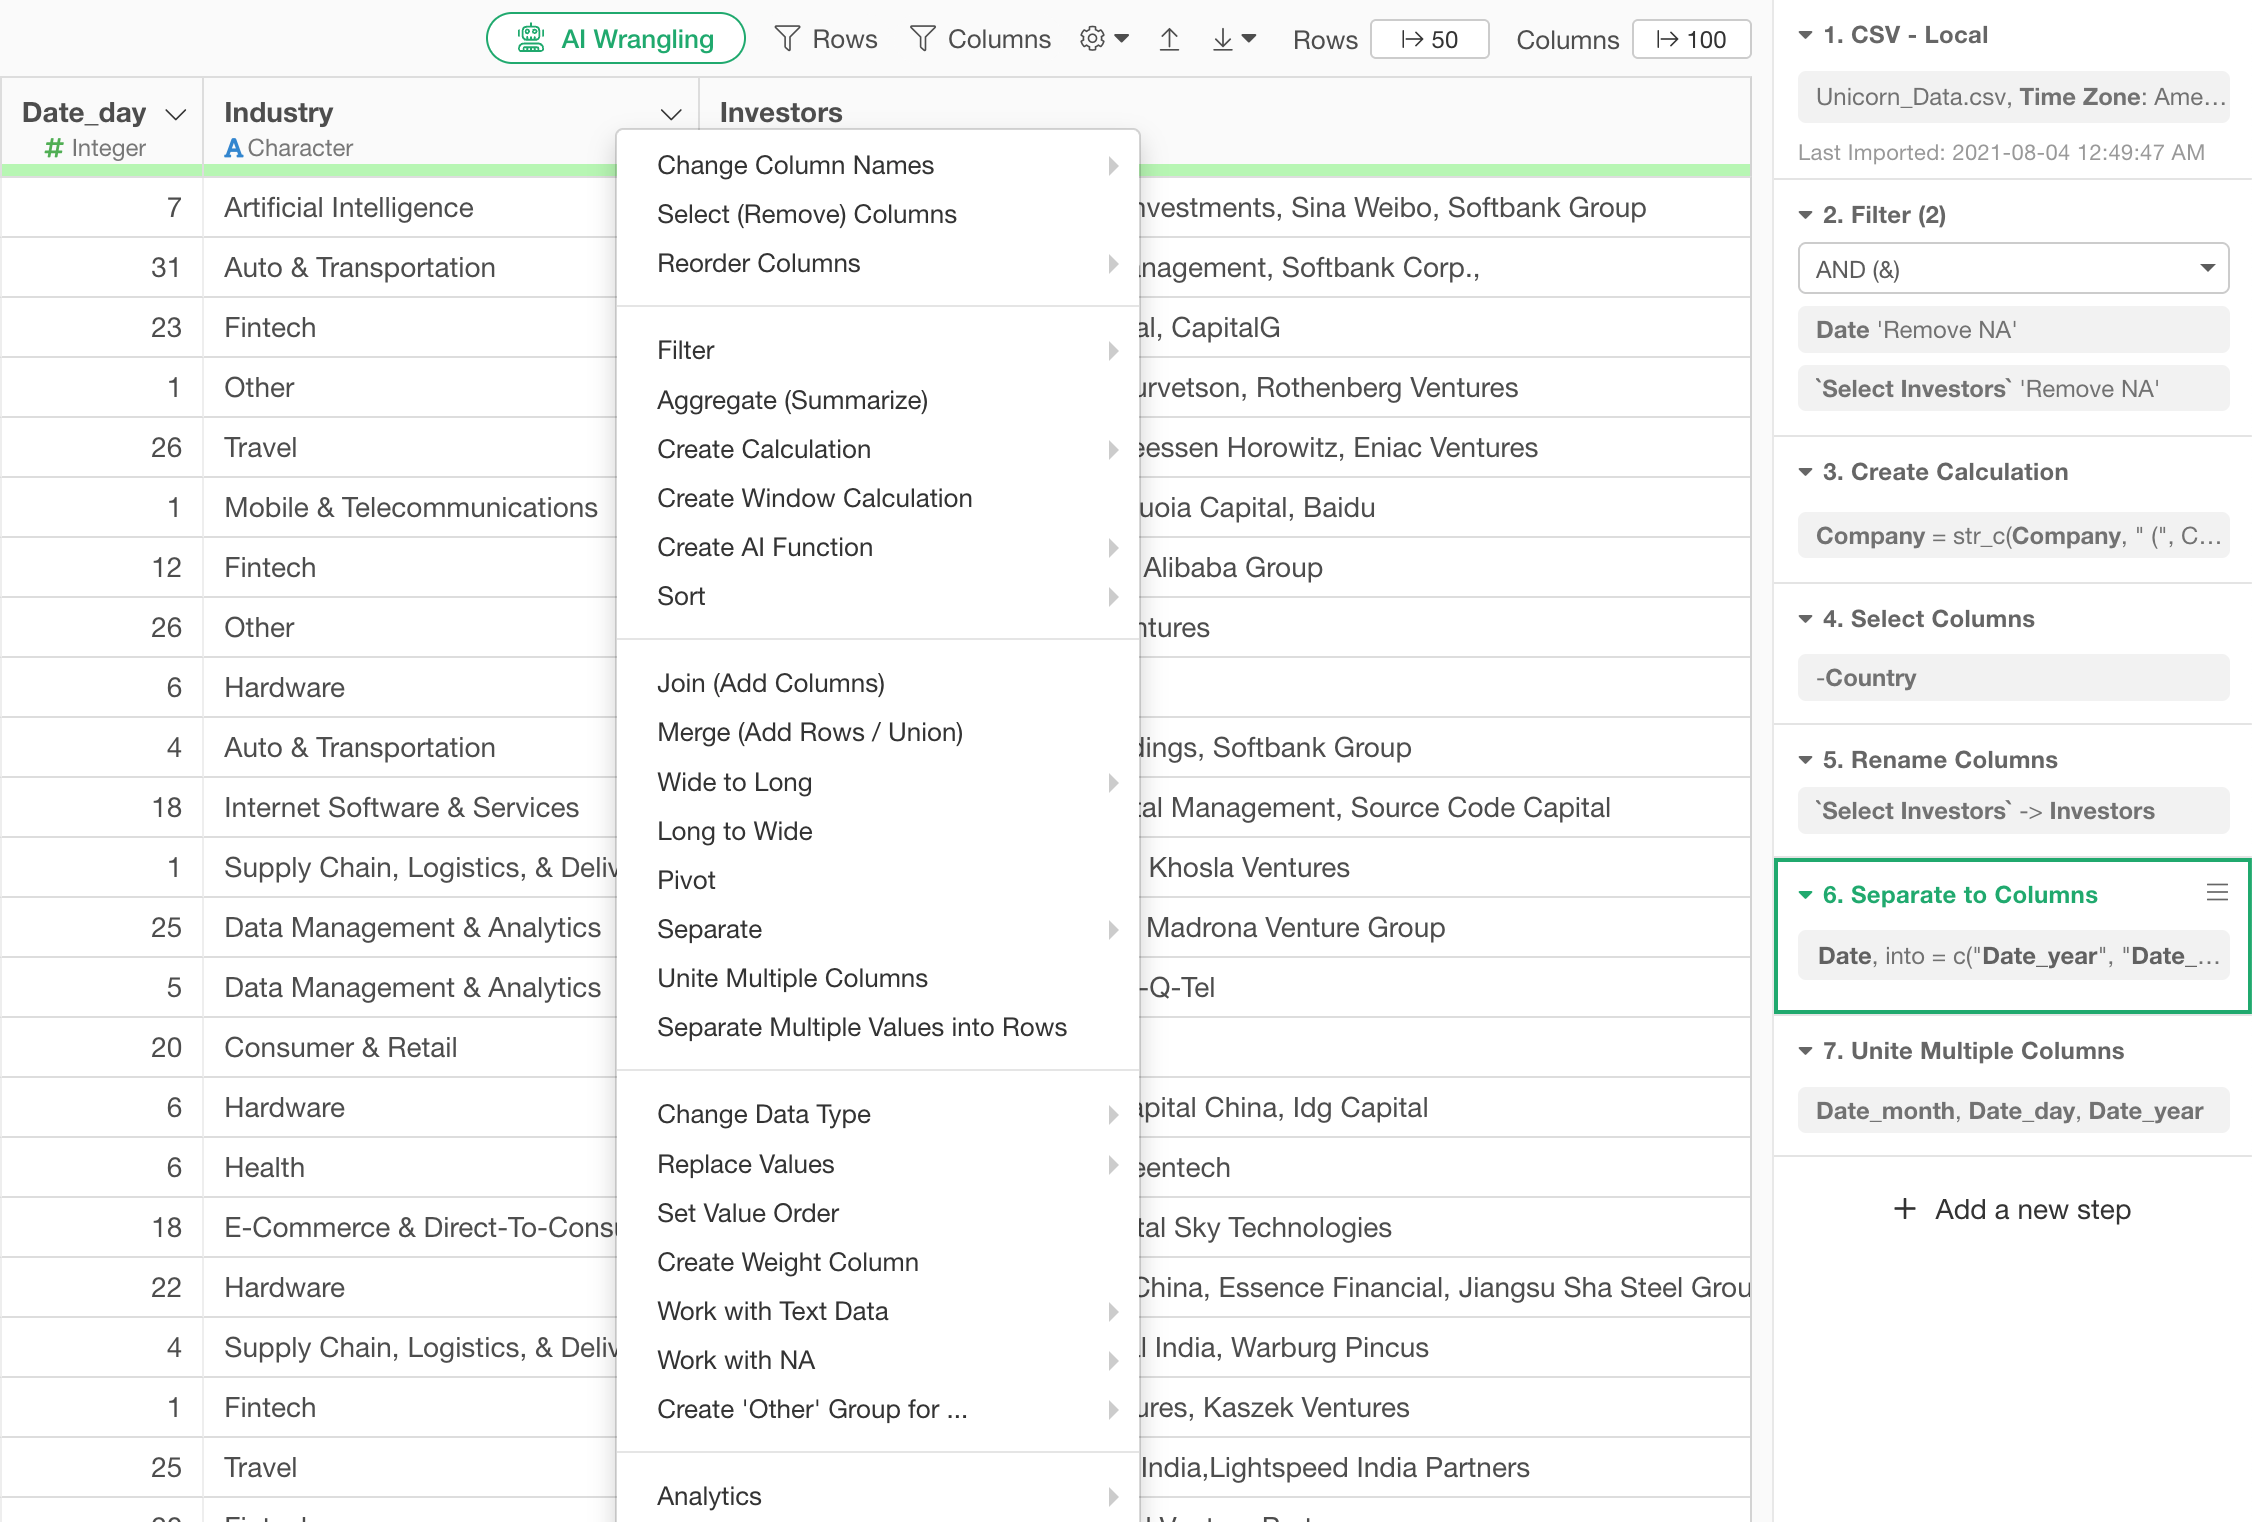
The important point is that these transformations are not isolated, one-time operations.
In Exploratory, every transformation is recorded as a step.
When the source data is updated, you do not need to repeat the same work manually from the beginning. You can simply rerun the saved steps against the new data.
Explore and Visualize Data
Understanding data requires more than simply looking at averages or totals.
You often need to explore questions such as:
- How are the values distributed?
- Are there differences between groups?
- Are variables related to one another?
- How are values changing over time?
Exploratory lets you visually explore your data using charts and pivot tables such as:
- Bar charts
- Line charts
- Scatter plots
- Histograms
- Box plots
- Maps
- Pivot tables
These visualizations help you examine distributions, trends, differences between groups, and relationships between variables.
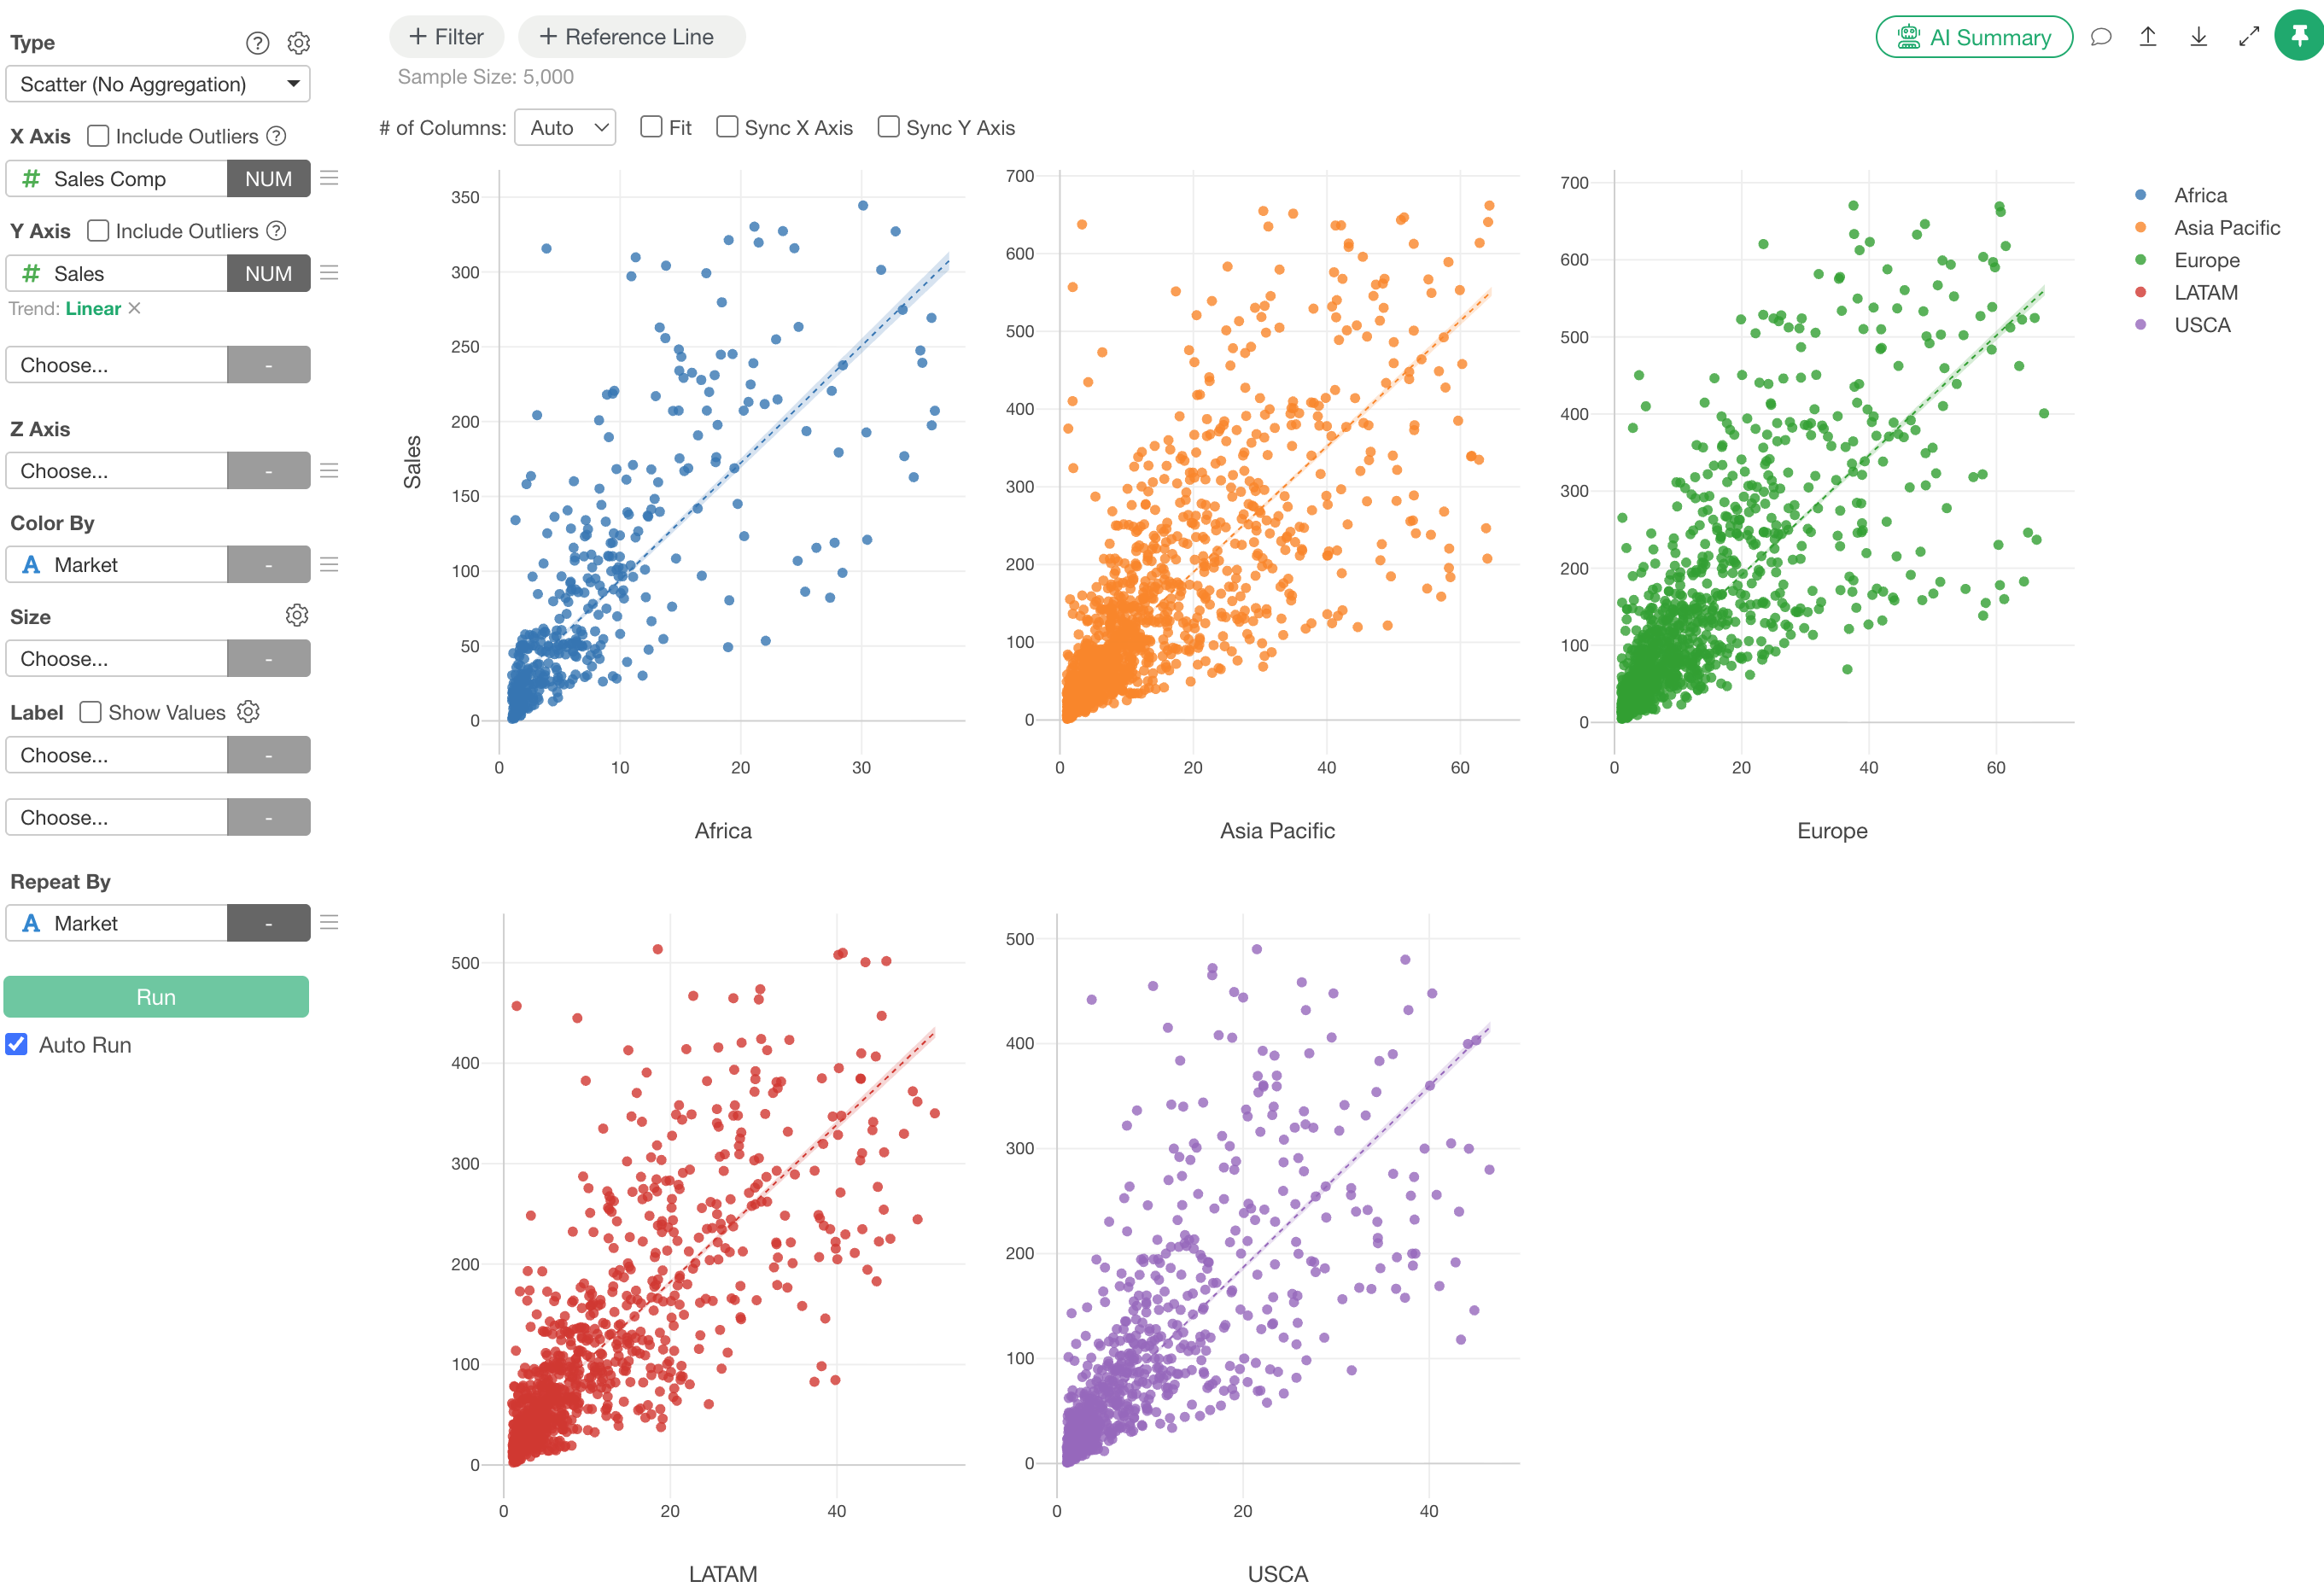
Because visualization, data wrangling, and statistical analysis are integrated into the same workflow, you can quickly move from something you notice in a chart to additional data transformation or deeper analysis.
Use Statistical Analysis and Machine Learning to Understand Data More Deeply
Data visualization can reveal a great deal.
But answering questions such as:
- Is this difference likely to be due to chance?
- Which factors are associated with the outcome?
- What types of groups exist within the data?
- What outcomes are likely in the future?
often requires statistical analysis or machine learning.
Exploratory provides a wide range of analytical methods through its graphical interface, including:
- Hypothesis testing
- Correlation analysis
- Linear regression
- Logistic regression
- Ordinal logistic regression
- Principal component analysis
- Factor analysis
- Reliability analysis
- Clustering
- Decision trees
- CHAID
- Time series analysis
- Survival analysis
- Text analysis
Results are presented not only as numerical tables, but also with charts and explanations designed to make interpretation easier, including for users who are not specialists in statistical methodology.
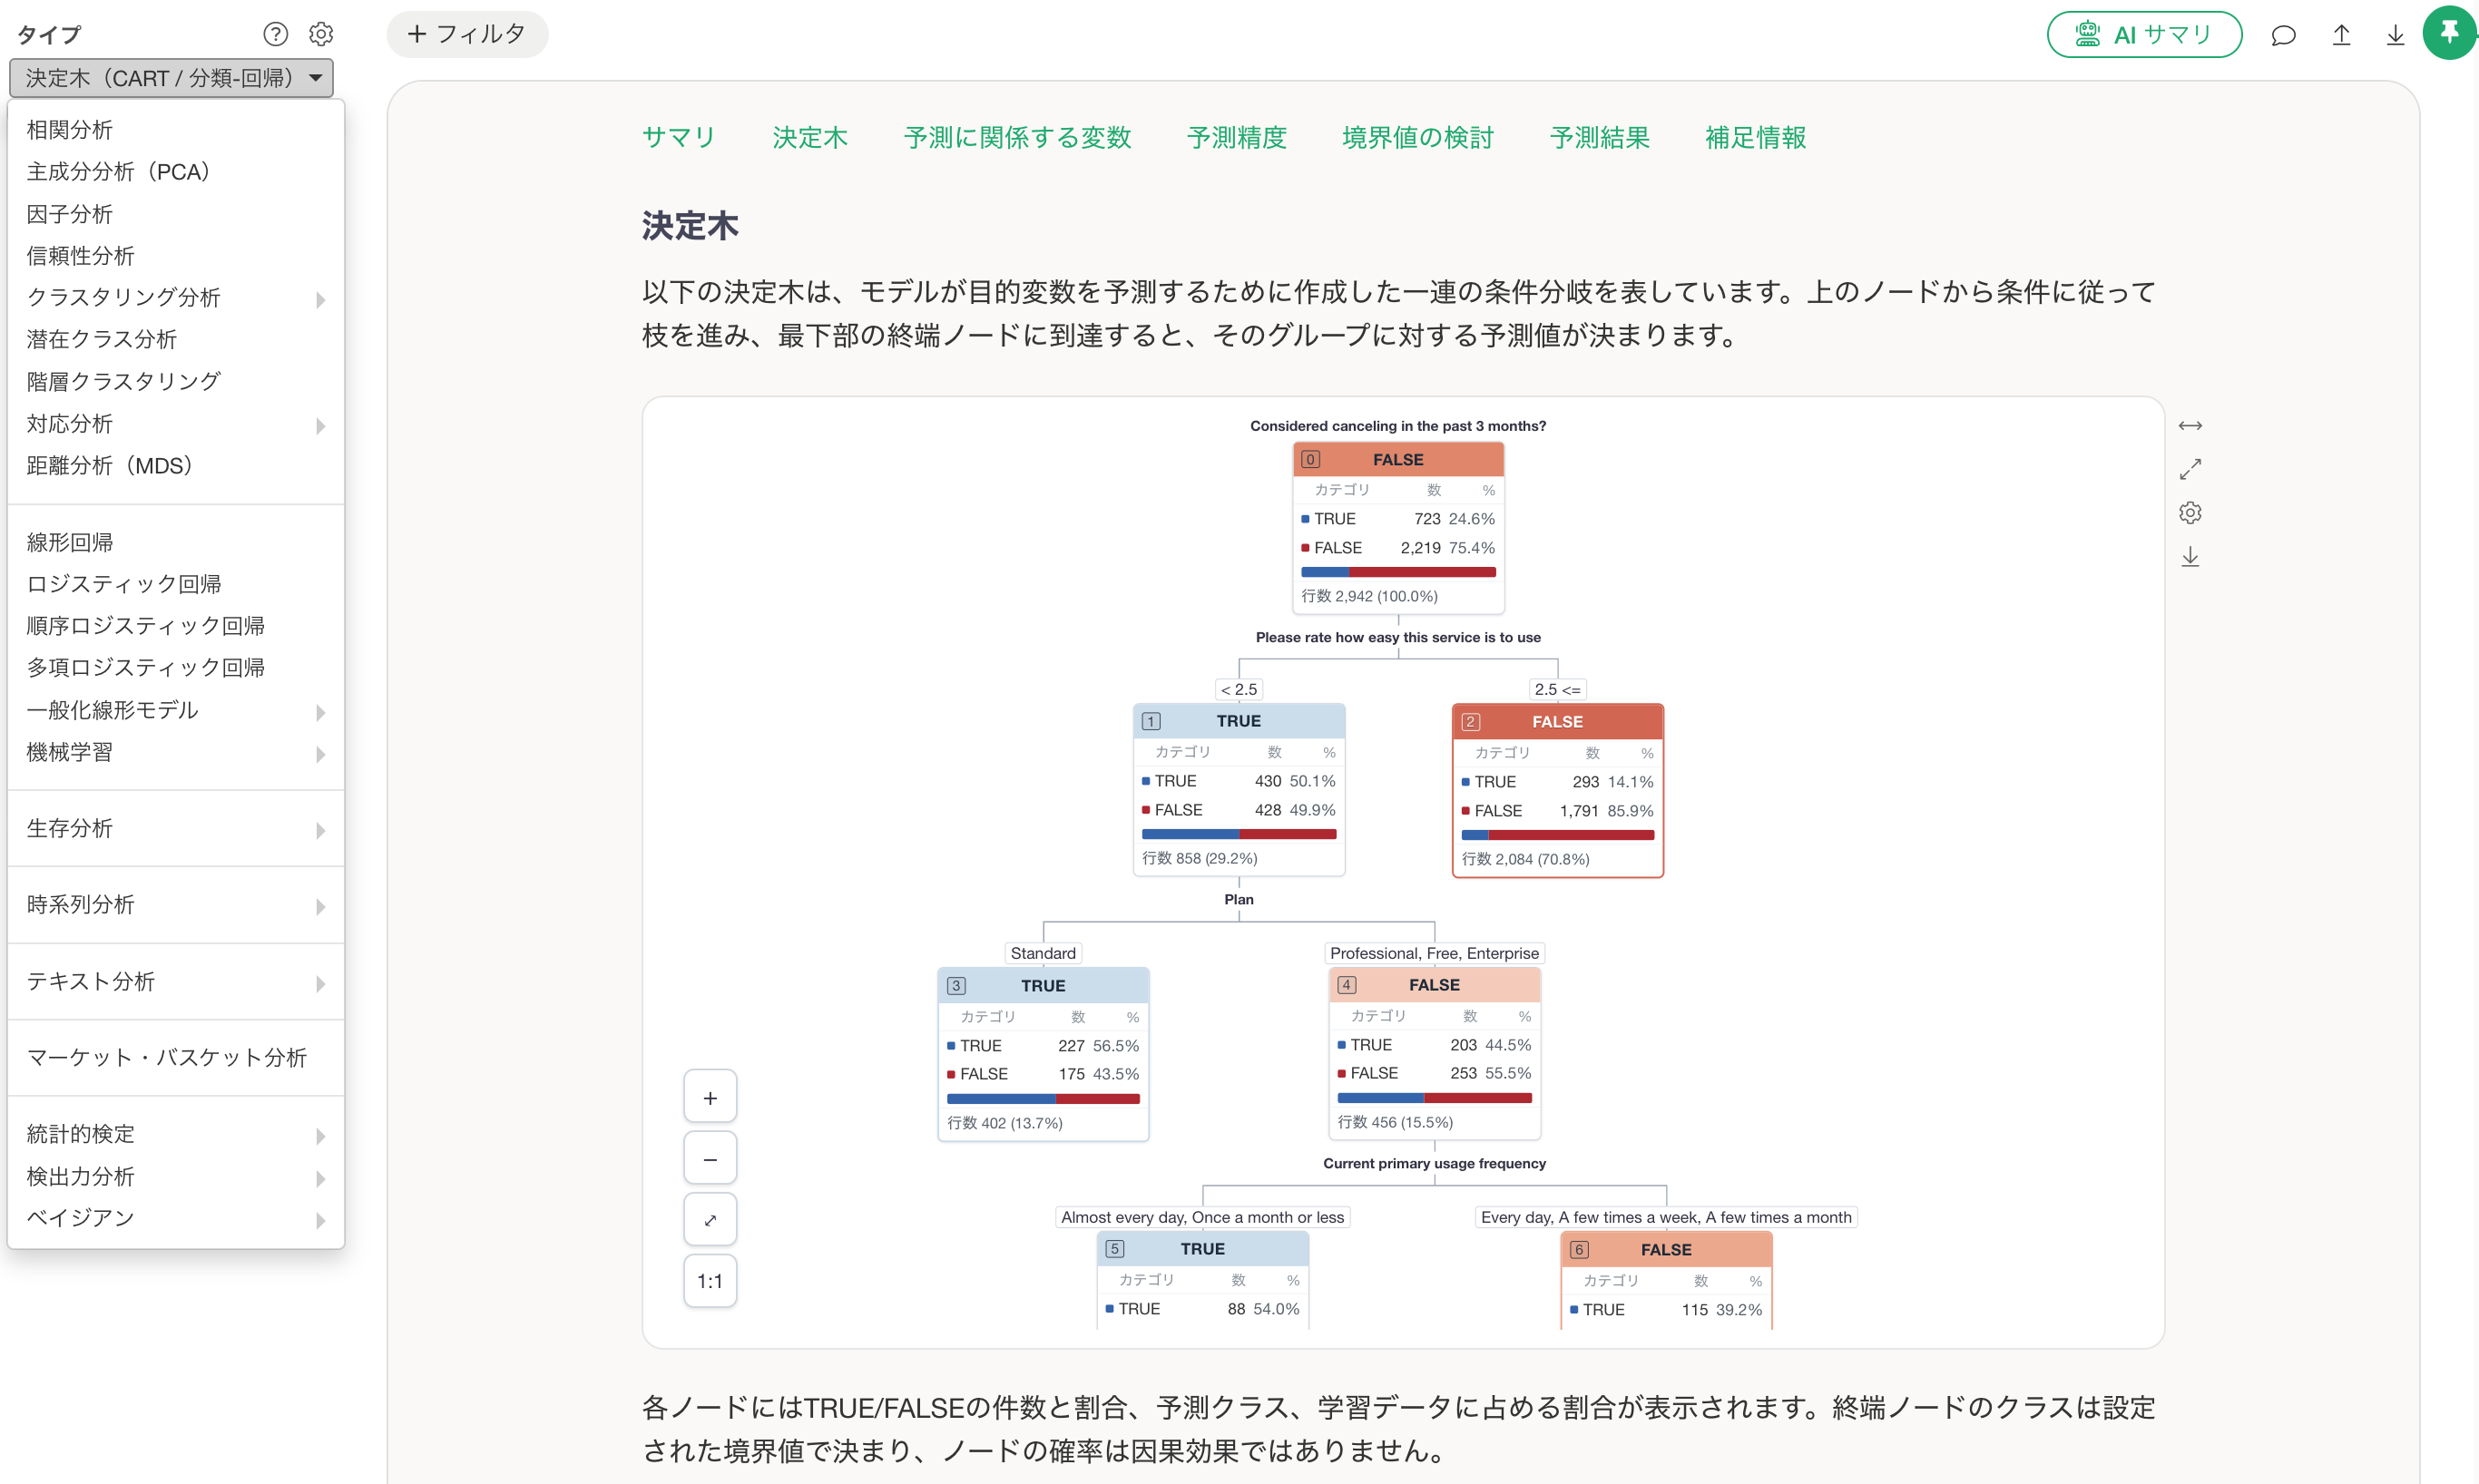
You can also build predictive models using a variety of machine learning algorithms and tune model parameters to improve predictive performance.
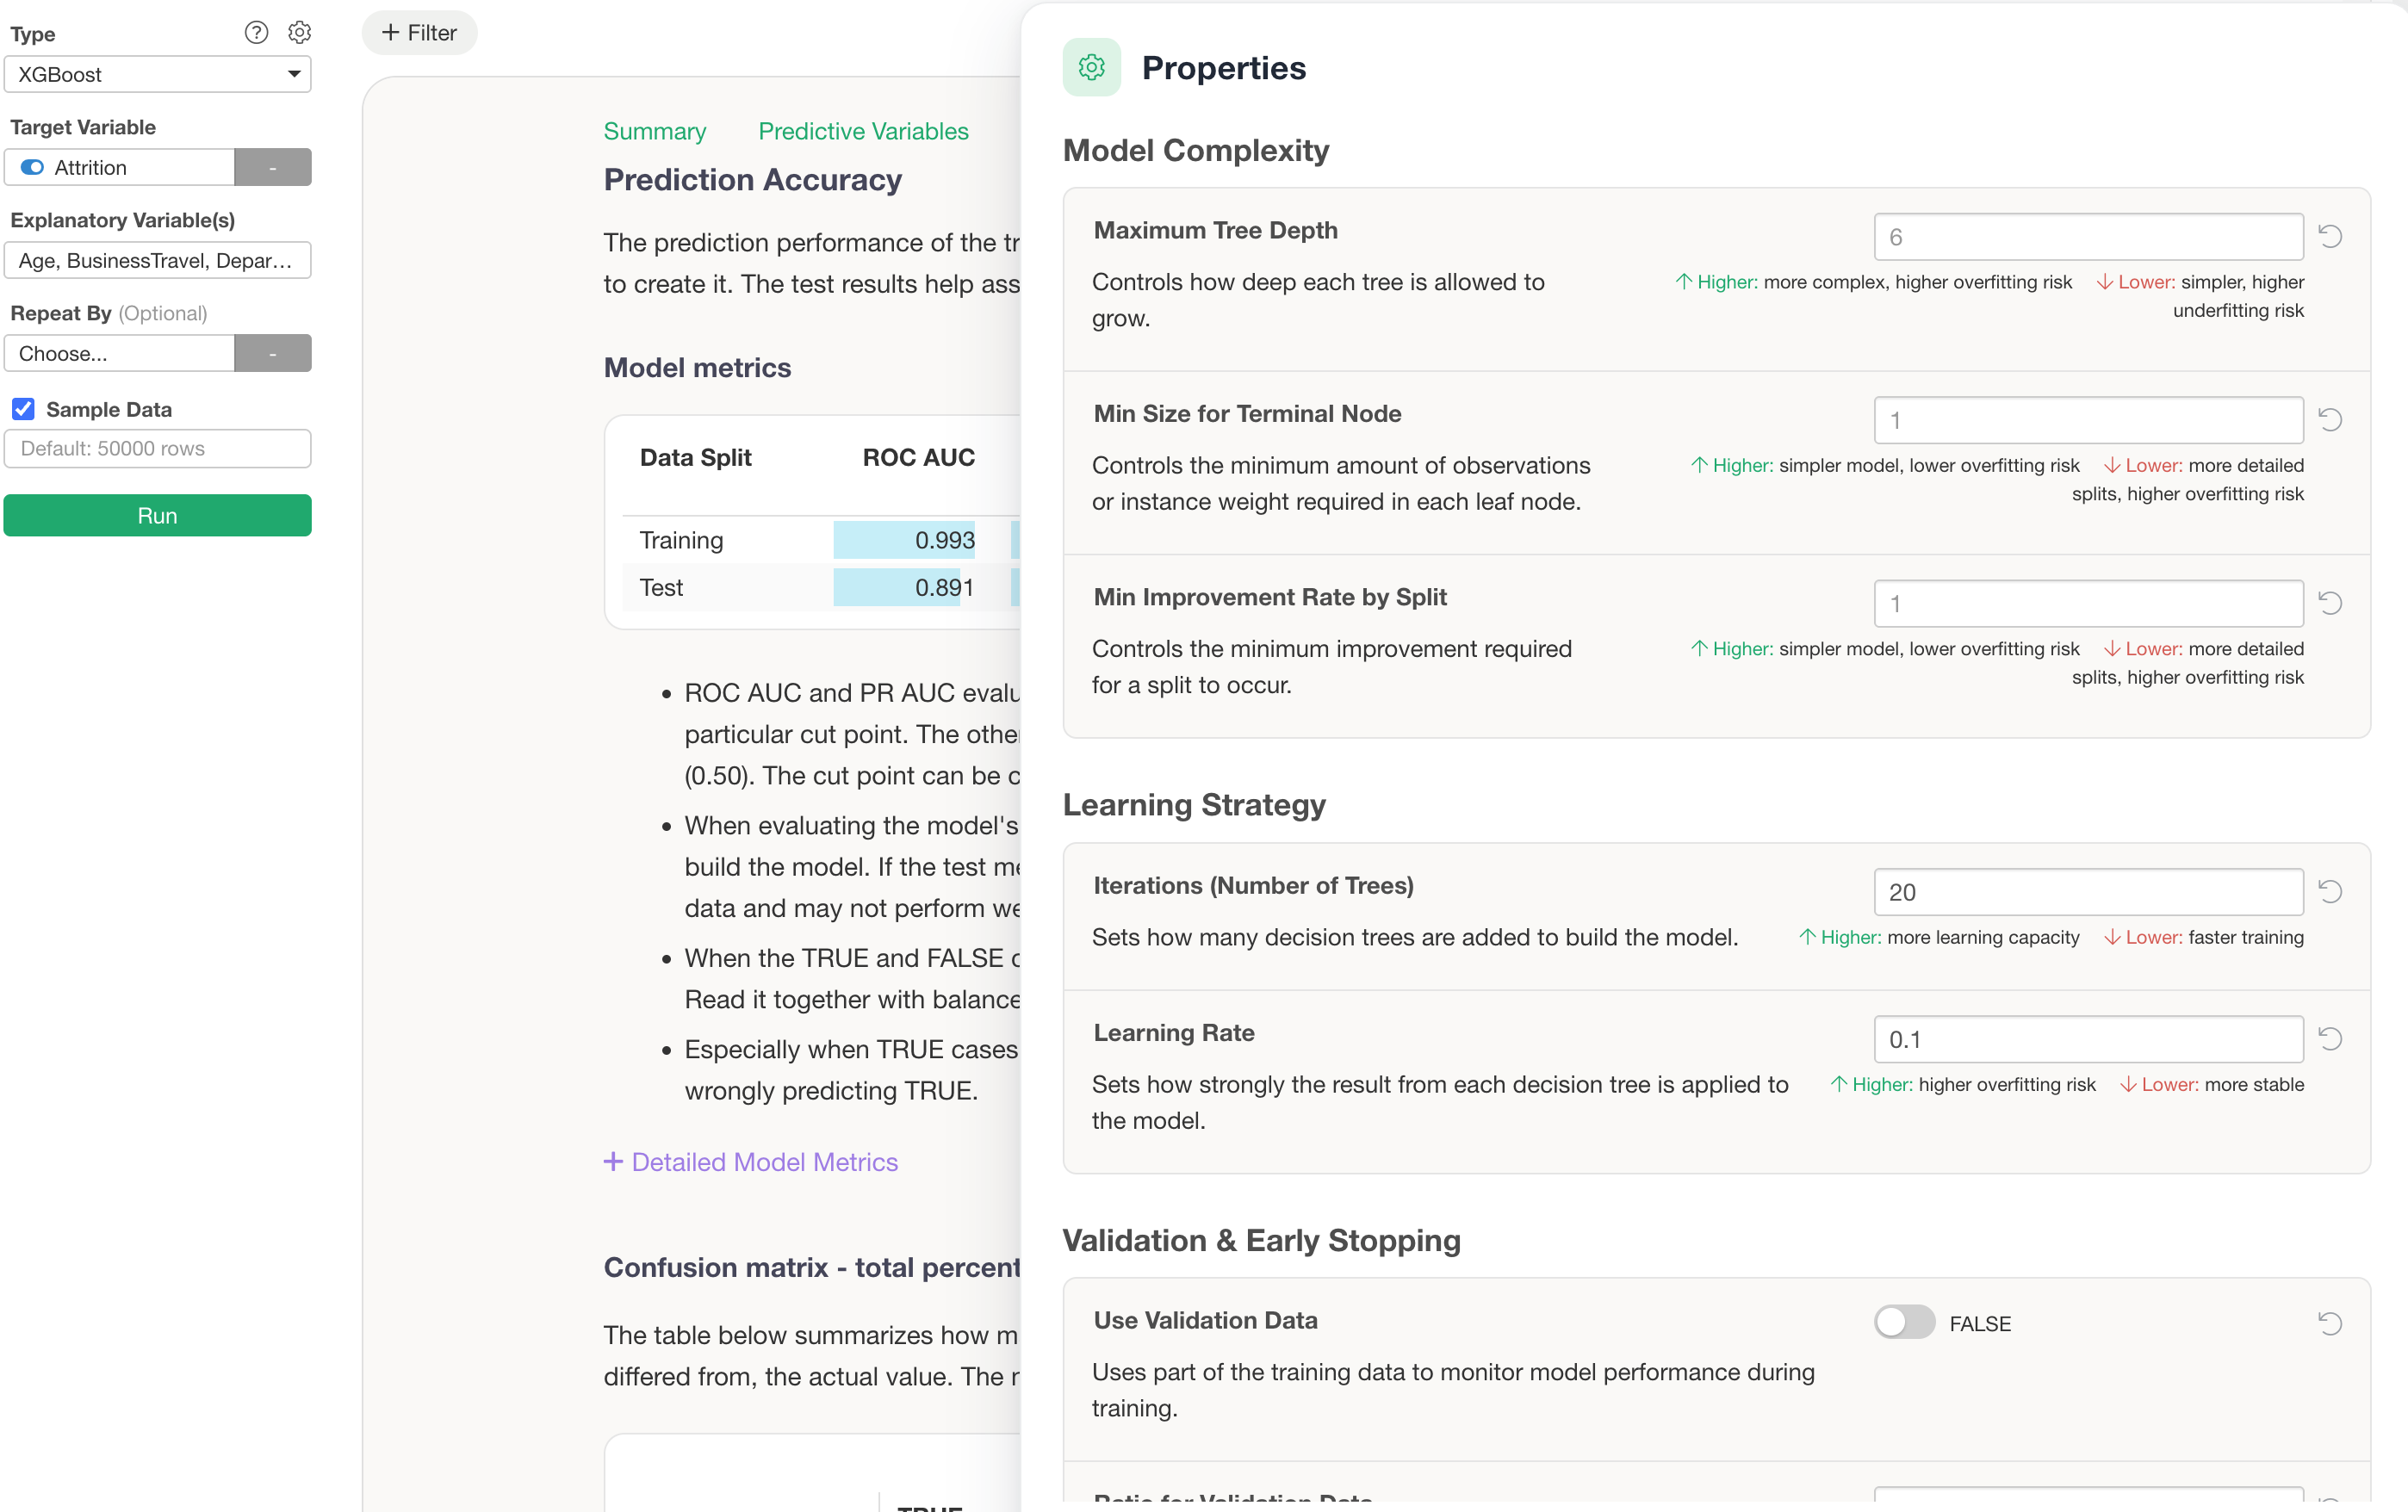
Use AI Throughout the Analytics Workflow
Exploratory also integrates AI into the data analysis workflow.
For example, you can describe the data you want in natural language, and AI can determine how to access it, generate the necessary R script, and retrieve the data.
AI can also be used for tasks such as classifying and analyzing text data, which would otherwise require substantial manual effort.
The important distinction is that AI does not exist as a separate, isolated feature.
Data retrieved or transformed with AI can immediately be used for visualization, statistical analysis, and the rest of the analytics workflow.
Communicate and Share Analysis Results
The goal of data analysis is not simply to perform the analysis itself.
The important part is communicating what you learned so that it can inform decisions and actions.
In Exploratory, you can combine charts and analytical results with written explanations in Notes.
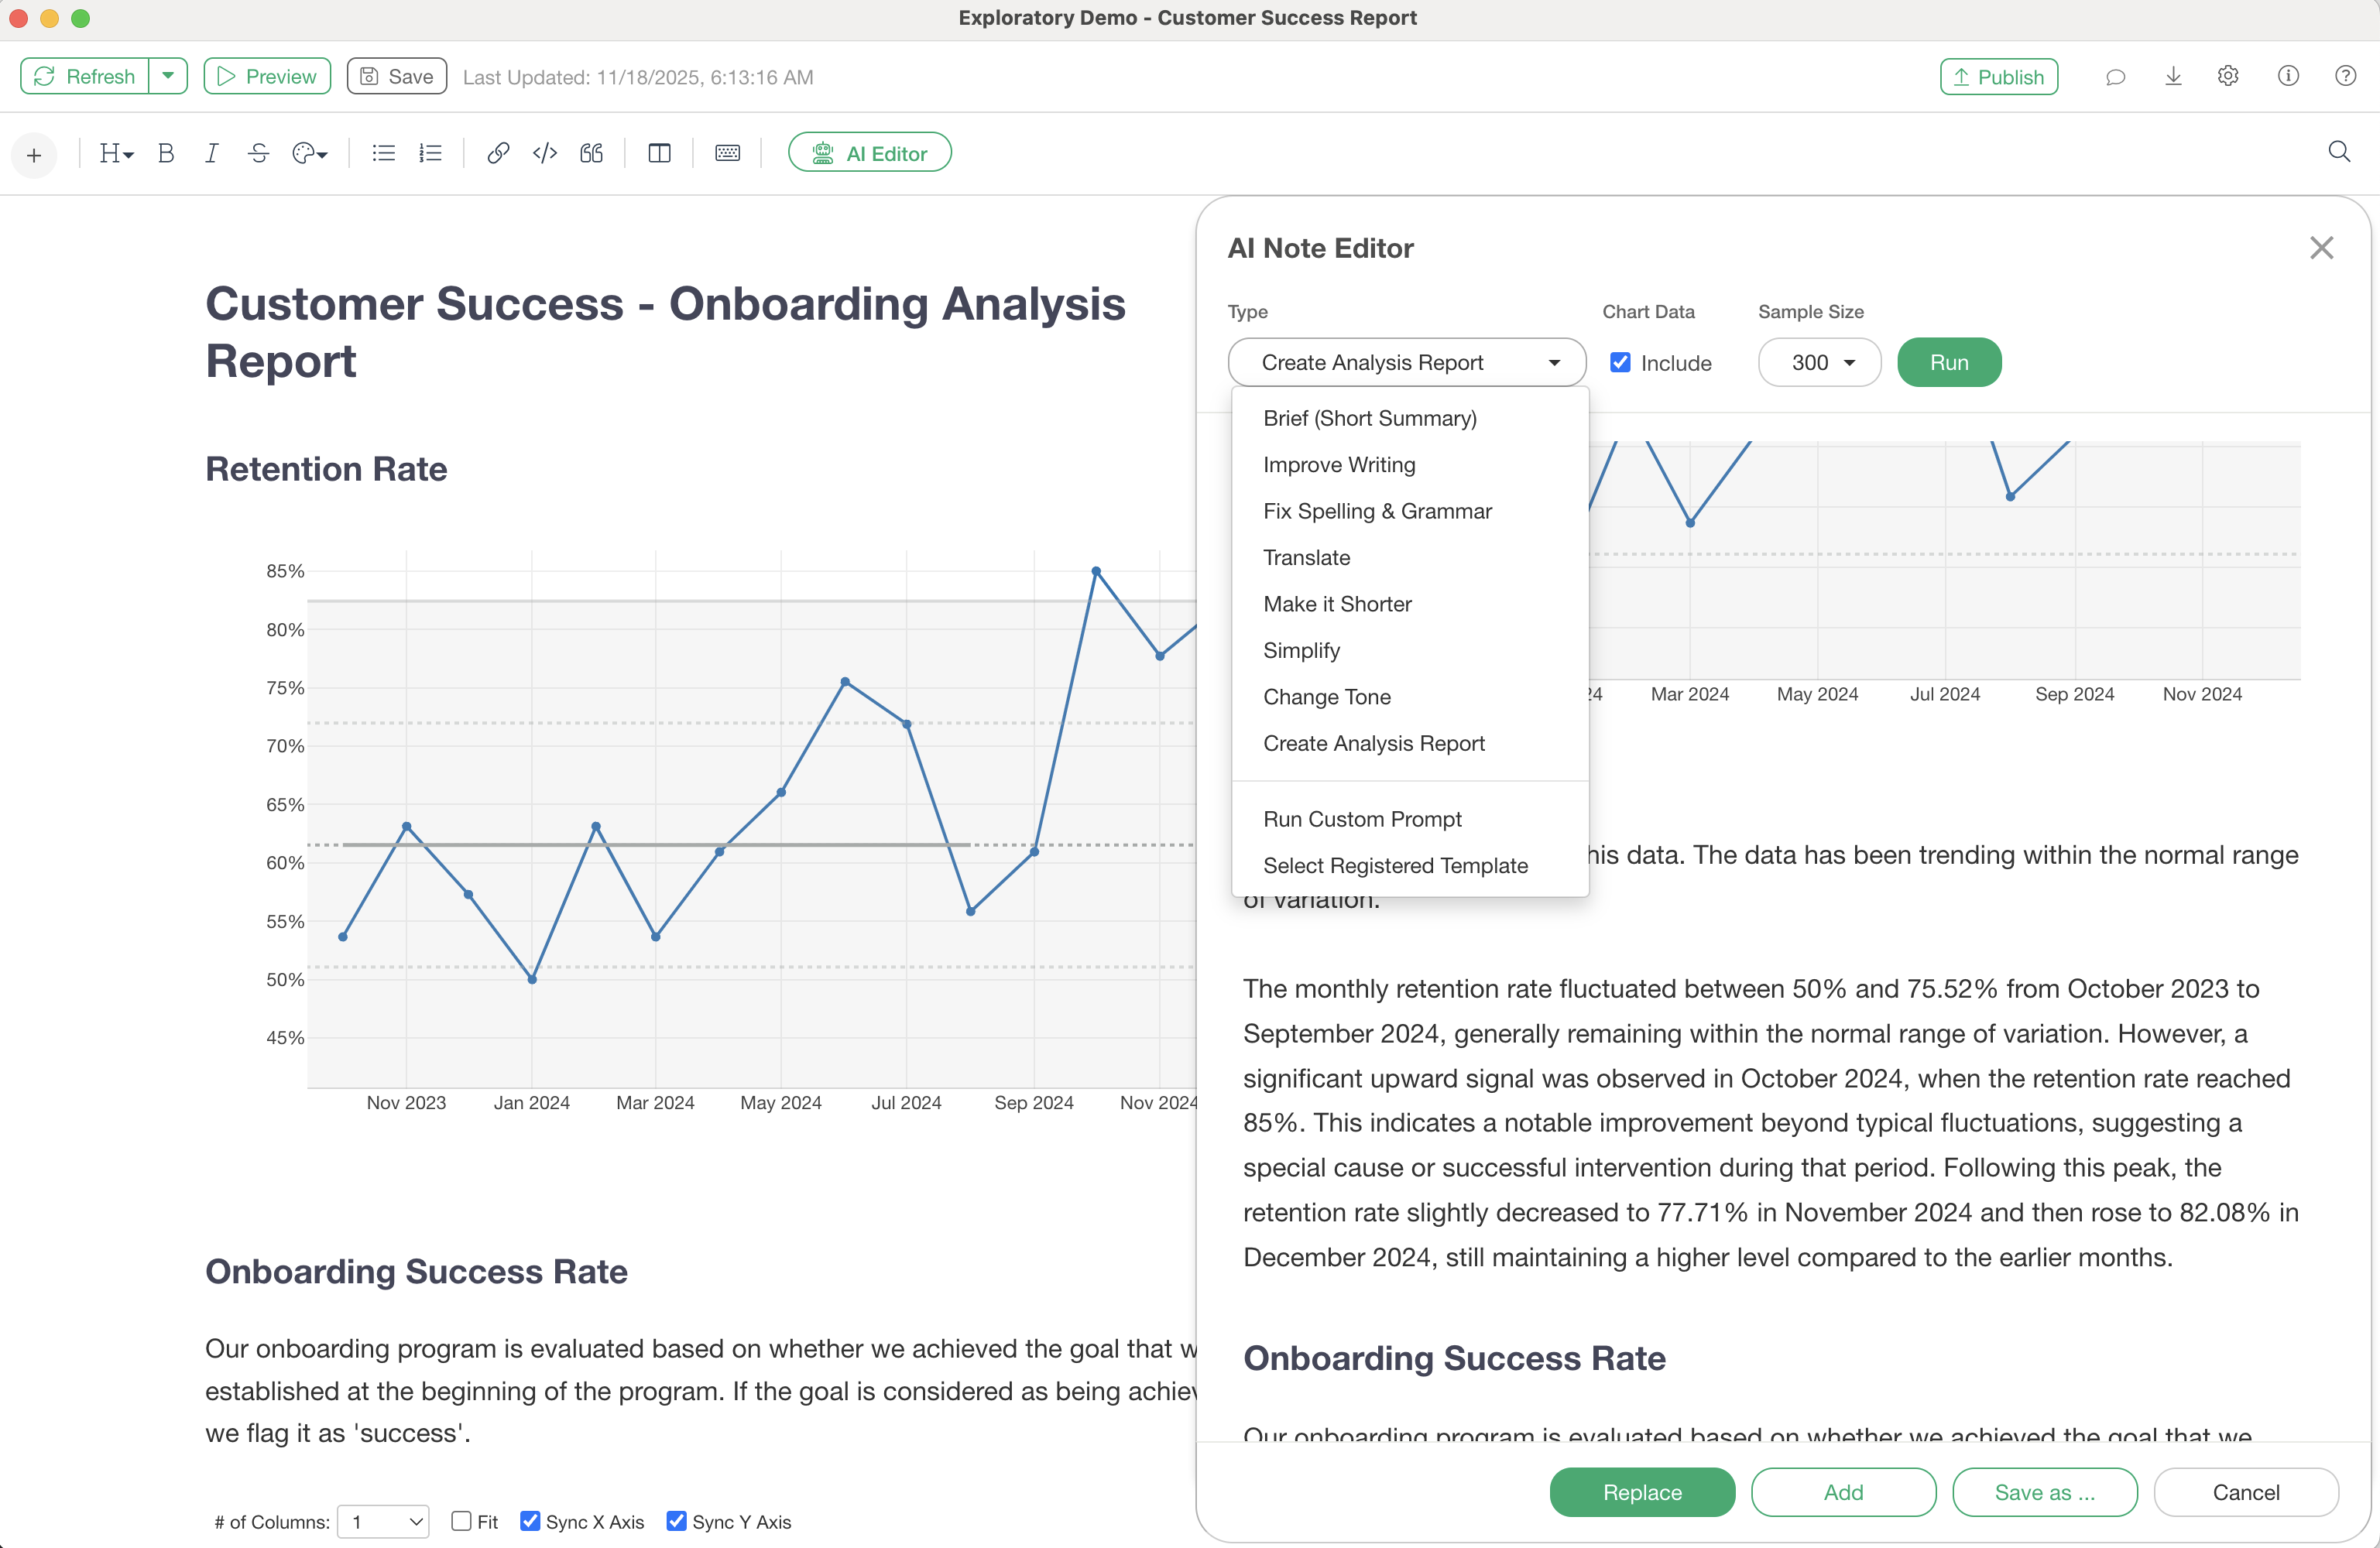
You can also create dashboards for monitoring business metrics and tracking trends over time.
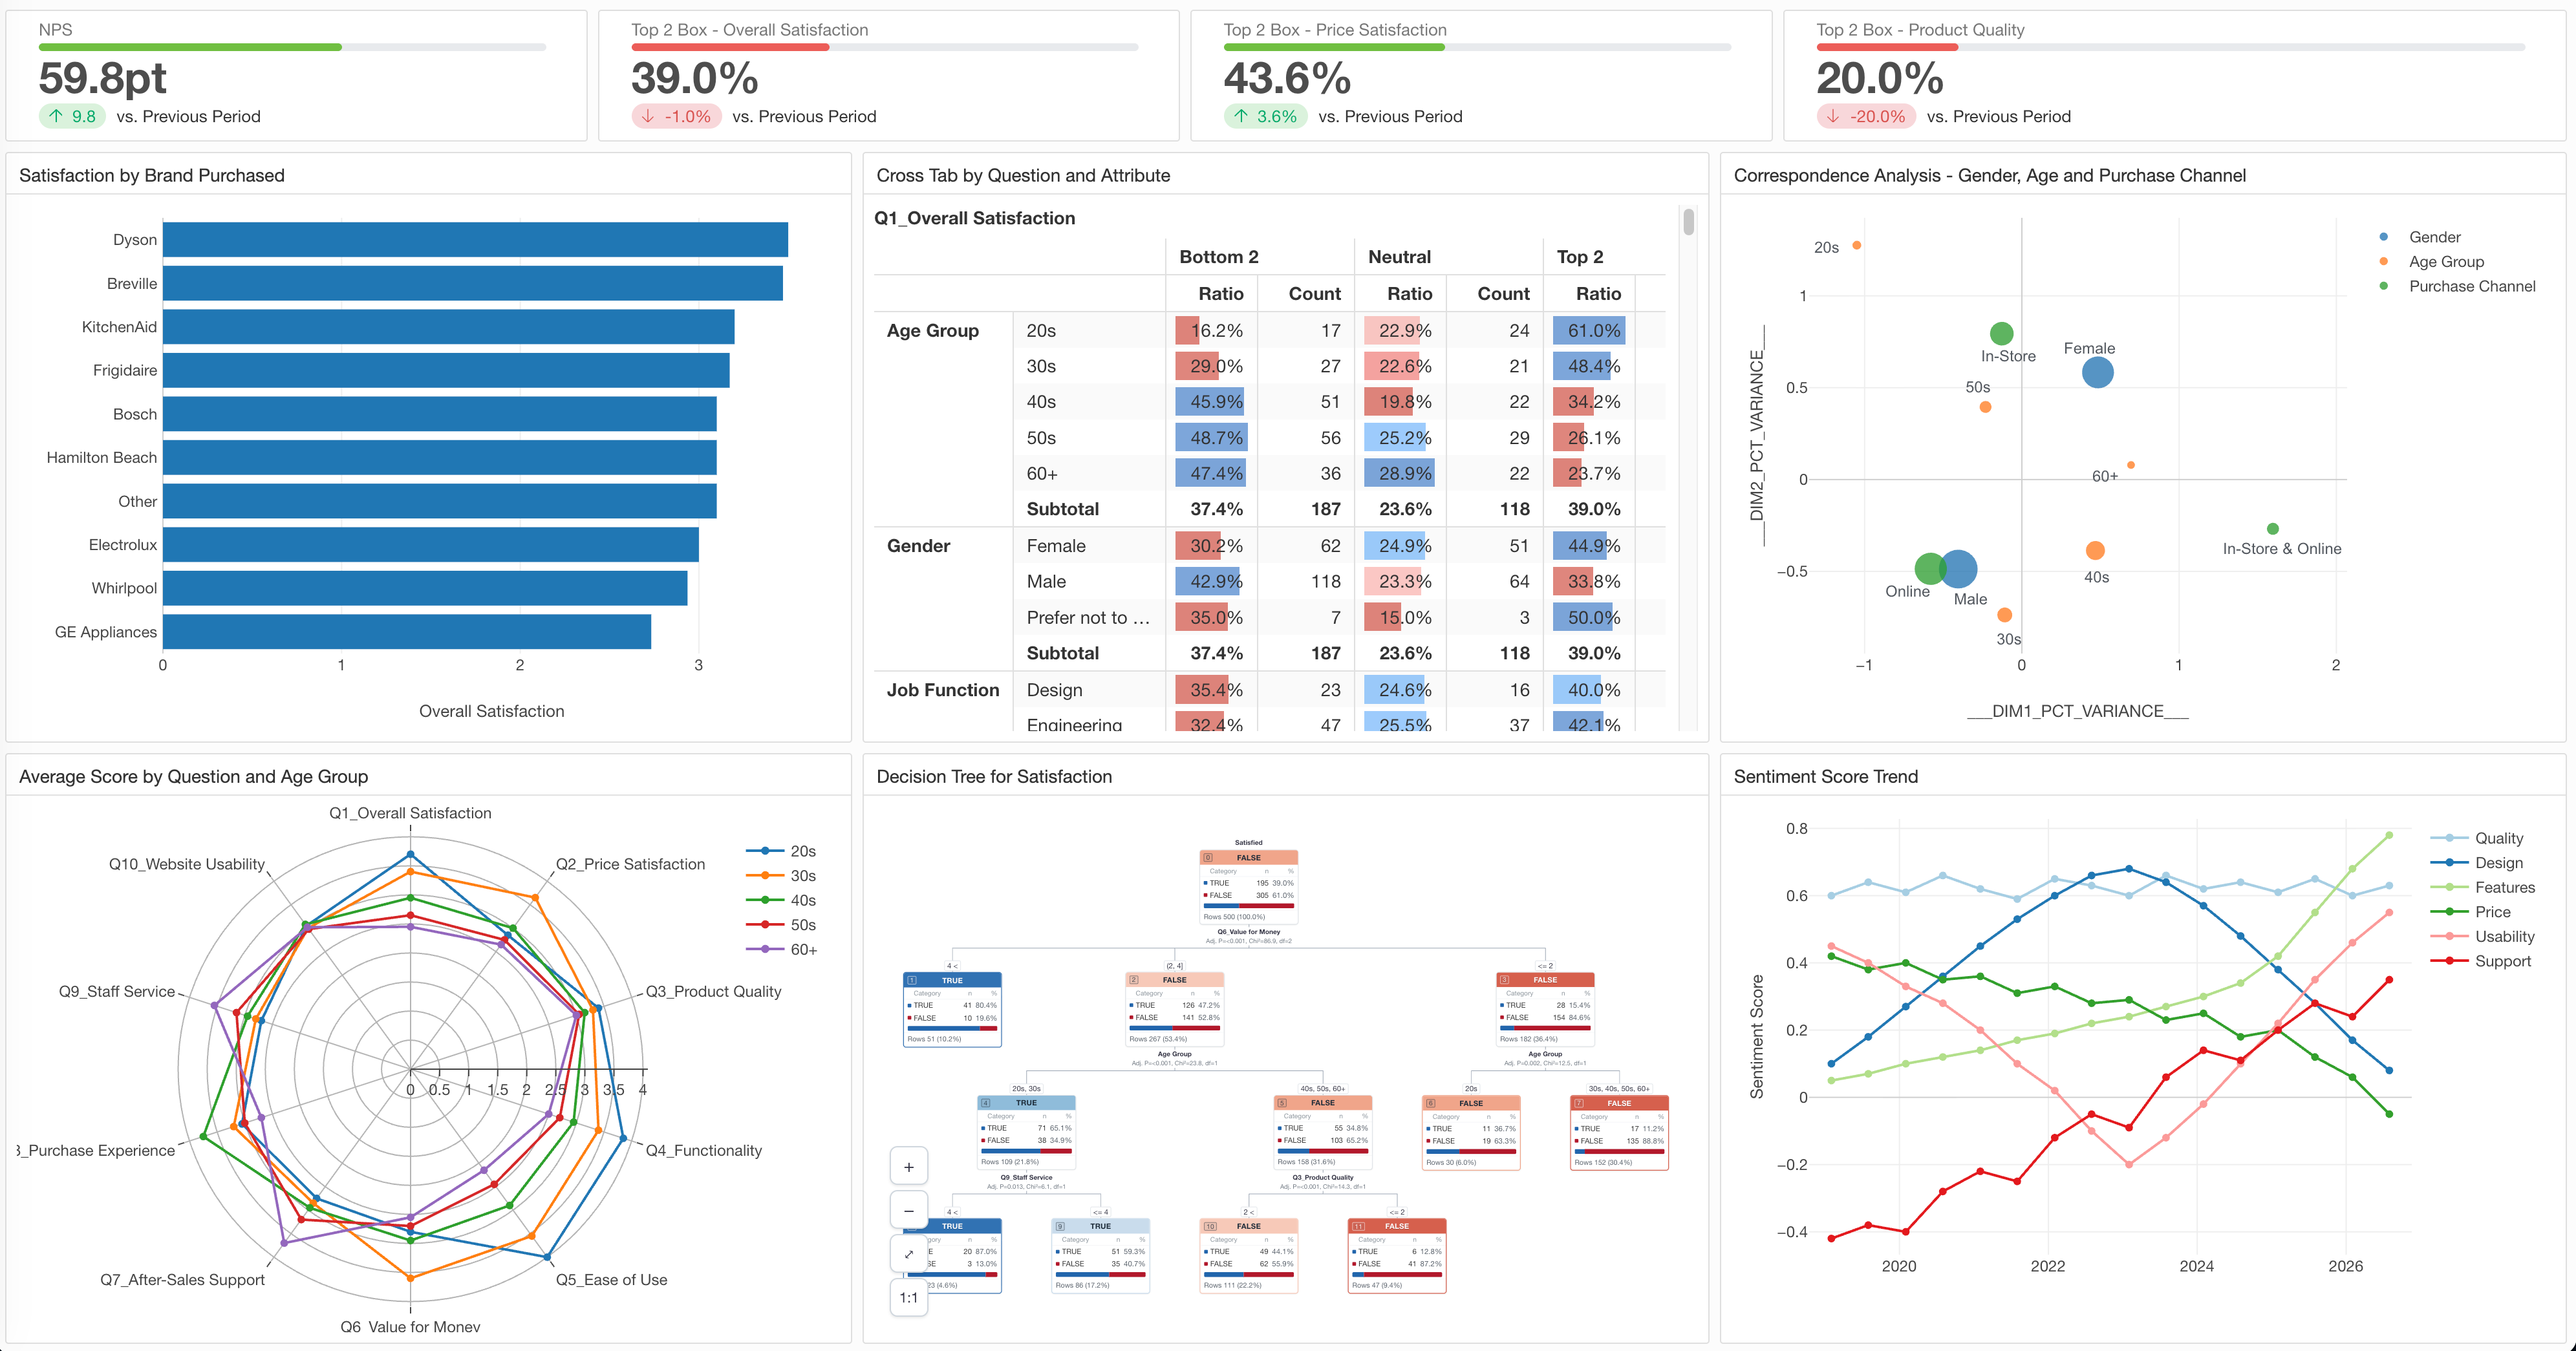
With Exploratory Server, dashboards and Notes created in Exploratory Desktop can be published to the web and shared with others. Data can also be refreshed on a schedule so that published results stay up to date.
People viewing the results can interact with charts and use parameters to explore the data more deeply.
This makes it possible to create an environment where not only the analyst, but everyone who needs the information, can access and explore the latest analytical results.
Who Is Exploratory For?
Exploratory is not designed only for professional data scientists.
Its primary goal is to help analysts and business users who make decisions with data perform more advanced analysis themselves.
Data Analysts
A data analyst’s work often includes much more than creating charts.
Before visualization, there may be substantial data preparation. Afterward, there may be statistical analysis, interpretation, and reporting.
When these tasks are split across multiple tools, analysts often need to copy data between systems and repeat the same operations.
Exploratory allows data access, wrangling, exploration, analysis, and sharing to be managed as a single reusable workflow.
This can make recurring analytical work more efficient and reproducible.
Business Analysts
Understanding business problems often requires more than simple aggregation.
Statistical analysis and machine learning can help answer deeper questions about what is driving an outcome and how groups differ.
Writing R or Python code for every analysis, however, may not be practical for many business users, even when AI can help generate the code, because the resulting scripts still need to be managed, maintained, and updated.
Exploratory allows users to perform not only data wrangling and visualization, but also analyses such as regression, clustering, and decision trees through a graphical interface.
This enables business users who are not programmers to perform deeper data analysis themselves.
Researchers and Survey Analysts
Universities, research organizations, market research teams, HR departments, and many other organizations regularly analyze survey and questionnaire data.
Survey data often has characteristics that differ from typical business data, including:
- Ordinal categories such as 5-point Likert scales
- Multiple-response questions
- Open-ended text responses
- Large numbers of question columns
- Long question text used as column names
Exploratory supports not only the preparation and visualization of this data, but also cross-tabulation, factor analysis, reliability analysis, clustering, ordinal logistic regression, CHAID, and text analysis using AI and topic modeling.
Users Who Want a More Visual Way to Work with R
R is an extremely powerful environment for data wrangling, statistical analysis, and machine learning.
However, because many workflows in R require writing code, some users find the initial learning curve challenging.
Exploratory uses R as its analytics engine while making many of its capabilities accessible through a graphical interface.
It is not intended to replace R.
Rather, Exploratory can be seen as a way to use the R ecosystem through a more visual analytics workflow.
How Does Exploratory Work?
A typical analysis in Exploratory follows this process:
Import data → Wrangle data → Explore data → Analyze data → Communicate results
Instead of performing these tasks in separate tools, Exploratory connects and manages them within the same project.
Visual Analytics Workflow
In Exploratory, data wrangling and analytical operations are built up as a sequence of visible steps.
For example:
- Remove unnecessary rows
- Aggregate data by region
- Calculate sales growth rates
Each of these operations is recorded as an explicit step.
This means you can inspect not only the final result, but also the exact sequence of transformations that produced it.
R as the Analytics Engine
Exploratory runs on top of the open-source R environment.
For data wrangling, it takes advantage of the R ecosystem, including tidyverse. Statistical analysis and machine learning also use well-established analytical methods and R packages.
In other words, Exploratory is not built around a proprietary statistical engine created from scratch.
It is a platform that makes R’s analytical capabilities accessible through a graphical interface.
Reproducible Analysis
When analysis is performed manually in a spreadsheet, repeating the same process next month or next year can require repeating many of the same steps by hand.
Exploratory saves the transformation and analysis steps themselves.
When the underlying data changes, the same workflow can be executed again.
This is particularly useful for analysis that needs to be repeated weekly, monthly, quarterly, or annually.
Beyond saving time, it reduces the risk of performing different operations each time and improves the reproducibility of the analysis.
What Makes Exploratory Different from Other Data Analysis Tools?
Data analysis tools include spreadsheets, BI tools, statistical software, and programming environments.
What distinguishes Exploratory is that it does not focus on only one part of the analytical process.
Instead, it connects multiple stages of data analysis into a single workflow.
Data Wrangling and Analysis in One Place
A typical analytics workflow may involve:
one tool for data preparation,
another for visualization,
and another for statistical analysis.
With Exploratory, data wrangling, visualization, statistical analysis, and machine learning can all be performed on the same data within the same workflow.
If you need to change the data preparation or move from visualization to statistical analysis, you do not need to export the data and transfer it to another tool.
Advanced Analytics Through a Graphical Interface
Performing advanced analytics does not necessarily require writing R or Python code from scratch.
Many statistical and machine learning methods in Exploratory can be configured through the graphical interface.
At the same time, because R runs underneath Exploratory, users can take advantage of R when more advanced customization is required.
In other words, one of Exploratory’s key characteristics is that it combines:
an accessible graphical interface with the analytical power of R.
Built on the Open R Ecosystem
Exploratory is based on R.
This means more than simply saying that the product is implemented using R.
It means Exploratory can take advantage of the statistical methods and data processing packages that have been developed over many years by researchers, statisticians, and data scientists in the R community.
The R ecosystem also makes it possible to incorporate new analytical methods into Exploratory over time.
Reusable Analytics
Exploratory saves not just the final results, but also the data wrangling and analytical steps that produced them.
For example, when producing the same report every month, the next month’s data can be imported and the existing workflow rerun.
This is fundamentally different from manually repeating the same sequence of spreadsheet operations each time.
From Exploration to Sharing
Exploratory connects data exploration, statistical analysis, communication, and sharing.
You can explore your data, perform statistical analysis, combine the results with charts and written explanations, and share them with others.
This helps bridge the gap between the person performing the analysis and the people using the results to make decisions.
Analyze Data While Keeping It on Your Local Computer
Data imported into Exploratory Desktop remains on the user’s local computer unless the user explicitly publishes it to Exploratory Server.
This means data wrangling, visualization, statistical analysis, and machine learning can be performed without requiring the data to first be uploaded to the cloud.
How Does Exploratory Handle Data Securely?
With Exploratory Desktop, imported data is stored on the local computer.
Simply using Exploratory to wrangle, visualize, or analyze data does not automatically upload that data to the Exploratory cloud.
Unless the user explicitly publishes data or analytical content to Exploratory Server, the data remains on the computer being used.
This allows users to begin working with sensitive business data, customer data, or research data within their local environment.
Analyze Data Locally
Data imported into Exploratory Desktop is stored on the user’s local computer.
Data wrangling, chart creation, statistical analysis, and machine learning can all be performed in Desktop.
Unlike cloud-based analytics services that require data to be uploaded to an external server before analysis can begin, Exploratory Desktop can perform these operations locally.
This can be particularly important when working with confidential corporate data or data that is subject to restrictions on external transfer.
Publish to the Server Only When Needed
When users want to share analytical results, publish dashboards on the web, or schedule data updates, they can explicitly publish content to Exploratory Server.
In other words, analyzing data in Desktop and publishing or sharing data through Server are separate actions.
Users control what they choose to publish to the server.
What Types of Data Can You Analyze with Exploratory?
Exploratory is not limited to one industry or one type of data.
It can be used with many different kinds of data.
Business and Operational Data
Examples include:
- Sales
- Marketing
- Customer
- Product
- Web traffic
- Operational performance
- Financial data
You can analyze trends over time, segment customers or products into groups, and identify factors associated with business outcomes.
Survey and Questionnaire Data
Survey data analysis is one of the areas Exploratory places particular emphasis on.
Survey datasets often include:
- Ordinal categories such as 5-point rating scales
- Multiple-response questions
- Top 2 Box / Bottom 2 Box calculations
- Open-ended responses
- Large numbers of question columns
Exploratory can prepare and transform this data, create cross-tabulations and visualizations, and use methods such as factor analysis, reliability analysis, clustering, CHAID, and ordinal logistic regression to investigate the structures and factors behind survey responses.
Time Series Data
Exploratory can analyze data that changes over time, such as sales, website traffic, and user counts.
In addition to visualizing trends, you can analyze seasonality, change points, and forecasts.
Text Data
Exploratory can also analyze text data such as open-ended survey responses, customer comments, and support inquiries.
In addition to examining word frequencies, AI can be used to classify text and analyze sentiment and themes.
Common Use Cases for Exploratory
Exploratory is used for a wide range of analytical challenges across industries and organizations.
Survey Data Analysis
Survey analysis often needs to go beyond answering:
“What responses were most common?”
You may also want to understand:
- Which groups have different response patterns?
- What factors are associated with satisfaction?
- What types of respondents exist within the data?
Exploratory allows users to move from basic aggregation to deeper analysis using cross-tabulation, statistical tests, factor analysis, clustering, CHAID, regression analysis, and other techniques.
Customer and Marketing Analytics
Customer data can be used to:
- Understand customer segments
- Identify factors associated with purchases or churn
- Compare the impact of marketing initiatives
- Analyze brand perception and customer attitudes
HR and People Analytics
In HR, Exploratory can be used to analyze topics such as:
- Employee engagement
- Turnover
- Employee development
- Differences across organizations or departments
- The impact of managers or workplace conditions
For example, rather than simply comparing average employee engagement scores, you can statistically analyze which factors are most strongly associated with engagement.
Institutional Research and Education Analytics
Institutional research teams in universities often need to continuously analyze data from multiple systems, including student records, admissions, courses, grades, and surveys.
Because many of the same data preparation and aggregation tasks need to be repeated every year, Exploratory’s reusable data wrangling steps can be particularly useful.
Business Performance and KPI Analysis
Exploratory can be used to regularly analyze company KPIs and business performance and share the results through dashboards.
Instead of rebuilding a report from scratch every time the data changes, existing workflows can be rerun to produce updated results.
Statistical Modeling and Research
Exploratory can also be used for research and analytical projects that require more advanced statistical methods such as regression, factor analysis, and clustering.
It can be especially useful for users who want access to R’s analytical capabilities without writing every part of their daily analysis as code.
How Is Exploratory Different from Other Analytics Tools?
Exploratory overlaps with some of the capabilities found in Excel, Tableau, Power BI, SPSS, and R.
However, each of these tools has a different primary focus.
Exploratory vs. Excel
Excel is extremely useful for spreadsheets, lightweight aggregation, calculations, and manually inspecting data.
As datasets grow larger, transformations become more complex, or advanced statistical analysis becomes necessary, managing repeated manual operations can become more difficult.
Exploratory saves data transformation operations as reusable steps and connects them directly with visualization and analysis.
This makes Exploratory well suited for recurring analysis and workflows that involve multiple transformations and analytical steps.
Exploratory vs. Tableau and Power BI
Tableau and Power BI are strong BI platforms for visualizing business data and distributing dashboards.
Exploratory can also create charts and dashboards, but one of its major differences is its emphasis on the data wrangling and statistical analysis that happen before and after visualization.
For example, rather than only showing that:
“Sales are declining,”
Exploratory can also help investigate questions such as:
“What factors are associated with the decline in sales?”
or:
“What types of customer segments exist in the data?”
using statistical analysis and machine learning methods.
Exploratory vs. SPSS
Both SPSS and Exploratory allow users to perform statistical analysis through graphical interfaces.
Exploratory, however, also integrates the work that comes before and after statistical analysis, including data wrangling, exploration, visualization, and sharing, into the same workflow.
Another major distinction is that Exploratory uses R as its analytics engine.
Which product is more appropriate depends on the use case, but Exploratory’s integrated workflow can be particularly useful when statistical analysis is combined with frequent data preparation and exploratory analysis.
Exploratory vs. R / RStudio
R is an extremely flexible and powerful statistical programming environment, and RStudio is one of the most widely used environments for developing and performing analysis with R.
Exploratory uses the same R ecosystem.
The major difference is the interface.
RStudio primarily involves writing code, while Exploratory allows many analytics workflows to be built through a graphical interface.
For users who:
want the analytical capabilities of R but do not want to express every part of their everyday analysis as code,
Exploratory provides another way to work with the R ecosystem.
Do You Need to Know R to Use Exploratory?
No. You do not need to know R to perform common data wrangling, visualization, statistical analysis, or machine learning tasks in Exploratory.
Most operations can be performed through the graphical interface.
For example, filtering data, aggregating, joining datasets, creating charts, running regression models, and performing clustering can all be configured primarily through the UI.
At the same time, R runs behind Exploratory.
If you need more advanced customization, you can also use R scripts and R packages.
This means you can get started without knowing R while still having access to the broader R ecosystem when you need it.
Is Exploratory a BI Tool, a Statistical Tool, or a Data Science Platform?
Exploratory has capabilities that overlap with BI tools, statistical software, and data science tools.
However, the closest description is a data science platform.
That is because Exploratory is not designed only for visualization or only for statistical analysis.
It manages the full workflow of:
Data access
↓
Data wrangling
↓
Exploration and visualization
↓
Statistical analysis and machine learning
↓
Communicating and sharing results
within a single environment.
Exploratory is particularly focused on enabling not only professional data scientists, but also analysts and business users to apply data science techniques in their everyday work.
In that sense, Exploratory can be described as:
an R-based data science platform for analysts and business users.
A Typical Analytics Workflow in Exploratory
Suppose you want to analyze an employee engagement survey.
1. Import the Data
Import the survey response data from an Excel or CSV file into Exploratory.
2. Prepare the Data
Remove unnecessary columns, define the correct category order for survey questions, and prepare multiple-response questions and missing values for analysis.
If necessary, join the survey data with another dataset such as an HR employee master table.
3. Explore the Data
Examine the response distribution for each question and compare patterns across attributes such as department, age group, and tenure.
4. Analyze the Data More Deeply
Use statistical tests to evaluate differences between groups or regression analysis to investigate factors associated with employee engagement.
You can also use clustering to identify groups of employees with similar response patterns.
Frequently Asked Questions About Exploratory
What is Exploratory used for?
Exploratory is a data science platform for data access, data wrangling, visualization, statistical analysis, machine learning, AI-assisted analysis, and sharing analytical results.
It is particularly useful for analysts and business users who frequently perform data preparation and statistical analysis.
Who uses Exploratory?
Exploratory can be used by data analysts, business analysts, researchers, market researchers, HR professionals, institutional research teams, and many others who analyze data as part of their work or research.
I work with confidential data. Can I analyze it securely with Exploratory?
Yes.
Data imported into Exploratory Desktop is stored on the local computer unless the user explicitly publishes it to Exploratory Server.
This allows users to perform data wrangling, visualization, and statistical analysis without requiring the data to first be uploaded to the cloud.
If analytical results are published to Exploratory Server for sharing or scheduled updates, they can be shared privately with selected members. Data stored on the server is also encrypted at rest.
Is Exploratory a no-code tool?
Many data wrangling, visualization, statistical analysis, and machine learning tasks in Exploratory can be performed through the graphical interface, so users do not generally need to write code for common analyses.
However, because Exploratory uses R as its analytics engine, users can also use R code and R packages when necessary.
Rather than being a product that completely eliminates code, Exploratory is better described as an environment where you can perform much of your analysis without writing code while still having access to R when you need it.
Does Exploratory use R?
Yes.
Exploratory uses R as its analytics engine.
It takes advantage of the R ecosystem for data wrangling, statistical analysis, and machine learning while making those capabilities accessible through a graphical interface.
Can Exploratory analyze survey data?
Yes.
Exploratory supports many analytical tasks commonly required for survey data, including cross-tabulation, multiple-response questions, ordinal categories such as 5-point Likert scales, factor analysis, reliability analysis, clustering, CHAID, and ordinal logistic regression.
Can Exploratory perform statistical analysis?
Yes.
Exploratory supports a wide range of statistical methods, including hypothesis testing, correlation analysis, regression analysis, logistic regression, factor analysis, principal component analysis, clustering, survival analysis, and time series analysis.
Can Exploratory be used for machine learning?
Yes.
Exploratory supports machine learning techniques for prediction and segmentation, including regression, classification, clustering, and decision trees.
How is Exploratory different from Excel?
Excel is well suited for spreadsheets, calculations, and quickly inspecting data.
Exploratory focuses on saving complex data preparation operations as reusable steps and connecting those steps with visualization, statistical analysis, and machine learning in a repeatable analytics workflow.
How is Exploratory different from SPSS?
Both Exploratory and SPSS allow statistical analysis through graphical interfaces.
Exploratory additionally integrates data wrangling, exploration, visualization, statistical analysis, and sharing within the same workflow, and it uses R as its analytics engine.
Can Exploratory be used by teams and organizations?
Yes.
Analytical content created in Exploratory Desktop can be published to Exploratory Server, where charts, dashboards, Notes, and other analytical results can be shared across teams and organizations.
Get Started with Exploratory
The purpose of data analysis is not simply to use analytical tools.
What matters is understanding the data, discovering new questions, and finding insights that can inform better decisions.
Exploratory brings together the work required for data preparation, analysis, and communication into a single workflow so that more analysts and business users can explore data deeply on their own.
You can begin by importing your own data, preparing it, and visualizing it.
From there, you can go deeper with statistical analysis, machine learning, and AI as needed.