How to Choose Survey Data Analysis Software in 2026: Excel vs. BI vs. SPSS vs. R vs. Exploratory

When you need to analyze survey data, the first tools that come to mind are probably Excel or the built-in reports in survey platforms like Google Forms.
And honestly, if all you need is to count responses, calculate percentages, and make a few simple charts, those tools are often enough.
But as you keep doing survey analysis in real work, new challenges start to show up:
How should I handle multiple-response (“select all that apply”) questions?
How should I summarize 5-point rating scales?
I want to cross-tabulate results by age group and gender.
I need Top2Box and Bottom2Box scores.
I need to weight the data to correct for sample bias.
I want to know whether a difference I see is real or just chance.
I want to know what drives satisfaction.
I want to group respondents into distinct types.
I want to use AI to categorize open-ended responses.
I want to reuse the same analysis in the next survey wave.
At that point, “Can it make nice looking charts?” or “Does it have pivot tables?” is no longer enough to choose a survey analysis tool.
What matters is deciding up front which parts of your survey analysis you want the tool to handle.
In this article, I’ll lay out the key criteria for choosing survey data analysis software, then look at what Excel, BI tools, SPSS, R / Python, and Exploratory are each best suited for.
Disclosure: I’m the CEO of Exploratory, the company that makes Exploratory. To keep this comparison as fair as possible, I’ve also included cases where Exploratory is not the right fit.
The Short Answer: Recommendations by Use Case
Here’s the bottom line up front:
If you just need quick frequency counts, Excel or your survey platform’s built-in reports are enough.
If you want to share results widely across your organization as dashboards, BI tools such as Tableau or Power BI are a good fit.
If you want to run statistical analysis through a GUI, SPSS or Exploratory are sensible choices.
If you want maximum freedom to analyze and automate with code, R / Python are the most flexible.
If you want data prep, topline and cross-tab tables, statistical analysis, AI-powered open-ended analysis, and reporting in one reproducible workflow—without writing code, Exploratory is a strong fit.
Start by Deciding How Deep You Need to Go
“Survey analysis” covers a wide range of depth. Start by clarifying how far your team actually needs to go.
Level 1 — Frequencies and Charts

The most basic level is tallying responses to see overall trends: how many people chose each option, response percentages, averages, bar charts, pie charts, and so on.
For example, for the question “How satisfied are you with this product?”:
Very satisfied: 24%
Satisfied: 41%
Neutral: 20%
Dissatisfied: 10%
Very dissatisfied: 5%
If you only need to look at a distribution like this, your survey platform’s built-in reports or Excel may be all you need.
If your goal is simply “get a sense of the overall picture first,” this level of functionality is enough.
Level 2 — Topline Tables and Cross-Tabulation
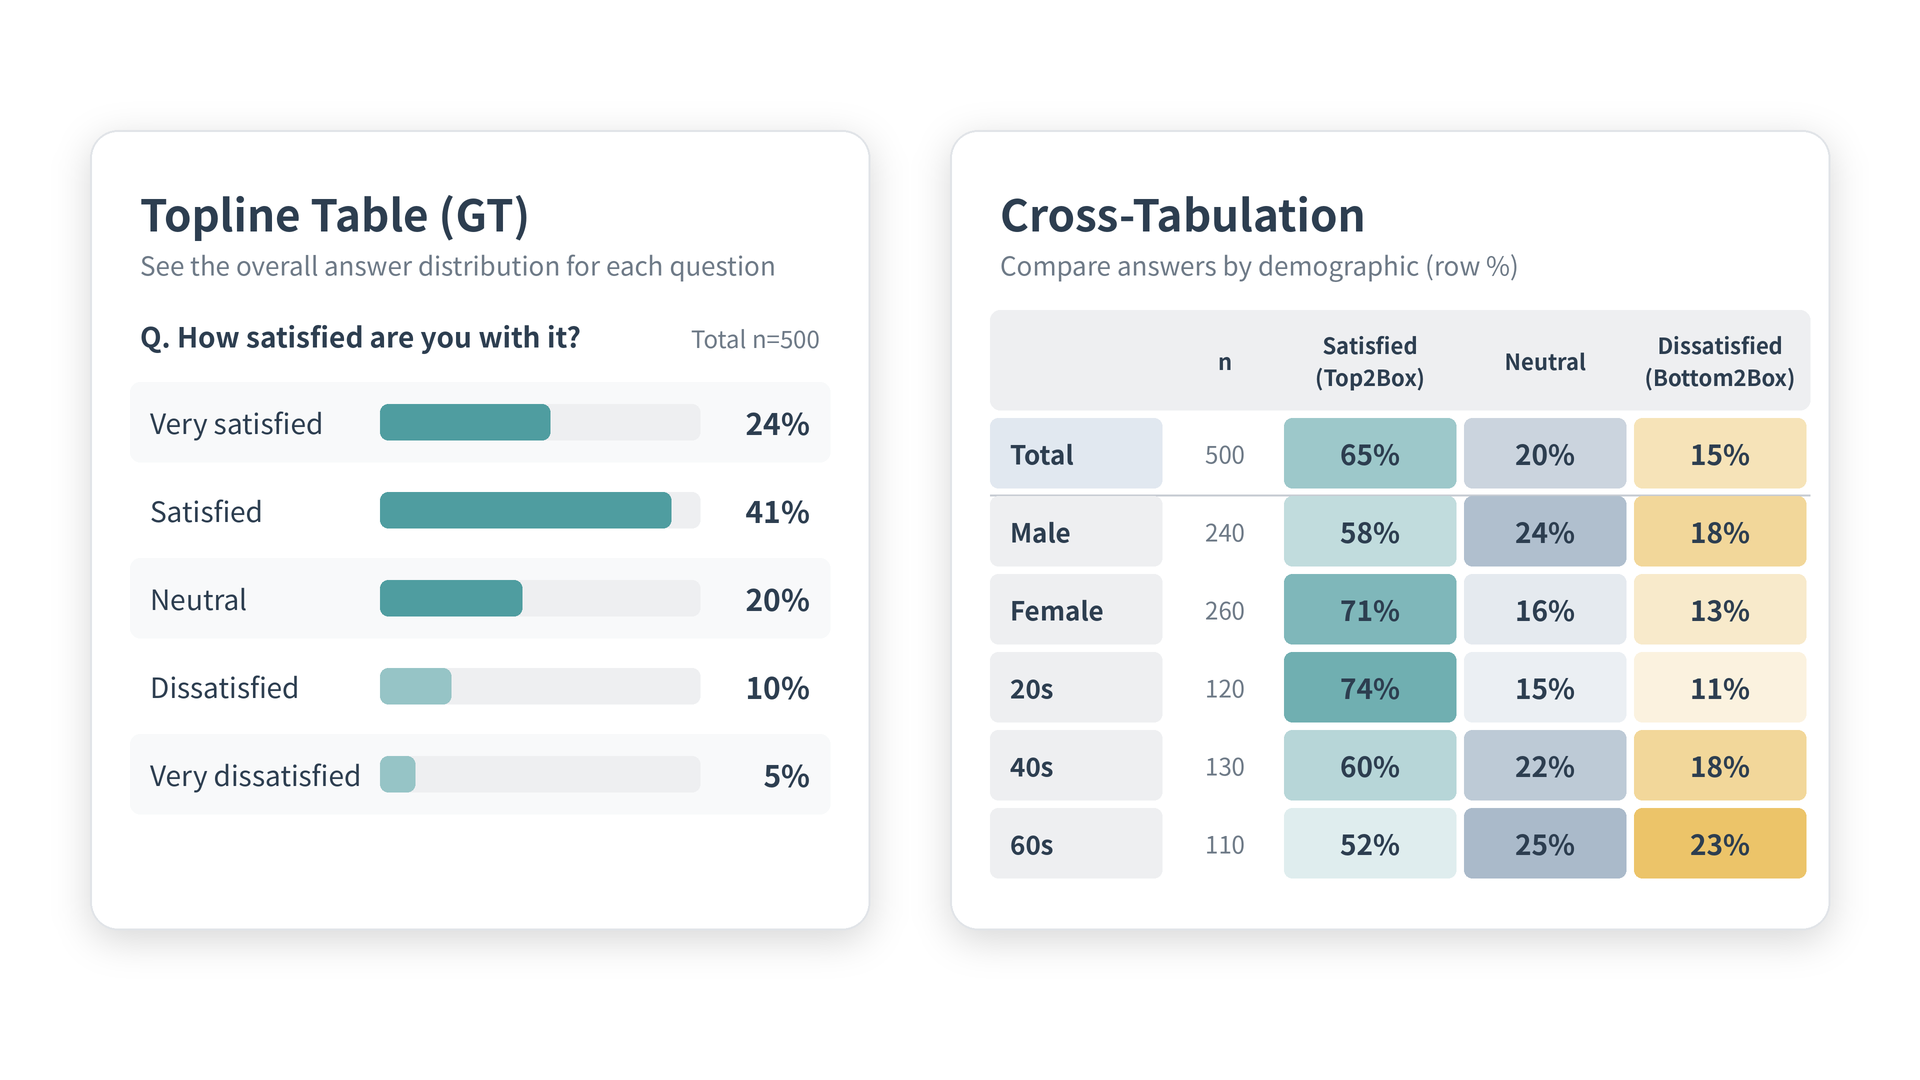
Next comes comparing answers across respondent demographics or other questions.
For example:
“Does satisfaction differ between men and women?”
“Does purchase intent differ by age group?”
“Does brand awareness differ by region?”
This is where topline tables and cross-tabulation come in. A topline table (often called a “GT table,” short for Grand Total, in Japanese market research) lists the counts and percentages for every question across all respondents. A cross-tab breaks those results down by attributes such as gender or age group so you can compare them.
Beyond simple counts, you’ll start to need things like:
Counts
Row percentages (row %)
Column percentages (column %)
Percentages of the total (total %)
Base N (the number of respondents used as the denominator)
Top2Box (the combined share of the top two points on a 5-point scale) / Bottom2Box (the bottom two)
Net (e.g., Top2Box minus Bottom2Box)
Multiple-response questions
Weighting (weighted tabulation)
At this stage, ordinary pivot tables and charts are often not enough, because you need to reshape the raw survey data first. Multiple-response data in particular usually has to be transformed into a format that’s easier to tabulate.
Level 3 — Statistically Testing Differences and Relationships
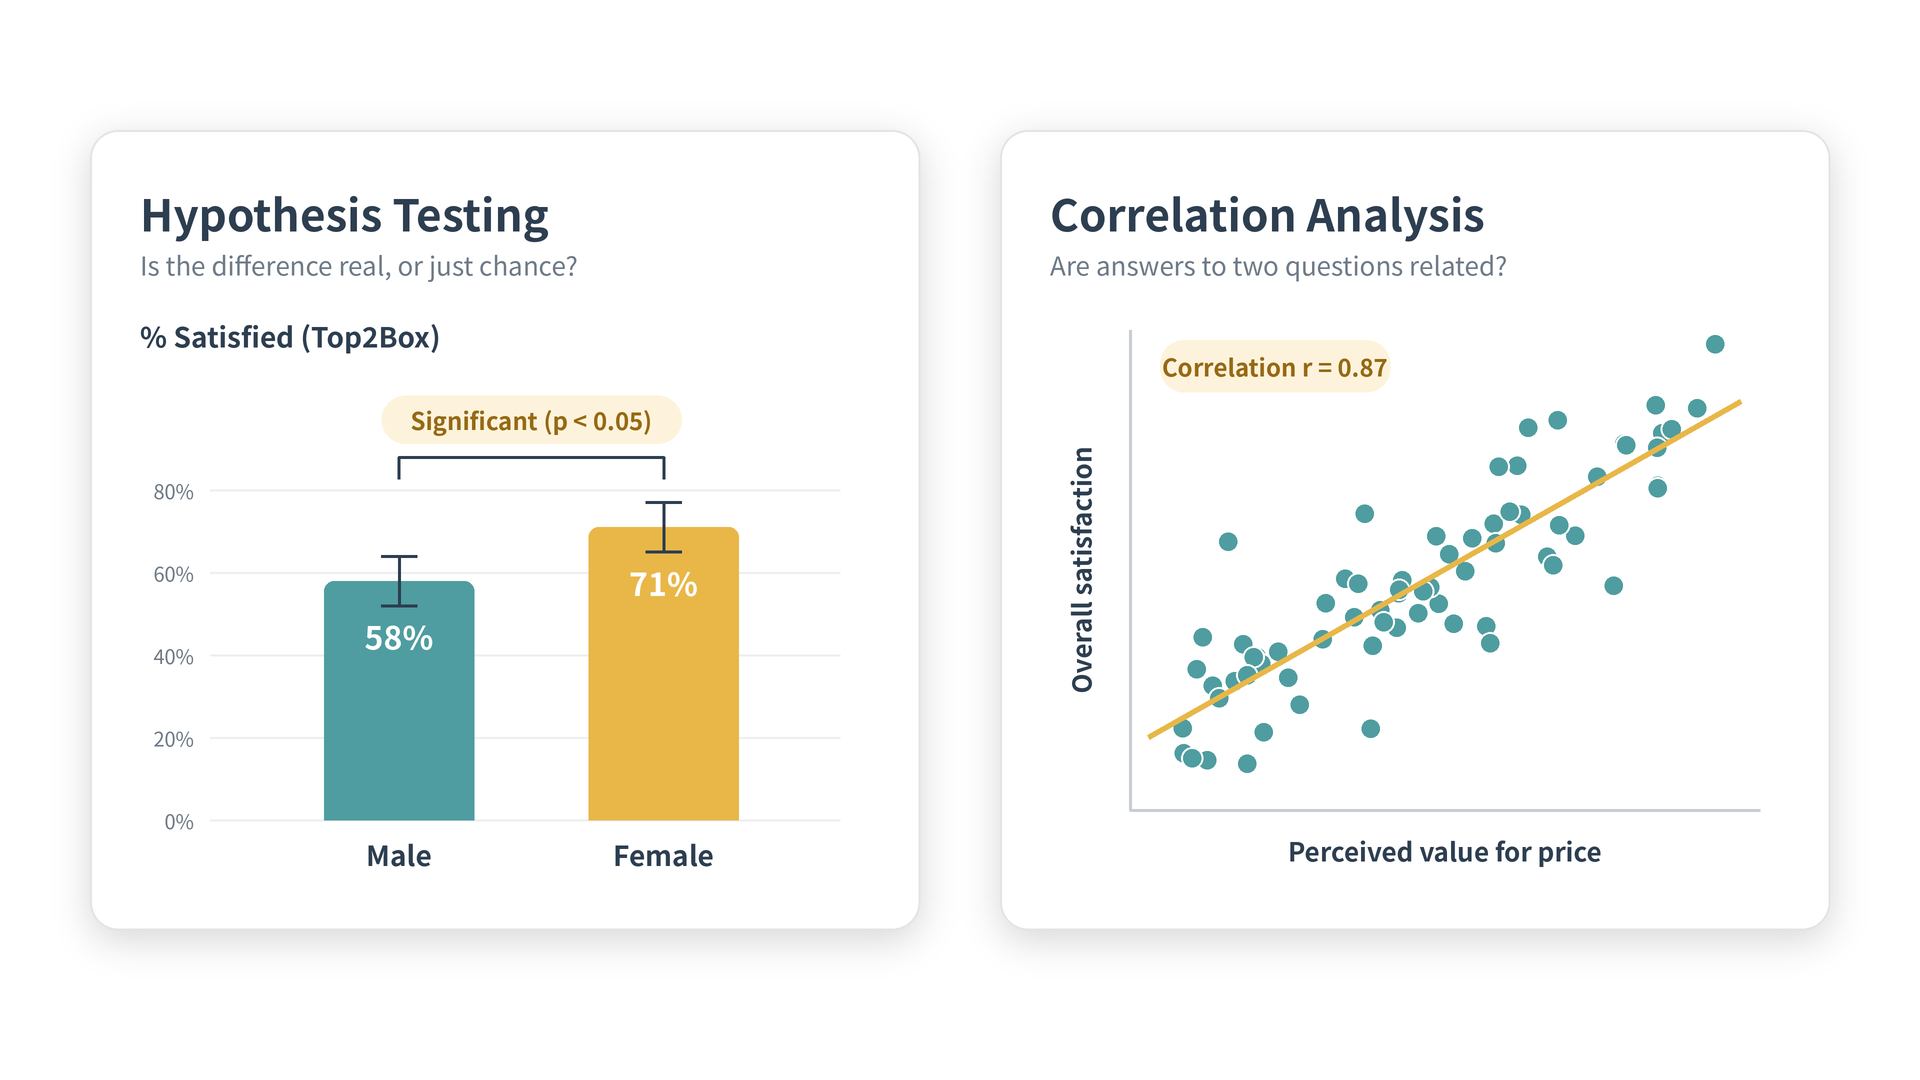
Cross-tabs reveal differences like “People in their 20s seem more likely to buy” or “Women seem more satisfied than men.”
But a table alone can’t tell you whether that difference is meaningful or just a quirk of this particular sample.
That’s where statistical methods such as hypothesis testing and correlation analysis come in.
At this level, you move from “it looks different” to “can we say the difference isn’t due to chance?”
Level 4 — Understanding the Drivers and Structure Behind Responses
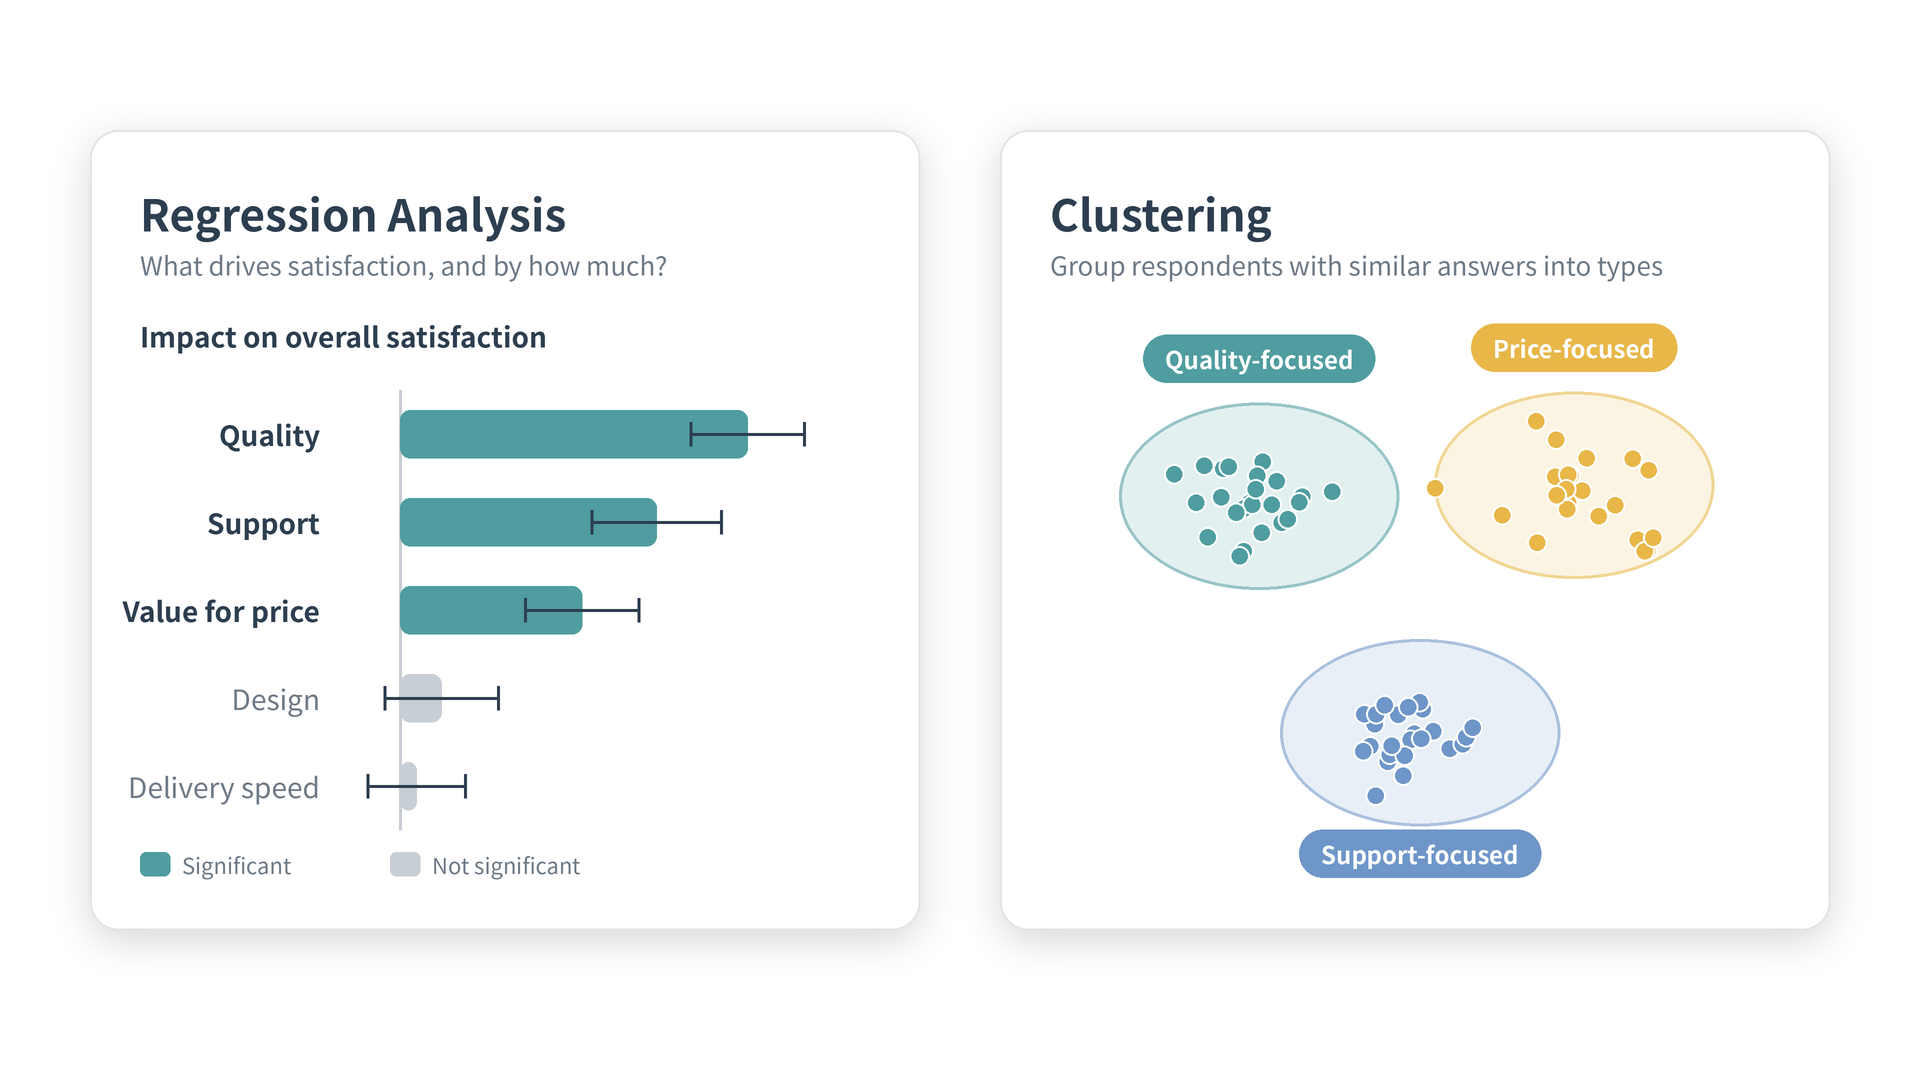
As you go further, you’ll want to answer questions that go beyond simple comparisons:
“Why are these people more satisfied?”
“Which factors influence purchase intent?”
“What types of respondents are there?”
For these, you need methods such as regression analysis, decision trees, factor analysis, principal component analysis, clustering, and latent class analysis.
At this point, survey analysis is no longer just tabulation—it’s moving into statistical modeling and segmentation.
Level 5 — Bringing in Open-Ended Responses and AI
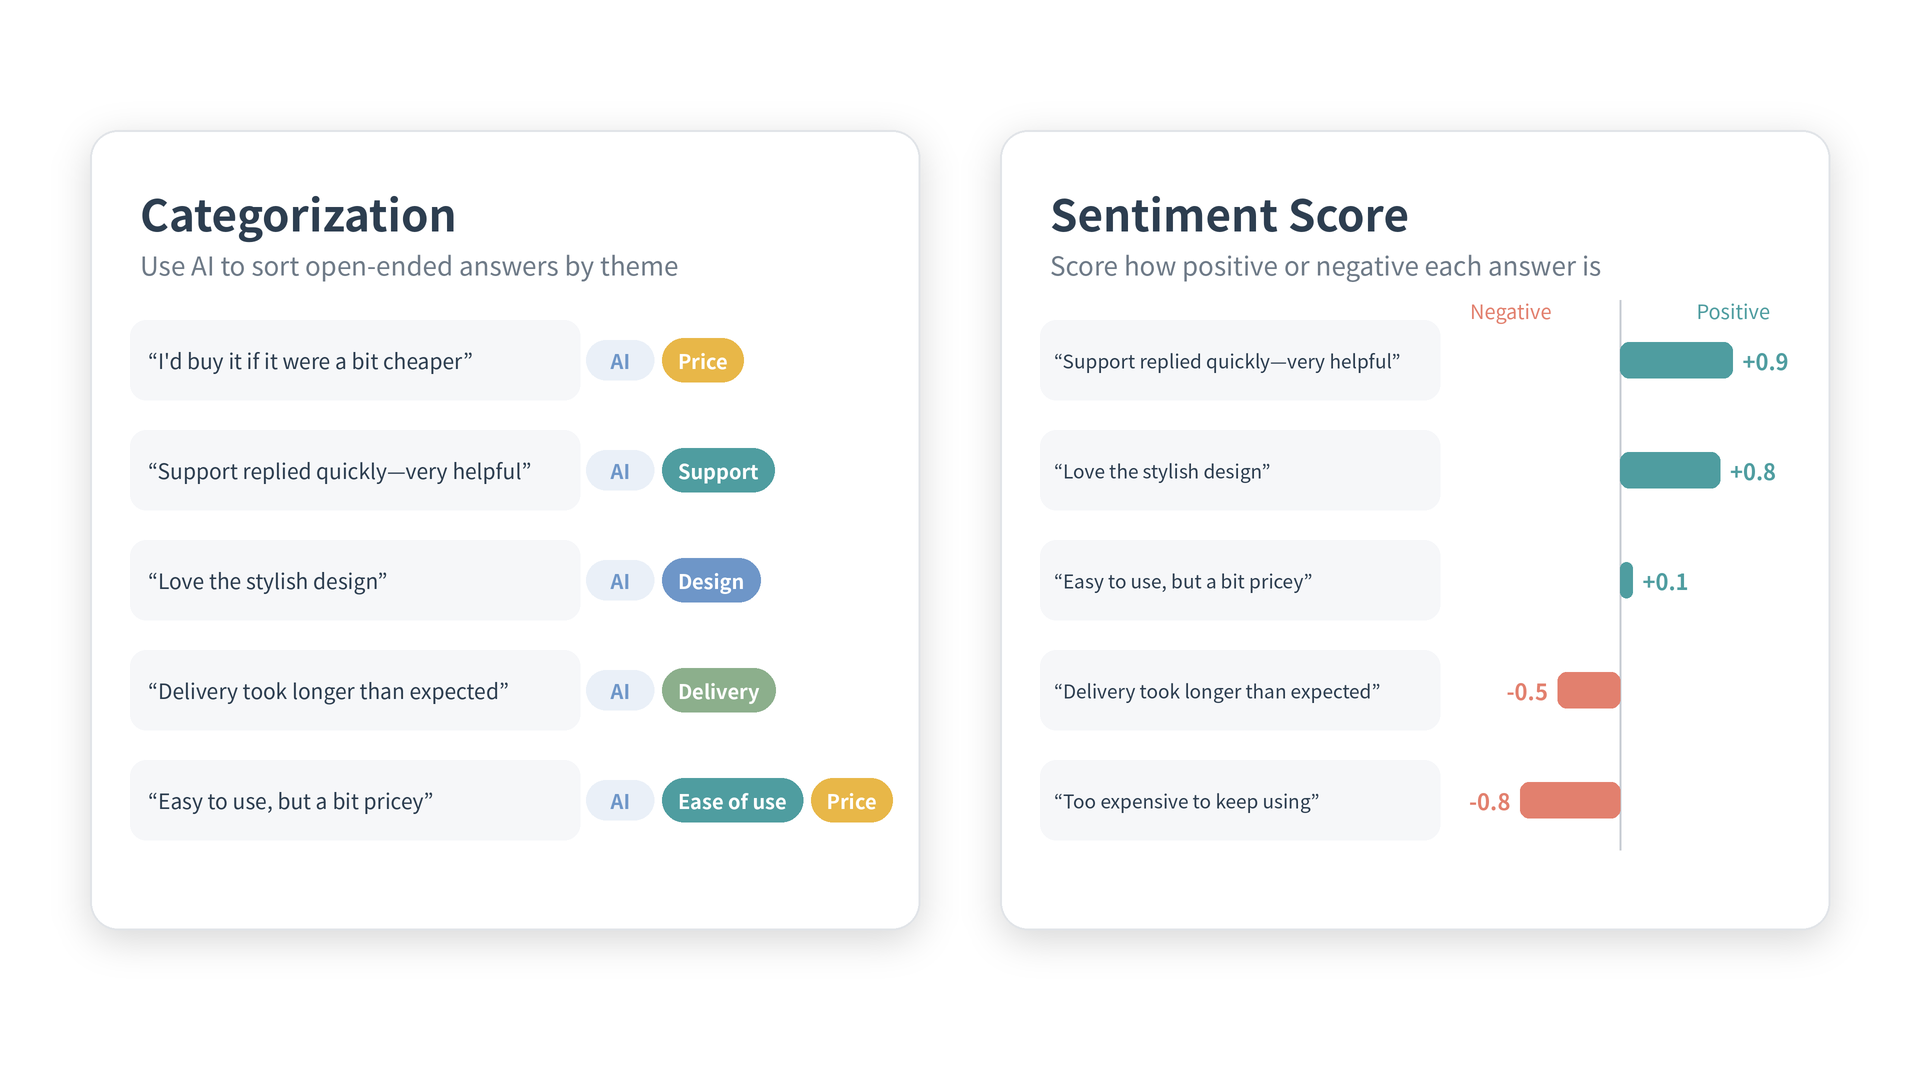
AI can now help analyze open-ended responses too: categorizing answers, assigning multiple categories, scoring sentiment, summarizing responses, and extracting themes.
But the key is not to analyze open-ended responses in isolation.
To answer a question like “What improvements are people in their 20s with high purchase intent asking for?”, you need to categorize the open-ended responses with AI and then cross-tabulate the results by age group and purchase intent.
So it’s not just whether a tool has AI features—it’s whether the text that AI structures can flow into the quantitative analysis that follows.
7 Criteria for Choosing Survey Analysis Software
Once you know what level of analysis you need, the next step is to look at concrete selection criteria.
1. Can It Handle Survey-Specific Data Structures?
Survey data has characteristics that set it apart from typical business data:
Likert scales such as 5-point ratings
Ordered categories
Multiple-response questions
Matrix (grid) questions
Non-responses and structural missing values (e.g., skip logic)
Long question text
Answer codes vs. display labels
A large number of question columns
For example, “Satisfied,” “Neutral,” and “Dissatisfied” have a natural order. If you treat them as plain categories, you lose that ordering information in your analysis.
And with multiple-response questions, one respondent can select several options, so you can’t tabulate them the same way as an ordinary categorical variable.
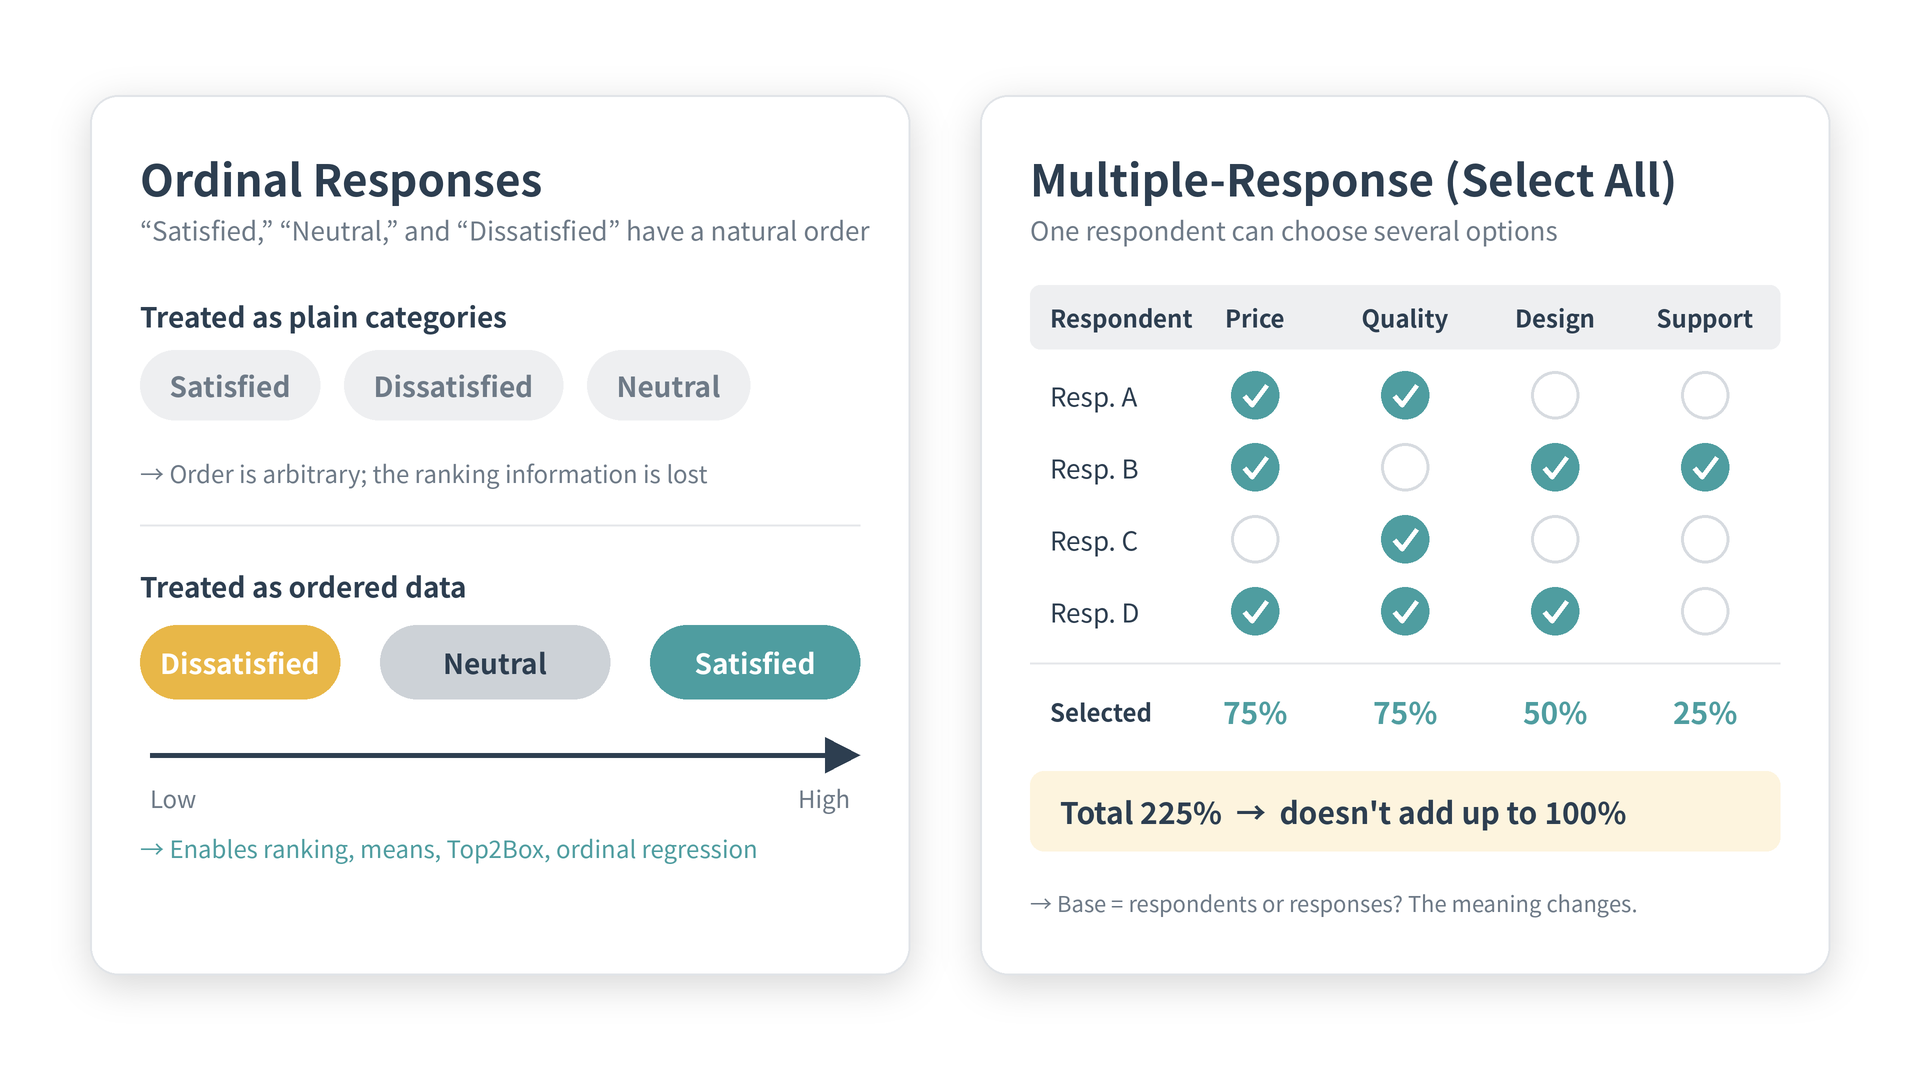
When choosing survey analysis software, start by checking whether it properly handles survey-specific data types and structures.
2. Can It Build Topline Tables and Cross-Tabs Flexibly?
Survey analysis involves running cross-tabs over and over. In addition to the row %, column %, Base N, and Top2Box mentioned in Level 2, check whether you can lay out multiple questions at once, apply weights, and export to Excel.
For example, with a multiple-response question, the meaning of the percentages changes significantly depending on whether the denominator is the number of responses or the number of respondents.
Market research firms and internal reporting teams also often put many questions into a single table, or repeat the same table across multiple attributes such as age group, gender, and region.
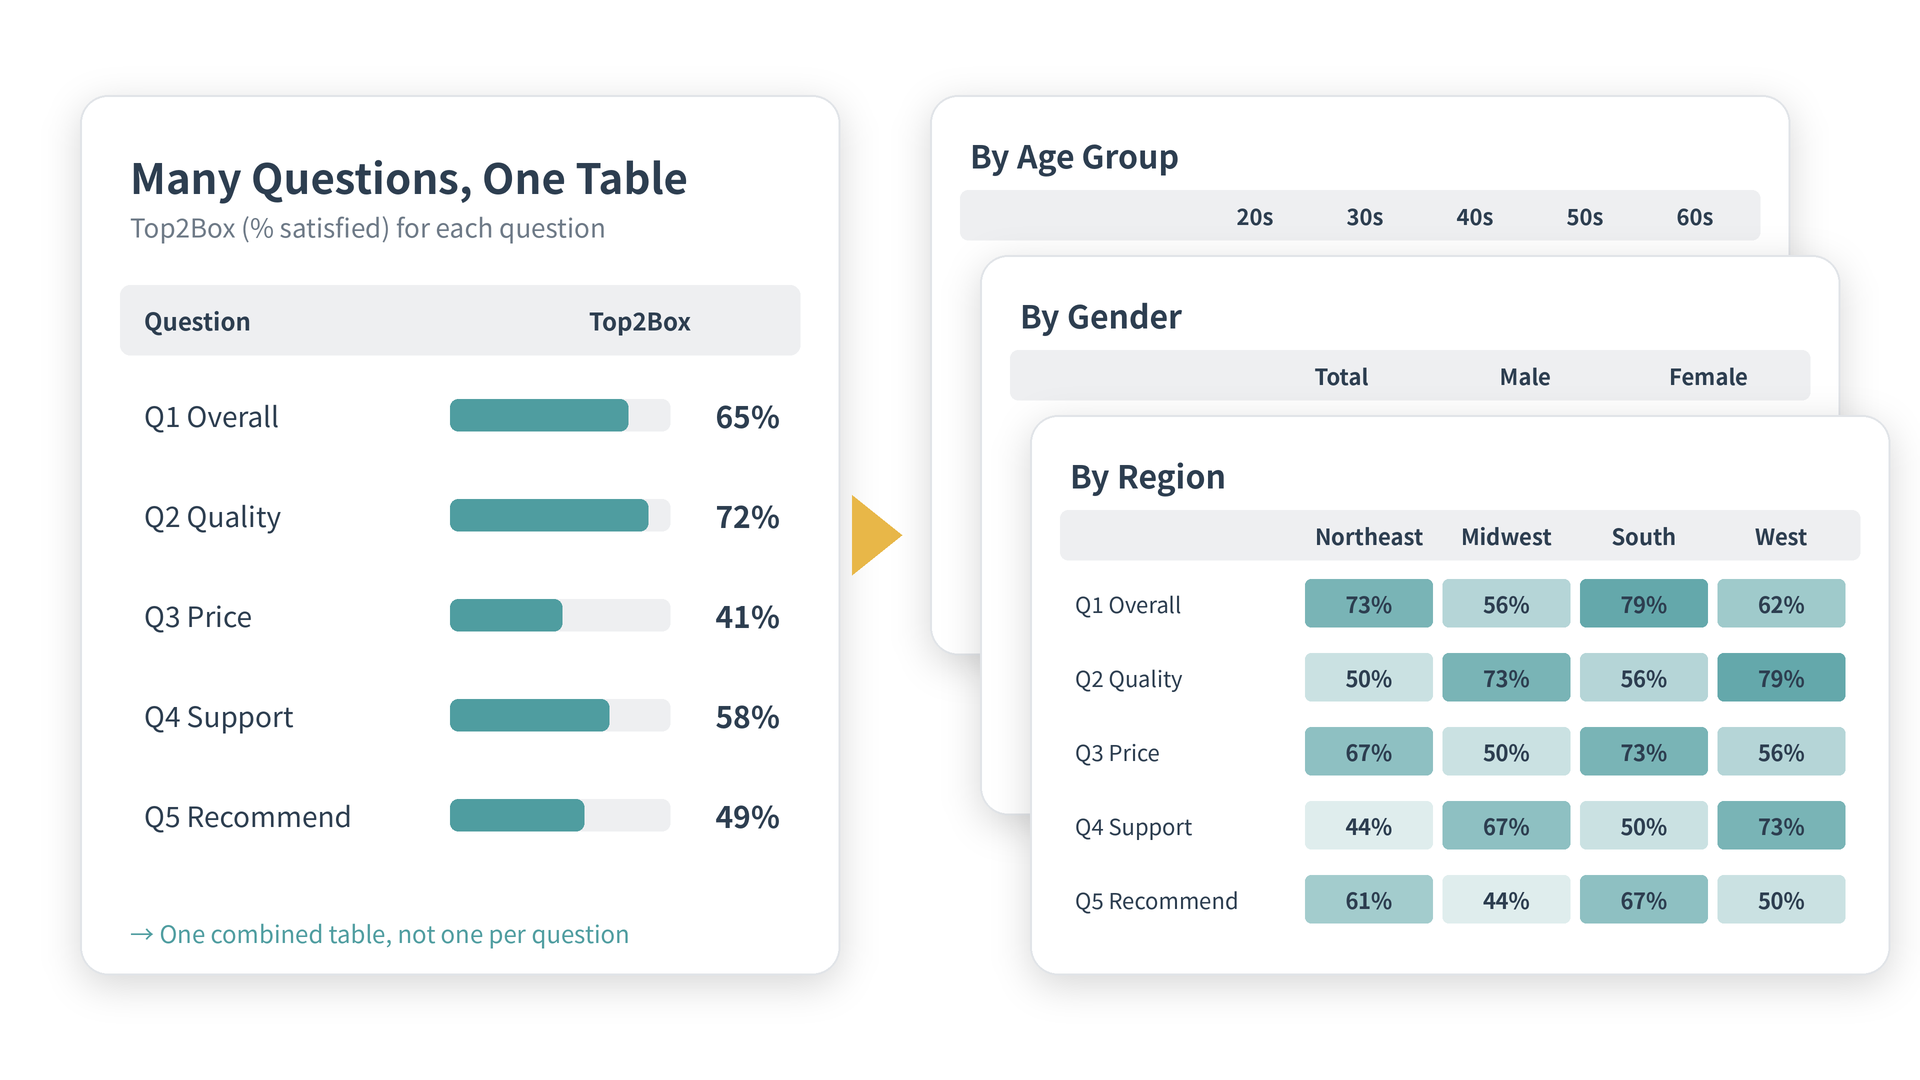
When choosing software for topline tables and cross-tabs, don’t ask “Does it have pivot tables?” Ask whether it can efficiently produce the tables your survey work actually requires.
3. Can It Reproduce the Data Prep You Do Before Tabulating?
Survey analysis involves a lot of data preparation before any tabulation happens:
Renaming question text to readable column names
Setting the order of 5-point scale responses
Creating age groups from age
Creating Top2Box flags
Reshaping multiple-response data into an analysis-friendly format
Joining with CRM data
Appending data from earlier tracking waves
Creating weights
Excluding invalid or unneeded responses
What matters here isn’t whether you can do it once—it’s whether you can reproduce the same processing next time.
Say you run the same brand survey again six months later. If you redo last time’s prep by hand, you run risks like:
Forgetting filter conditions
Making formula mistakes
Selecting the wrong column ranges
Getting different processing depending on who does the work
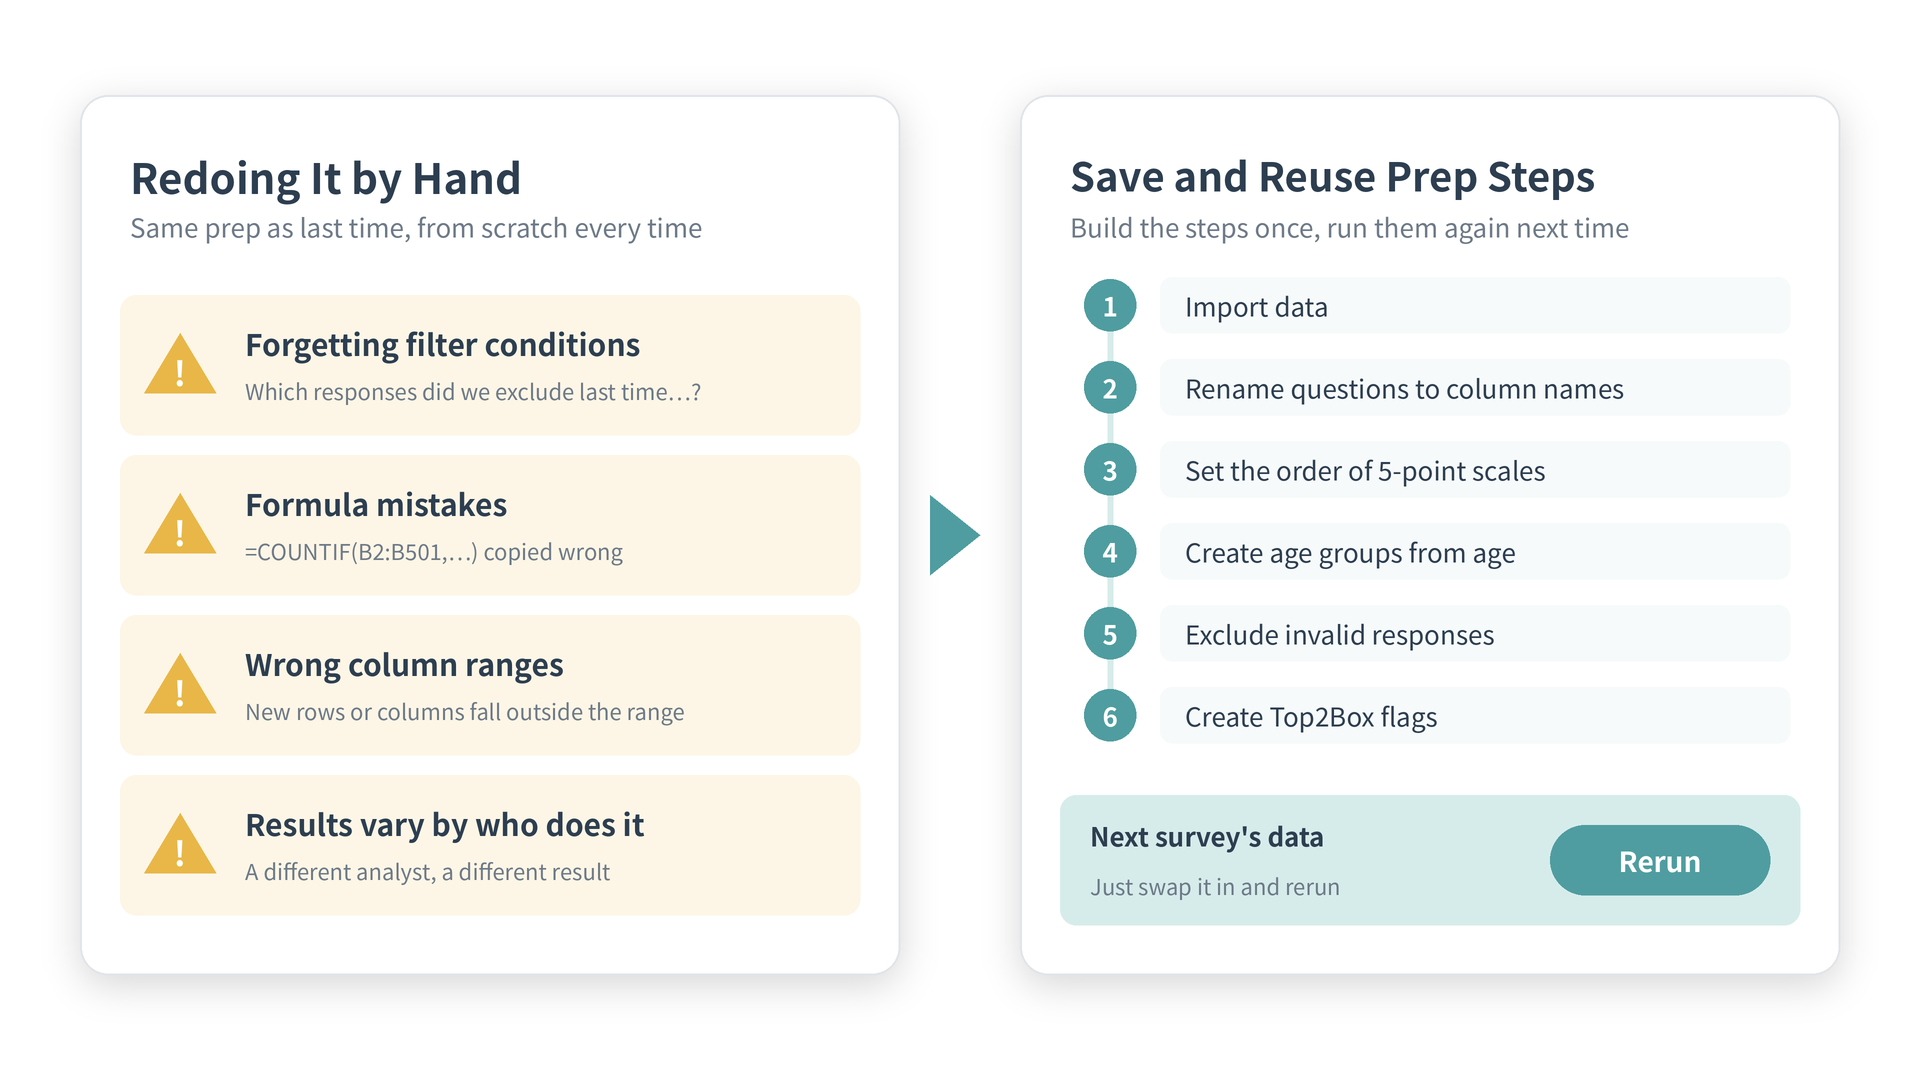
That’s why a way to save and reuse your data prep steps is especially important for recurring surveys. Being able to tabulate once is not the same as being able to reproduce the same analysis.
4. Can It Go Beyond Tabulation to Statistical Analysis?
Once a cross-tab reveals a pattern, the next questions are “Is this difference actually meaningful?” and “What’s driving the result?”
So check how far into statistical analysis a tool can take you when you need it.
| What you want to know | Typical analysis |
|---|---|
| Do response patterns differ between groups? | Chi-square test |
| Is there a difference in means or proportions? | Tests of means / proportions |
| Are two questions related? | Correlation analysis |
| What drives satisfaction? | Regression analysis |
| What factors influence a 5-point rating? | Ordinal logistic regression |
| What underlying dimensions sit behind the questions? | Factor analysis |
| Is a set of questions internally consistent? | Reliability analysis |
| I want to group respondents into segments | Clustering / latent class analysis |
| Under what conditions do response patterns change? | Decision trees (CART, CHAID) |
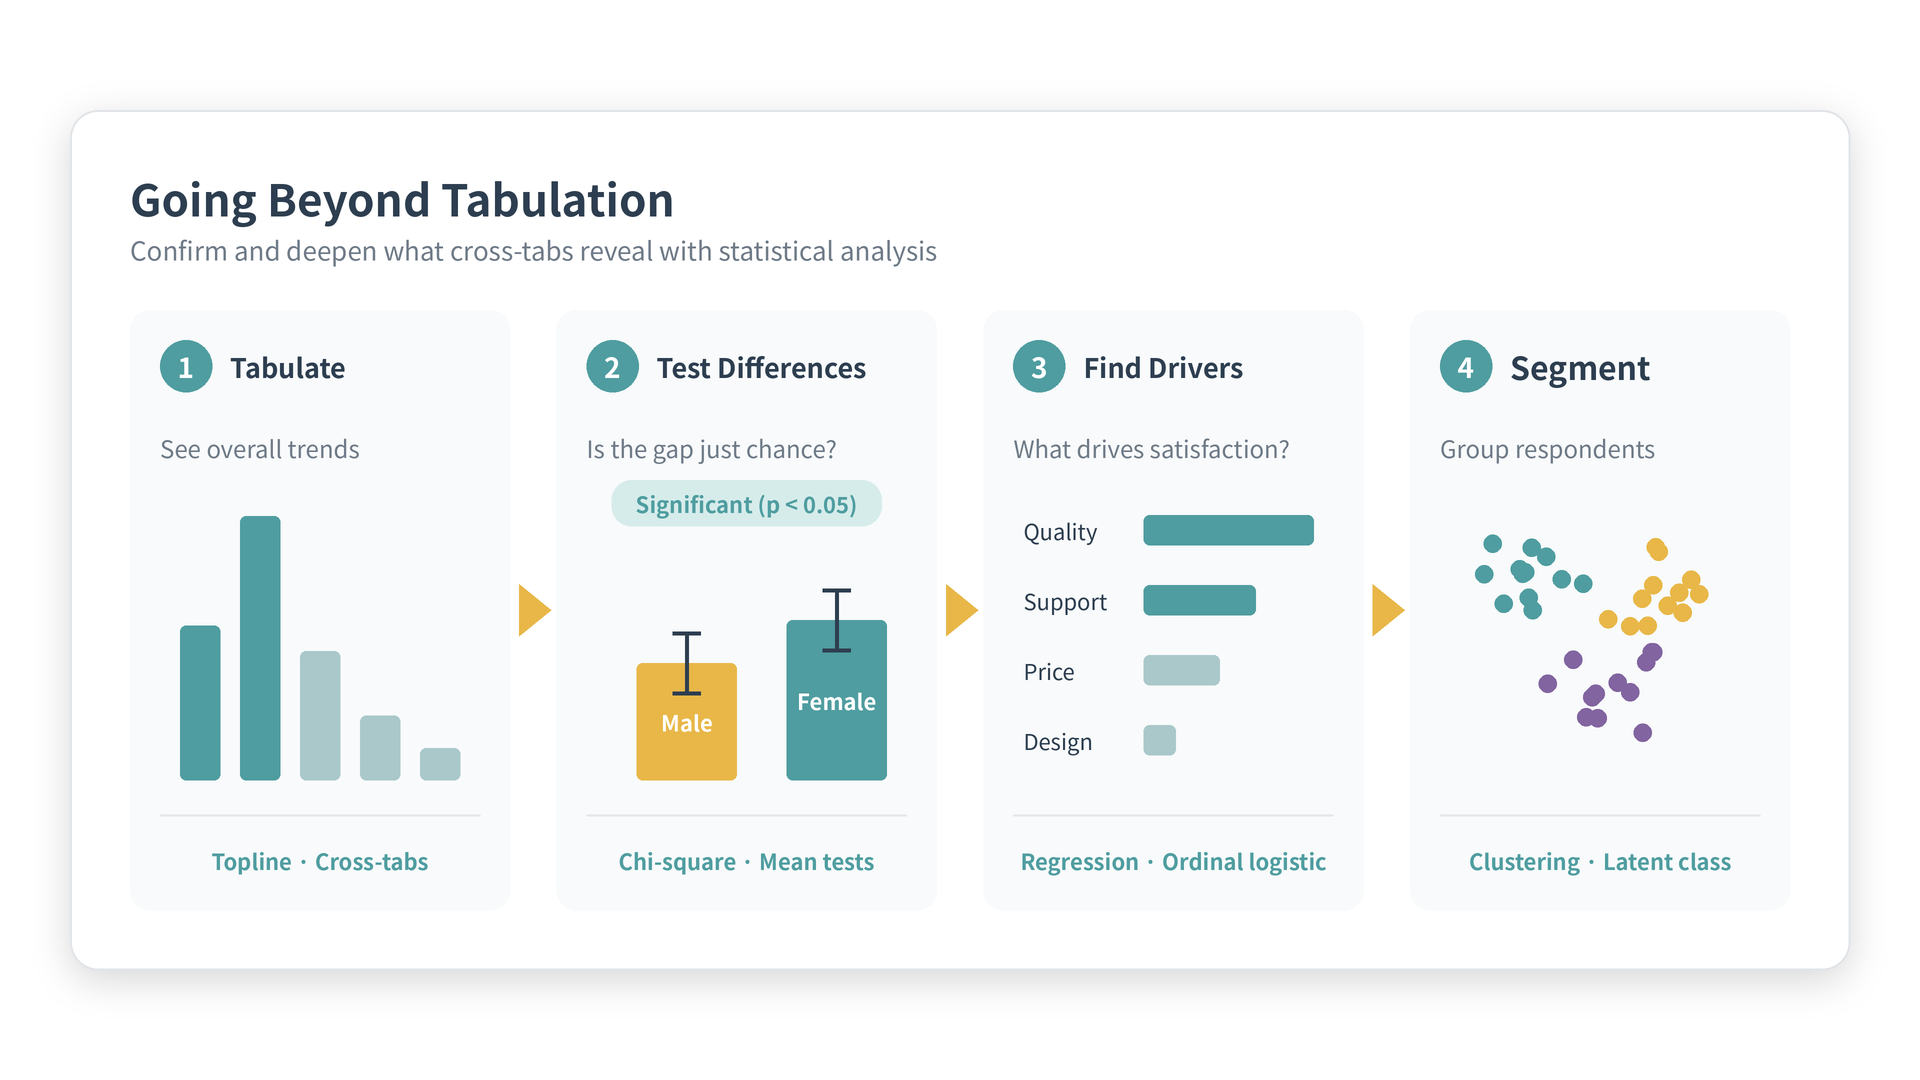
If you only ever need frequency counts, you may not need any of this. But if you want to go from “tabulate → test differences → find drivers → segment,” statistical analysis capabilities become essential.
5. Can It Analyze Open-Ended Responses?
Open-ended responses let you hear respondents in their own words. But once you have hundreds or thousands of them, reading every one by hand becomes impractical.
Traditionally, the options were word counts, manual coding, or pulling out a handful of example quotes. Today, AI makes it much easier to:
Categorize open-ended responses
Assign multiple categories per response
Run sentiment analysis
Summarize
Extract themes
However, an AI-generated summary on its own often isn’t enough. To answer questions like “Are complaints about price more common among younger respondents?” or “What improvements do respondents with high purchase intent want?”, you need to combine the categorized open-ended responses with other questions and demographics.
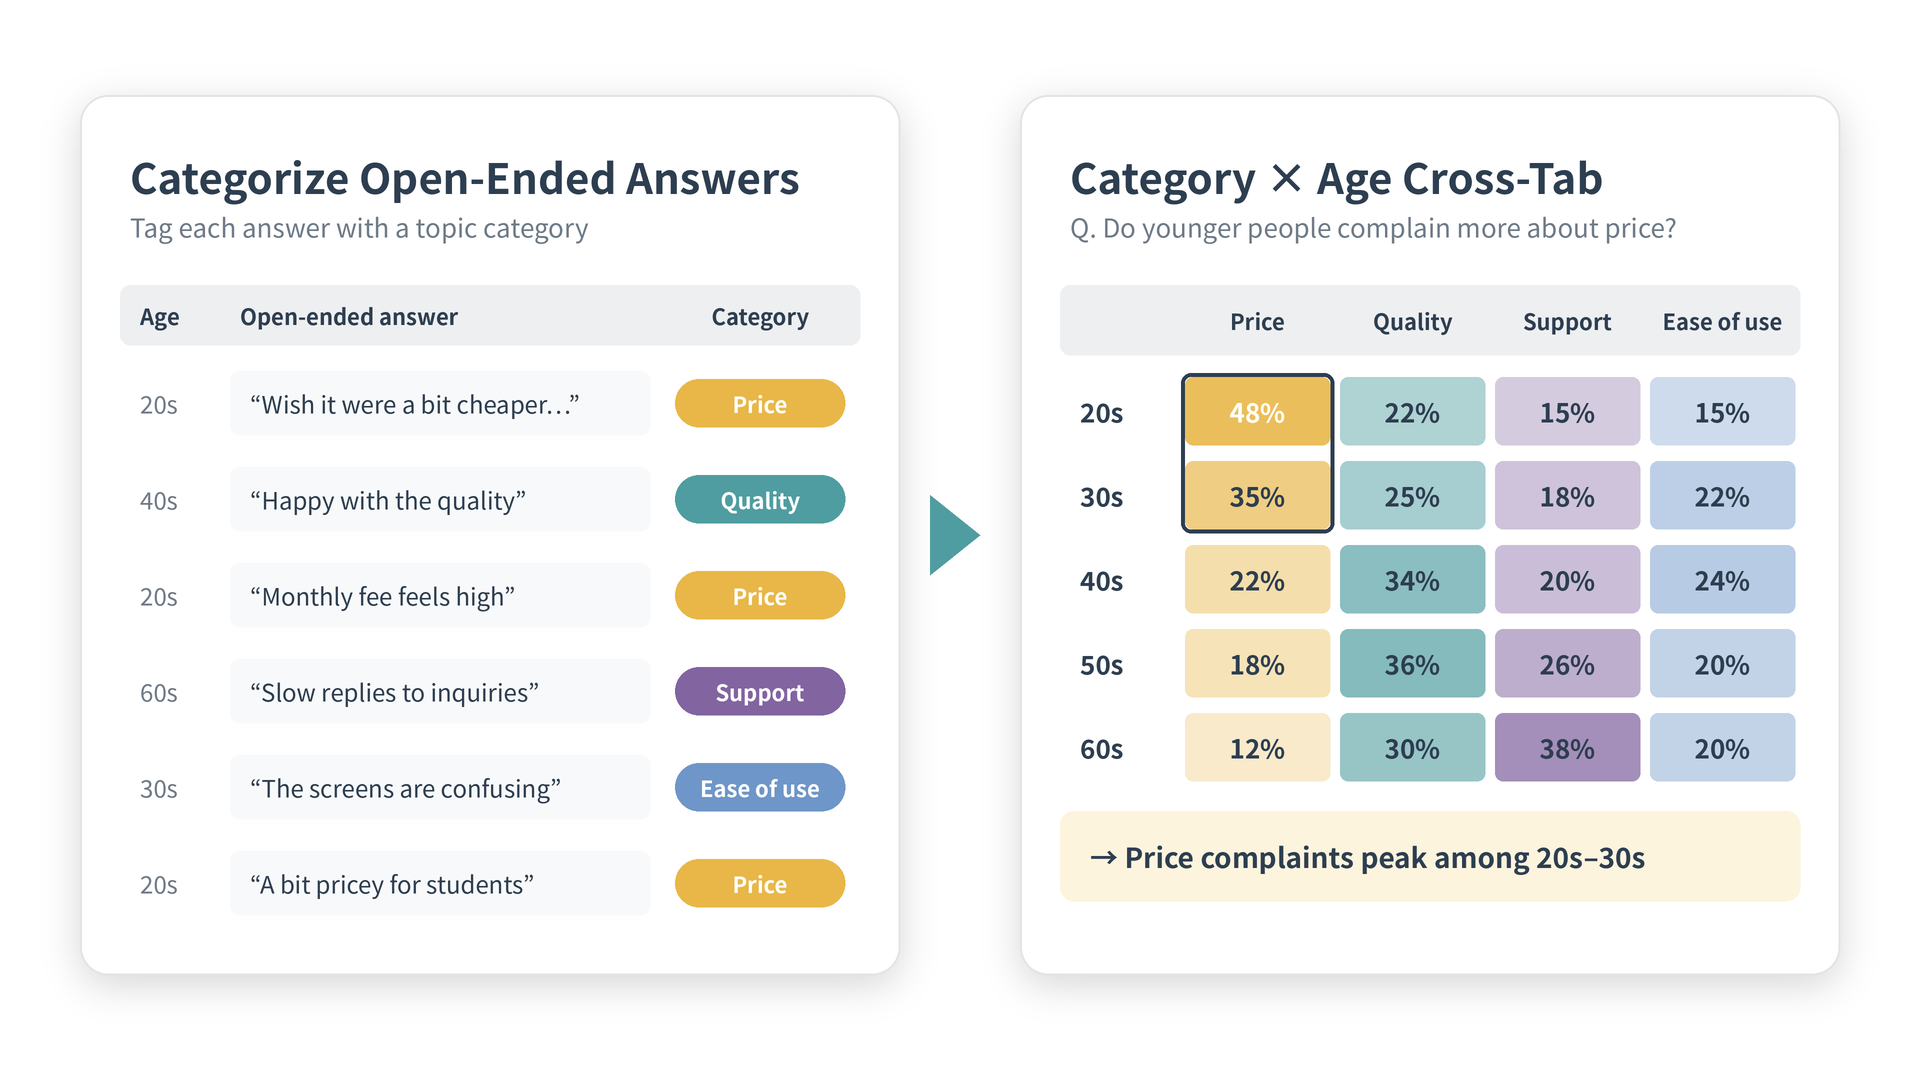
So check not only whether a tool can analyze open-ended responses with AI, but whether those results can feed into cross-tabs and statistical analysis.
6. Can It Update Tracking Surveys Efficiently?
Customer satisfaction surveys, brand tracking, employee surveys, and NPS programs are usually run on a regular schedule, not just once.
For example, if every quarter you:
Download a CSV
Copy last quarter’s Excel workbook
Paste in the new data
Fix the formulas
Refresh the pivot tables
Replace the charts
then it’s not just the time per round that adds up—the risk of mistakes accumulates too.
So for tracking surveys, check whether you can:
Swap in new data
Rerun the same tabulations
Update charts and analysis results
Update the report itself
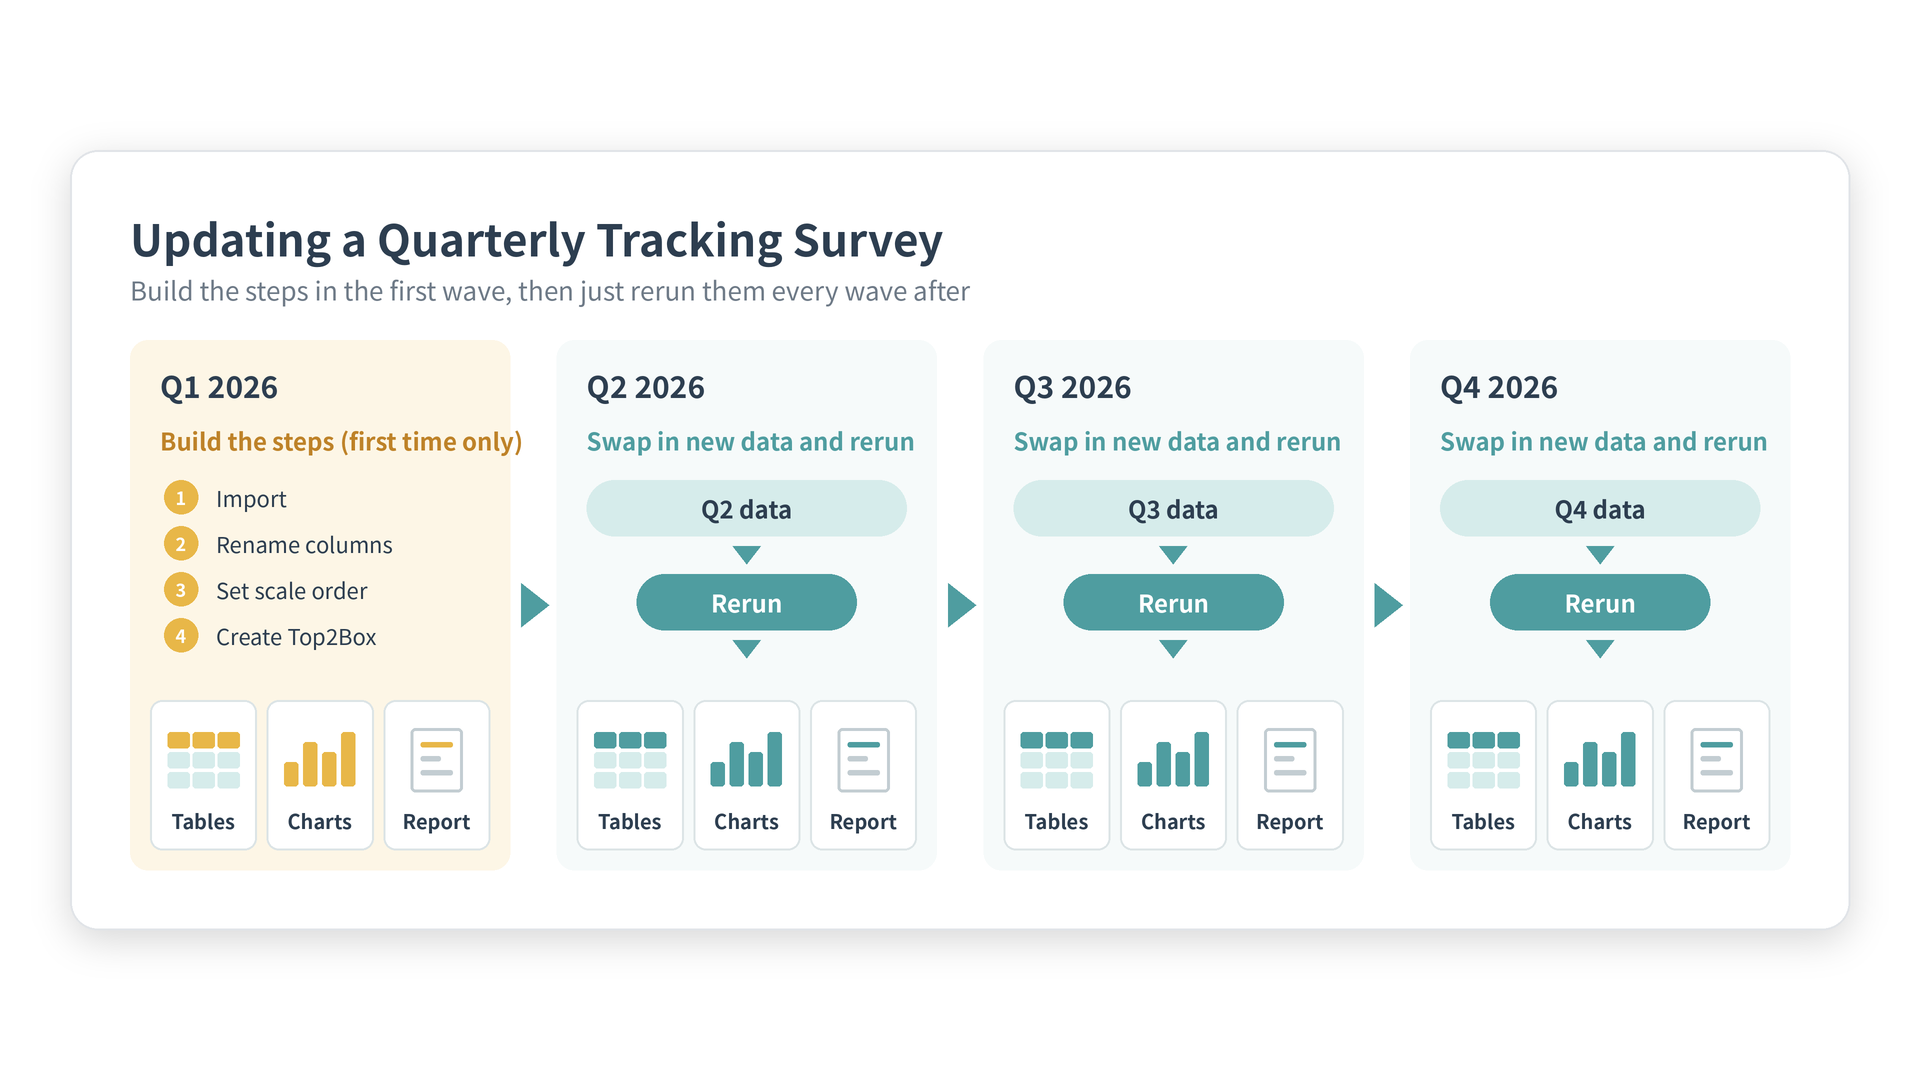
When evaluating survey analysis software, don’t just look at how fast you can do the first analysis. How quickly and accurately you can do the second, third, and fourth is just as important.
How Do Excel, BI, SPSS, R / Python, and Exploratory Compare?
With those criteria in mind, let’s look at the main options. No single tool is always best; the right choice depends on your goals and the level of analysis you need.
Comparison Table
| Tool | Data structures | Topline & cross-tabs | Data prep | Statistics | AI open-ended analysis | Reproducibility & recurring updates | Sharing |
|---|---|---|---|---|---|---|---|
| Survey platform built-in reports | ◎ | ○ | ○ | △ | △ | △ | ○ |
| Excel | △ | ○ | ○ | △ | △ | △ | ○ |
| BI tools (Tableau, Power BI, etc.) | △ | ○ | ○ | △ | △ | ○ | ◎ |
| SPSS | ○ | ○ | ◎ | ◎ | △ | ○ | △ |
| R / Python | ○ | ○ | ◎ | ◎ | ○ | ◎ | ○ |
| Exploratory | ◎ | ◎ | ◎ | ◎ | ◎ | ◎ | ○ |
◎: A built-in strength ○: Supported (may require setup or workarounds) △: Often requires extra work, add-ons, or a separate tool
Note: Capabilities vary by product, edition, and add-on modules. This table is my own rough guide to how practical each tool is for day-to-day survey analysis.
There is also specialized tabulation software built for market research firms, focused on producing cross-tabs and banner tables. It’s widely used when large numbers of tables must be delivered in a fixed format.
Excel — Best for Quick Tabulation and Small-Scale Analysis
Excel’s biggest advantage is that almost everyone already knows how to use it. When the dataset isn’t too large and the analysis is simple, it’s very efficient.
When Excel is a good fit
Small surveys
Mostly frequency counts
One-off analyses
Formulas and pivot tables are enough
The final deliverable needs to be in Excel
With pivot tables and formulas, you can do cross-tabs and basic survey analysis in Excel. But as processing gets more complex, or you repeat the same analysis, the manual work tends to pile up. Complex multiple-response questions, many cross-tabs, advanced statistics, joins with other data sources, and recurring updates can all become hard to manage.
BI Tools — Best for Dashboards and Sharing
BI tools such as Tableau and Power BI excel at visualizing data and sharing it across an organization as dashboards.
When BI tools are a good fit
You want to monitor survey results on an ongoing basis
You want to share KPIs through dashboards
You want many people in the organization to see the results
You want to visualize survey data alongside other business data
You have an IT team or data engineers who manage a data warehouse
On the other hand, survey-specific needs such as multiple-response questions, complex table layouts, weighting, and statistical analysis may require extra data prep or custom implementation.
Your options depend on whether your focus is presenting results or doing deeper analysis.
SPSS — Best for Running Statistics Through a GUI
SPSS is a statistical analysis package that has been used for decades in universities, research institutions, and market research. With SPSS Syntax, you can save analysis steps as commands and rerun them, and the Custom Tables option lets you build survey-style tables.
When SPSS is a good fit
Your work centers on statistical analysis
You want to analyze through a GUI
SPSS is already the standard in your organization
You have existing SPSS Syntax and analysis assets
You rely on traditional statistical methods
If you’re looking for an SPSS alternative, the question isn’t whether a tool can do statistics. The real question is whether you want data prep, visualization, statistical analysis, open-ended analysis, and reporting in a single environment, in a reproducible way.
R / Python — Best When You Need Maximum Flexibility
R and Python are the most flexible options. You can implement any analysis method you need, use the latest packages, and build complex automation.
When R / Python are a good fit
You can read and write code
You have a lot of custom analysis logic
You need specialized statistical methods
You want full automation
You want to manage analysis logic as code
These days, you can also have AI write code for you, which has dramatically lowered the barrier to getting started with programming. Ask it to “cross-tabulate this by age group,” and plausible-looking code appears in seconds.
But being able to generate code is not the same as being able to understand it. When you hit an error, or the results look a little off, you can’t fix the problem unless you can read the generated code and track down the cause.
What matters even more is when there’s no error. The code runs, numbers come out—but unless you understand the code, you can’t confirm those numbers are correct or that the tabulation does what you intended. Is the denominator for multiple-response percentages the number of respondents? Are non-responses excluded? Is the order of the 5-point scale handled correctly? If you can’t verify things like these, AI-written code ends up being a black box, and it becomes hard to report the results with confidence.
And when analysis is concentrated in the few people who can understand the code, the team becomes heavily dependent on them. When choosing R / Python, think beyond flexibility: who on your team will read, verify, and maintain the code?
Exploratory — Best When You Want the Entire Analysis as a Reproducible Workflow
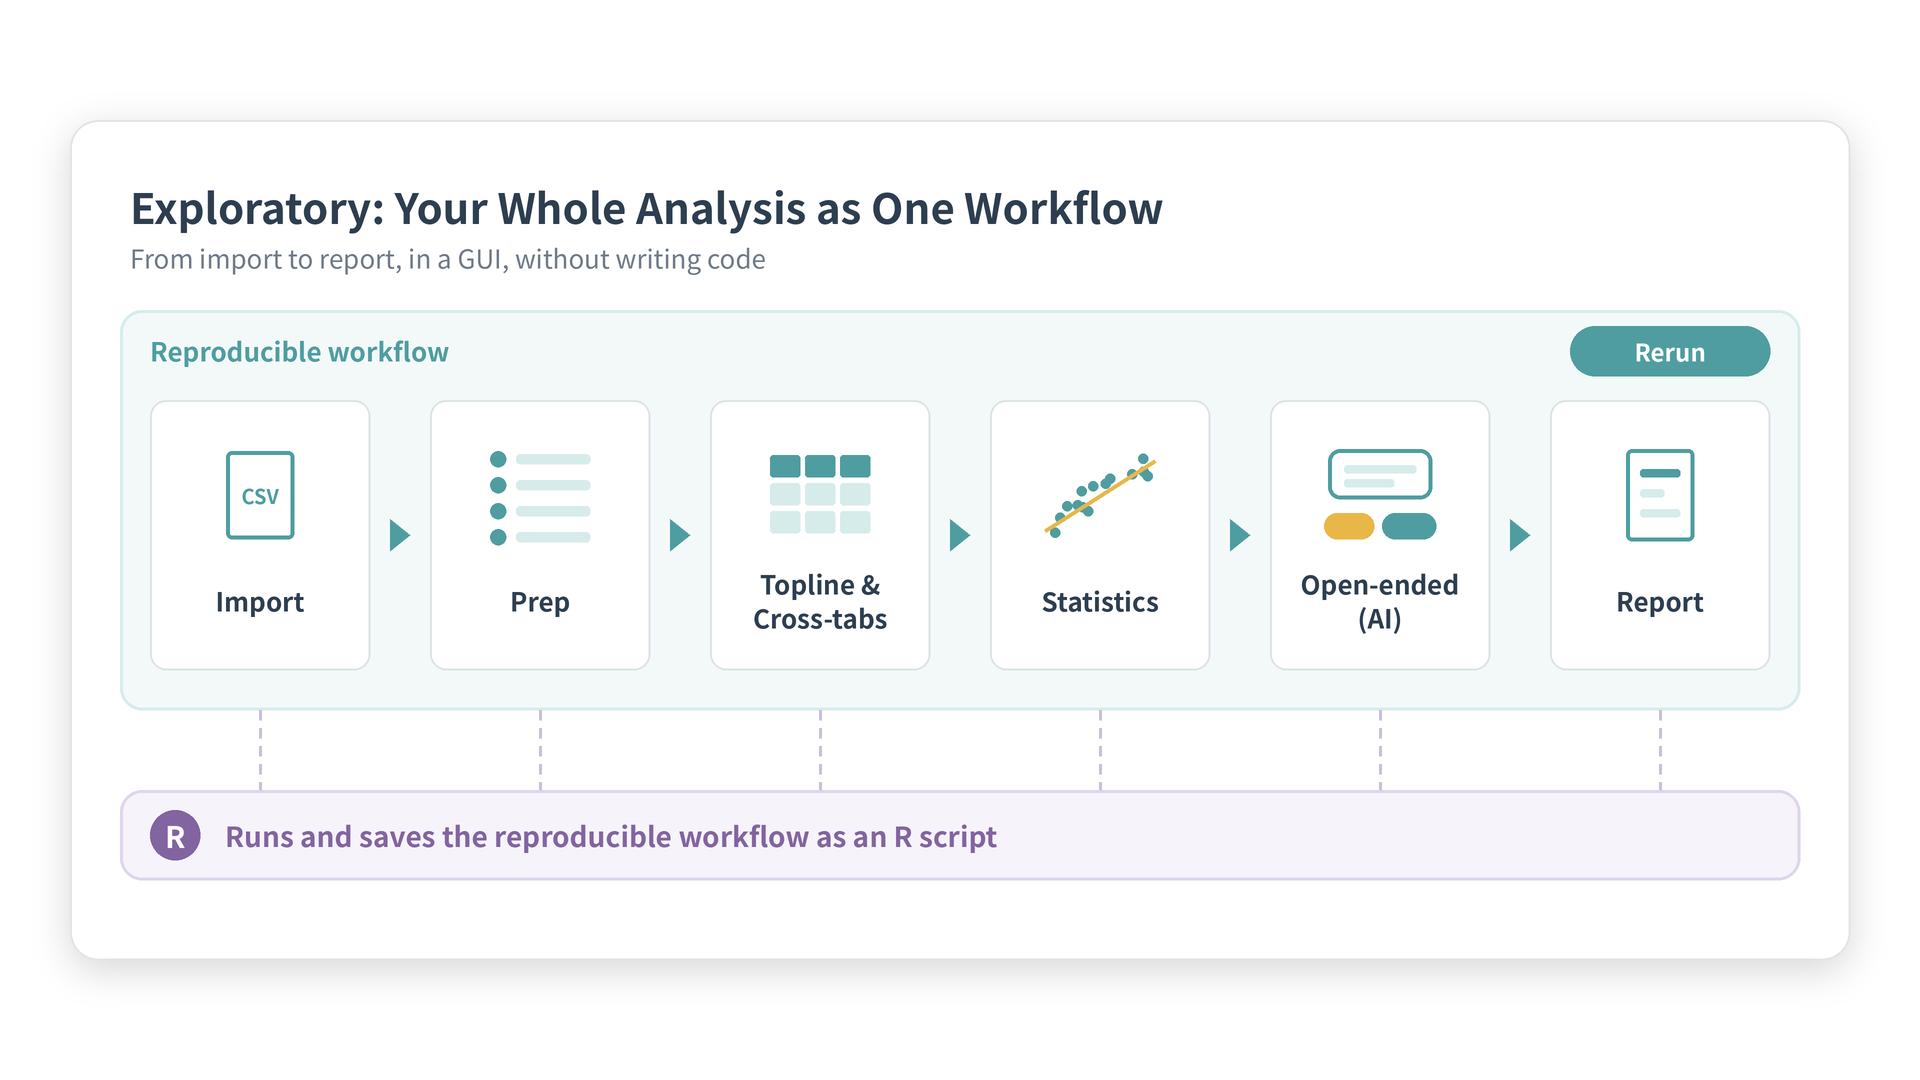
Exploratory is a data analysis tool that handles the whole survey process—importing and preparing data, topline tables and cross-tabs, statistical analysis, AI-powered open-ended analysis, and reporting—as one reproducible workflow. Exploratory uses R as its analytics engine, so you can use R’s statistical capabilities through a GUI without writing code.
Exploratory v16, released in August 2026, significantly expanded Exploratory’s survey analysis features. Specifically, you can:
Multiple-response questions: Tabulate comma-separated multiple-response columns directly in pivot tables and charts, without splitting the data first. There’s also a UI to convert multiple responses into long format.
Topline tables and cross-tabs: Build topline tables without transforming data by arranging pivot-table rows “in parallel.” The “Multiple Variables” option lets you cross-tabulate many wide-format questions at once.
Likert scales: Set the order of 5-point (and other) scales and display every level, including options nobody selected.
Top2Box / Bottom2Box: Create Top2Box, Bottom2Box, and Net from 5- or 7-point scales, and save the logic as a reusable calculation.
Weighting: Create weight columns based on population composition and apply them in pivot-table tabulations (v16.2).
Statistical analysis: Run chi-square tests, regression, ordinal logistic regression, CHAID decision trees, factor analysis, Cronbach’s alpha, clustering (including K-Modes and K-Medoids), latent class analysis, and more from a GUI.
AI analysis of open-ended responses: Use AI functions to categorize, summarize, and score the sentiment of open-ended responses. Results are added as new columns, so you can use them directly in cross-tabs by demographic.
Sharing: Export pivot tables to Excel or Google Sheets, and package results as notes (reports) or dashboards to share.
Every data prep operation is also recorded as a step, so you can swap in the next survey’s data and rerun the same tabulations, analyses, and reports. And in environments where AI can’t be used, all the non-AI data prep, tabulation, analysis, and reporting features still work.
Example use cases
Market research firms: Standardize tabulation across multiple clients and formats, and produce topline tables, cross-tabs, and Excel deliverables more efficiently.
Corporate marketing and research teams: Update in-house customer satisfaction and brand tracking surveys each wave as a reproducible workflow.
University institutional research (IR): Cross-tabulate student surveys and course evaluations by department and year, and statistically analyze what drives satisfaction.
That said, there are cases where Exploratory isn’t the best fit. If you have dedicated data engineers and want to manage survey results in a database, pushing all data access and computation to the database side, a BI tool may be a better fit. And if you want to build all of your analysis in custom code and integrate it with other systems, writing R / Python directly may be the better choice.
Which Tool Fits Which Goal?
Putting it all together, it’s more useful to choose a tool based on what you want to do than on which tool is “best.”
| What you want to do | Main options |
|---|---|
| Run quick frequency counts on a small survey | Excel / survey platform built-in reports |
| Deliver large numbers of tables in a fixed format | Specialized tabulation software for research firms |
| Share survey results widely as dashboards | BI tools, Exploratory |
| Run statistical analysis through a GUI | SPSS, Exploratory |
| Analyze and automate freely with code | R / Python |
| Put prep, cross-tabs, statistics, AI open-ended analysis, and reporting into one workflow | Exploratory |
Of course, these categories aren’t absolute. You can do advanced analysis in Excel, and you can build dashboards in R.
What matters is not just whether a task can be done, but whether your team can keep doing it that way, sustainably.
Checklist for Choosing Survey Analysis Software
Finally, here’s a checklist of things to confirm when comparing tools.
Data handling
Handles multiple-response questions naturally
Handles the order of Likert scales
Handles non-responses and missing values properly
Manages long question text and answer labels
Tabulation
Builds topline tables
Builds cross-tabs efficiently
Lets you switch between row %, column %, and total %
Shows Base N
Creates Top2Box / Bottom2Box
Supports weighted tabulation
Data prep
Saves data prep steps
Joins multiple files and CRM data
Reuses previous prep for tracking surveys
Statistical analysis
Runs hypothesis tests such as chi-square
Goes as far as regression analysis
Do you need factor analysis or reliability analysis?
Do you need segmentation?
AI and open-ended responses
Categorizes open-ended responses
Analyzes sentiment
Lets you cross-tabulate AI categorization results
Operations and sharing
Reruns the same analysis for the next survey wave
Exports to Excel
Shares results as dashboards
Packages results as reports
You don’t need a “yes” on every item. In fact, the starting point for choosing a tool is deciding which items truly matter in your own analysis process.
Frequently Asked Questions
Is there survey analysis software that can replace SPSS?
If you want to run statistical analysis through a GUI, JMP and Exploratory are options. If your team can write code, R / Python are also strong choices. When migrating from SPSS, compare not just whether the statistical methods are covered, but whether data prep, table building, open-ended analysis, and reporting can all be done reproducibly in one environment.
How do I cross-tabulate multiple-response questions?
First, decide whether the denominator for percentages is the number of respondents or the number of responses. Then split answers stored in a single cell (for example, comma-separated) into individual options and tabulate them. In Exploratory, you can cross-tabulate delimited multiple-response columns directly in a pivot table, without splitting the data first.
How can I use R’s statistical analysis without programming?
One way is to use a GUI tool for R. Exploratory uses R as its analytics engine and lets you do data prep, visualization, and statistical analysis—chi-square tests, regression, factor analysis, and more—with point-and-click operations, no code required. Every prep step is recorded, so your analysis is reproducible even without writing code.
What is Top2Box?
Top2Box is the combined percentage of respondents who chose the top two options on a rating scale (for example, “Very satisfied” and “Satisfied” on a 5-point scale). The bottom two combined is called Bottom2Box, and the difference between them is sometimes called Net. Because it makes satisfaction or purchase intent easy to compare as a single number, it’s widely used in survey analysis.
How can I make tracking survey tabulation more efficient?
The key is to keep your data prep and tabulation steps in a reusable form rather than doing them by hand. If you save steps like renaming columns, setting scale order, creating Top2Box, and applying weights, you can rerun the same tabulations, analyses, and reports simply by swapping in the new survey data.
How do I analyze open-ended responses with AI?
AI can categorize open-ended responses by theme, score their sentiment, and summarize them. The important part is keeping the categorization results as new columns and cross-tabulating them against attributes such as age group or satisfaction, so you can see which groups hold which opinions. In Exploratory, AI functions categorize and score open-ended responses, and the results can be used directly in tabulation and visualization.
Summary
There’s no single “best” survey data analysis software for everyone.
If you only need simple tabulation, Excel or your survey platform’s built-in features may be enough. If your main goal is sharing results with many people as dashboards, BI tools are a good fit. If your work centers on statistics and your organization already uses it, SPSS may be the sensible choice. And if you need maximum flexibility and your team can code, R and Python are extremely powerful.
On the other hand, if you want to manage the whole sequence—
Importing data
Preparing it
Building topline tables and cross-tabs
Running statistical analysis
Analyzing open-ended responses with AI
Creating reports
Reusing the same analysis in the next survey
—as a single reproducible workflow, Exploratory is an option worth considering. Fast with AI, reliable with workflows, and deep with statistics.
In survey analysis, it’s not enough to simply produce results. You need to be able to see how those results were produced, and reproduce them the same way next time.
When choosing a tool, look beyond the tabulation in front of you and consider the entire workflow, including everything before and after the analysis.
Try Survey Data Analysis in Exploratory
Exploratory survey analysis feature page: See topline tables, cross-tabs, multiple-response questions, Top2Box, weighting, and AI-powered open-ended analysis in the actual product. - Link
Blog post: Exploratory v16 – Survey Data Analysis, More Efficient and Deeper - Link
You can try Exploratory right away with a 30-day free trial (no credit card required). Start with topline tables and cross-tabs using your own survey data.