Blog
The latest blog posts from Exploratory.

This post shows how the method works step by step, when it works well, and how to use it in Exploratory.
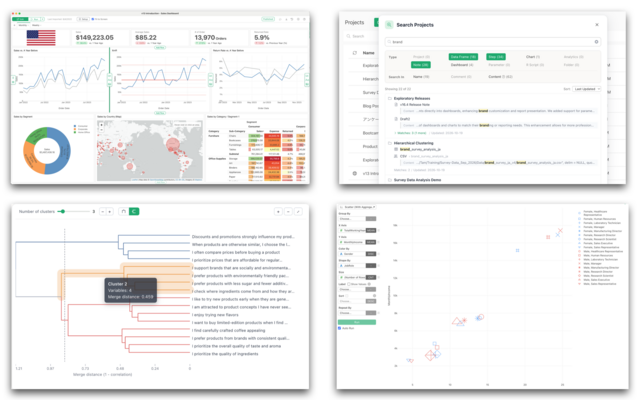
Exploratory v16.4 brings powerful new analytics capabilities, improved visualizations, more flexible dashboards, and a faster, more intuitive workflow.

This post explains how Hierarchical Clustering works, how to read the tree, and how to use it in Exploratory.

This post explains how K-Medoids Clusteringd works, why it is a good fit for survey data, and how to use it in Exploratory.

In this article, we’ll lay out the key criteria for choosing survey data analysis software, then look at what Excel, BI tools, SPSS, R / Python, and Exploratory are each best suited for.
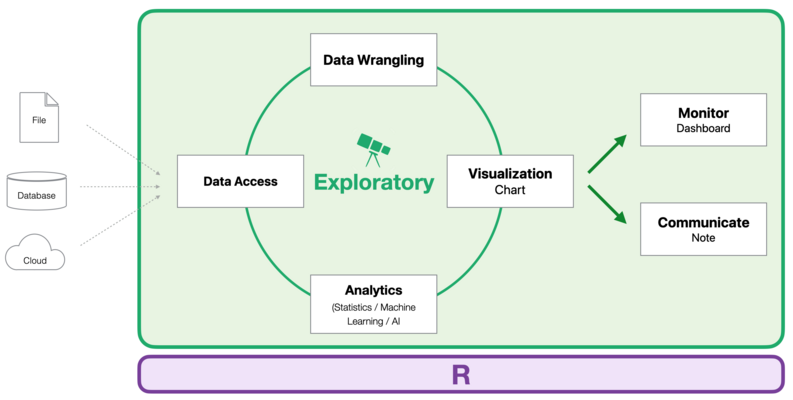
In this post, we explain what you can do with Exploratory, who are the users, and what are the problems it can solve.
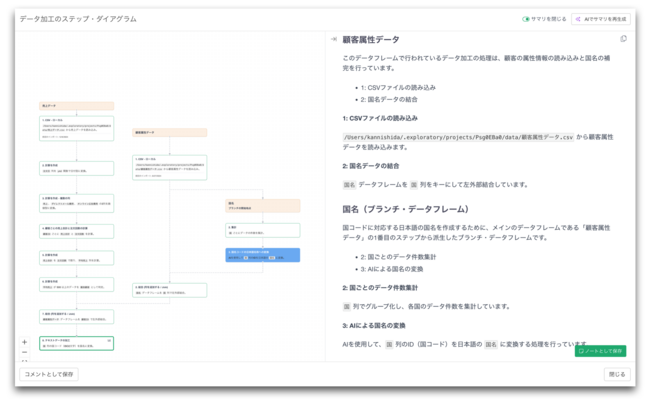
AI makes data analysis fast and easy, but the results are not always correct. Trustworthy data analysis requires readability, reproducibility, and reliability.
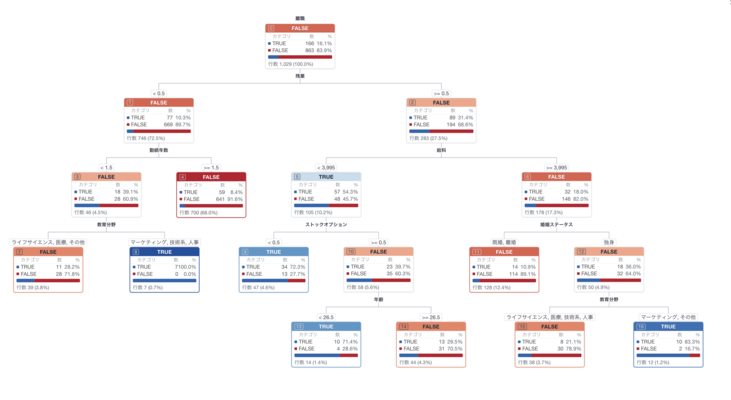
An explanation of decision trees using CART (Classification and Regression Tree), a representative decision tree algorithm.

In the AI era, four capabilities matter more for data analysis: statistical literacy, scientific thinking, understanding analytical methods and interpreting results, and data wrangling skills.
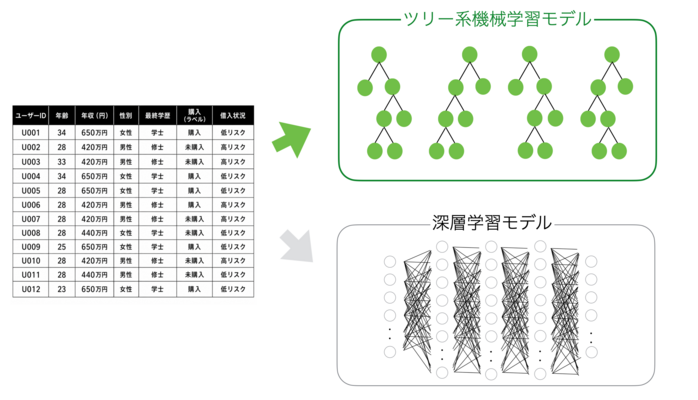
Why models such as XGBoost and LightGBM still dominate structured data.